Pros and cons of an integrated weed management farming system - findings from the central Qld farming systems trial
Pros and cons of an integrated weed management farming system - findings from the central Qld farming systems trial
Author: Darren Aisthorpe (DAF Qld) | Date: 21 Jul 2020
Take home message
- Integrated weed management has performed better than the Baseline system across most of the indices measured as part of the farming systems trial
- Additional biomass production has not correlated with additional yield, relative to other systems using the same crop rotation
- The improved performance has come at a nutritional cost which will need to be managed if implemented on a broader scale.
Introduction
Growers face challenges from declining soil fertility, increasing herbicide resistance, and increasing soil-borne pathogens in their farming systems. Changes will be needed to meet these challenges and to maintain the productivity and profitability of our farming systems.
The Queensland Department of Agriculture and Fisheries (QDAF), CSIRO and the New South Wales Department of Primary Industries (NSW DPI) are collaborating to conduct an extensive field-based farming systems research program. This program focuses on developing farming systems to better use the available rainfall to increase productivity and profitability.
The northern farming systems project is investigating how modifications to farming systems affect the performance of the cropping system as a whole over multiple crops in the sequence. This involves assessing aspects of these systems including water use efficiency, nutrient balance and nutrient use efficiency, changes in pathogen and weed populations and changes in soil health.
System rules and protocols were developed around agronomic practices (i.e. rows spacing, plant population), crop types and rotations, crop frequency, planting time/windows, tillage practices, fertiliser rates and planting moisture triggers to preserve the integrity of each of the six systems in place at Emerald. Crops for all systems, excluding the integrated weed management (IWM) system, were managed under a no-till, controlled traffic planting with full stubble retention. Narrow row crops (≤ 50cm) are typically sown with a double-disc opener and wide-row crops were sown with a tyned precision planter.
- Baseline
A conservative zero tillage system targeting one crop/year. Crops are limited to wheat, chickpea and sorghum, with nitrogen rates for cereals targeting median seasonal yield potential for the measured Plant Available Water (PAW) at planting. Aligned with the Baseline system at the Pampas core site.
- Higher crop intensity
Focused on increasing the cropping intensity to 1.5 crops/year when water allows. Crops include wheat, chickpea, sorghum, mungbean and forage crops/legumes, with nitrogen rates on cereals targeting median seasonal yield potential. Aligned with the Higher crop intensity system at the Pampas core site.
- Higher legume
The frequency of pulses in the Baseline system is increased (i.e. one pulse crop every two years) to assess the impact of more legumes on profitability, soil fertility, disease and weeds. Nitrogen rates on cereals targeting median seasonal yield potential. Aligned with the Higher legume system at the Pampas core site.
- Higher nutrient supply
Nitrogen and phosphorus rates of the Baseline system are increased targeting 90% of yield potential based on soil moisture in an environment of variable climate. The crops and other practices are the same as the Baseline system. Aligned with the Higher nutrient system at the Pampas core site.
- Higher soil fertility
Based on the Higher nutrient supply system an additional 60 t/ha of manure (wet weight) was applied to change the starting soil fertility level. This system is designed to see if higher initial soil fertility can be maintained with greater nutrient inputs. Aligned with the Higher fertility system at the Pampas core site.
- Integrated weed management (IWM)
This minimum tillage system is focused on one crop/year but can employ a wide range of practices to reduce the reliance on traditional knockdown herbicides in Central Queensland (CQ) farming systems. The IWM system used a narrow row spacing of 25 cm and a wider row spacing of 50 cm for crops such as sorghum. Target plant populations are also lifted by 50% to also increase competition (60,000 plants/ha instead of 40,000/ha). Crops include wheat, chickpea, sorghum and mungbean, with nitrogen rates on cereals targeting median seasonal yield potential.
Water balance and dynamics
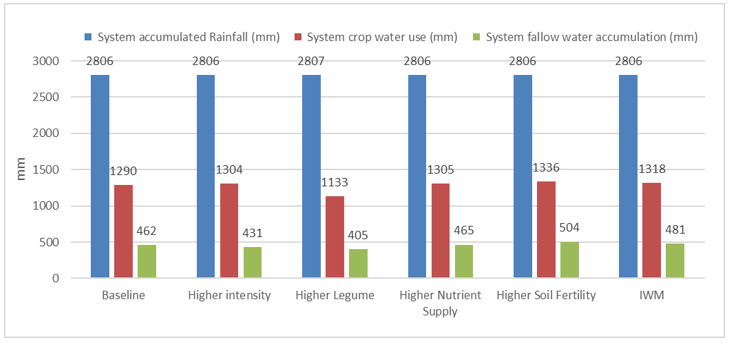
Figure 1. Comparison of systems water use and fallow water accumulation over the duration of the trial. Blue bars indicate total rainfall since planting in 2015, red bars indicate calculated total water used by each of the systems and the green bars indicate total fallow water accumulated over the duration of the trial.
Of the total rainfall received to date on the Emerald site, only a quarter of it has fallen in crop. The efficiency of how different systems converted the fallow rainfall into plant available water varied by an accumulated value of 88 mm PAW over the past five years between the Higher fertility system (504 mm PAW) and the Higher legume system (405 mm PAW) (Figure 1).
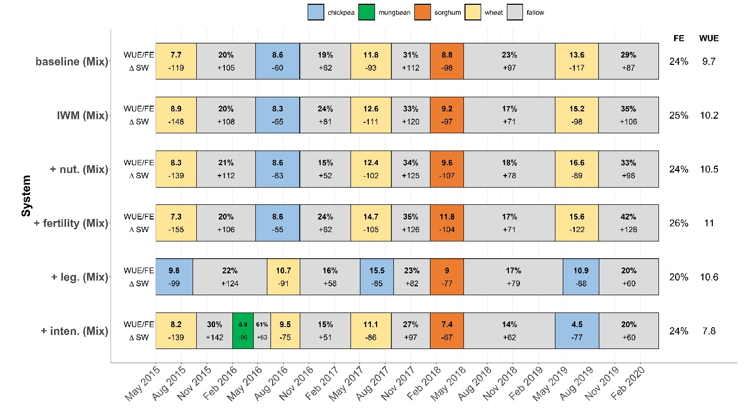
Figure 2. All six-systems crop rotation, grain WUE, Fallow Efficiency (FE %) and soil PAW fluctuations (+/- mm) measured at planting or harvest over the life of the trial to date. To the right of the graph are system FE and WUE figures to date.
Rainfall Use Efficiency (RUE), $/mm rain received, is the ultimate indicator of how efficiently a system is converting rainfall to income. However, this is calculated based on two other key measures of water capture and use efficiency, these being; fallow efficiency (FE %): how much fallow rainfall a system is able to capture over a growing period; and water use efficiency (WUE) (kg/ha/mm): a calculation that determines how much grain (kg) is produced per hectare relative to available water during the growing season.
FE % is calculated by dividing fallow rainfall by the change in PAW between harvest of the last crop and planting of the next crop. A value of 20 – 25% for a zero-till system on cracking vertosol soils is a rule of thumb figure for capture of fallow rainfall. As of planting in 2019, all systems were sitting close to or in this range (Figure 2). Higher legume has the lowest FE % of all the systems at 20%, while the Higher fertility system has the highest on 26%. The IWM systems has averaged 25% over the same period, which was 1% better than the two other systems using the same cropping rotation.
Crop WUE (kg/mm) provides an insight into how efficiently each individual crop is converting available water into grain and/or biomass. The WUE (kg/ha) calculation is:
The calculation for the water used figure is (PAW @ planting – PAW @ harvest) + any rainfall (or irrigation) which was applied between planting and harvest.
To winter planting 2020, Crop (grain) WUE saw the Higher fertility system ahead of all other systems, with an efficiency value of 11.3 kg/mm, a 1.3 kg/mm improvement over the Baseline system. The IWM system sits middle of the pack at 10.5 kg/mm, still a 0.5 kg improvement over the Baseline system for only the addition of extra seed and narrower row spacing.
Table 1. System water dynamics indices from 2015 to winter plant 2020.
System | Rainfall (mm) | System crop water used (mm) | System rainfall usage efficiency | WUE grain (kg/mm/ha) | WUE biomass (kg/mm/ha) | Grain produced per Ha (kg/ha) | Biomass produced per Ha (kg/ha) | Difference grain/ha produced (kg/ha) | Difference biomass/ha produced (kg/ha) |
|---|---|---|---|---|---|---|---|---|---|
Baseline | 2806 | 1290 | 46 % | 10.0 | 31 | 12911 | 39573 | 0 | 0 |
Integrated weed management | 2806 | 1318 | 47 % | 10.5 | 35 | 13780 | 45715 | 869 | 6142 |
Higher nutrient Supply | 2806 | 1305 | 46.5 % | 10.7 | 31 | 13947 | 40567 | 1036 | 994 |
Higher fertility | 2806 | 1336 | 47.6 % | 11.3 | 33 | 15125 | 44087 | 2213 | 4514 |
The table above shows the crop water use efficiency data for the four systems which have maintained the same cropping rotation since the start of the trial. This has meant the same planting date and the same harvest date. As such, the fallow and in-crop rainfall are the same for all four systems.
Despite the background treatment differences in all four systems listed in Table 1, the spread of system rainfall usage efficiency across the period have been relatively minimal with a spread of only 1.6%. However, total grain and plant material (biomass) produced show clear differences in system performances over the past five years.
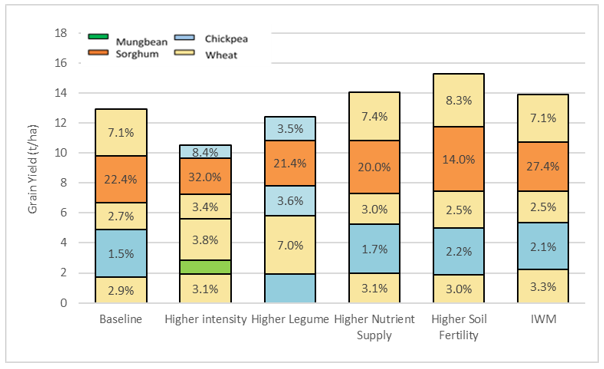
Figure 3. Cumulative crop yields over the past 5 years and associated grain screenings for each of those crops
Typically, there is a strong correlation between biomass production and final grain yield. However, this has not been the case for these Emerald systems. The IWM system has produced the most biomass per hectare over the life of the trial to date. However, both Higher fertility and Higher nutrient supply have produced more grain (Table 1). The Higher fertility system also captured more water in the fallow (503 mm) than the IWM system (481 mm). The Higher nutrient supply system only 16 mm lower at 465 mm over five.
Despite the higher cumulative biomass produced by the IWM system, grain screenings have stayed on par with the other three systems using the same cropping rotation; the only exception being the 2018 sorghum crop that crop saw screenings rise to 27% compared to the 22.4%, 20 % and 14% of the other three systems (Figure 3). However, yield was still similar to Baseline and Higher nutrient supply.
A 2,000 ha cropping operation in CQ with an average rainfall of 560 mm running a Baseline system over a five-year period would have produced 25,800 tonnes of grain. In comparison, using the IWM system would have produced 27,500 tonnes of grain (7% improvement over baseline), the Higher nutrient supply system would have produced 27,900 tonnes (8% improvement over baseline) and the Higher fertility system would have produced 30,250 tonnes (17% improvement over baseline), all for the same amount of water available.
System profitability performance
The Higher fertility system (at $1.14/mm/ha) has been 6.5% more profitable than the second-best system, Higher legume (at $1.07/mm/ha) over the past five years (Table 2). The IWM system (at $1.05/mm/ha) is sitting in the middle of the pack, similar to Higher nutrient supply and Higher legume from an economic standpoint.
Its performance has exceeded the Baseline system (at $0.93/mm/ha) without the cash boost from higher value legume crops, or the extra boost from nitrogen (N) and phosphorus (P) application for potentially higher yield. However, it is reasonable to question how long this treatment will be able to stick with these two other systems as fertility begins to run down.
Table 2. Summary table of operating revenue and expenditure of the six systems over the life of the trial to December 2019. Table also shows the accumulated gross margin (GM), system return on variable costs (ROVC) and what our GM/mm of rainfall over the duration of trial.
System | System income ($/ha) | System fallow costs ($/ha) | System variable costs ($/ha) | System gross margin ($/ha) | System return on variable costs ($/ha) | System WUE GM ($/mm) |
|---|---|---|---|---|---|---|
Baseline | $4,061 | $484 | $1,012 | $2,392 | $4.01 | $0.93 |
Higher intensity | $2,842 | $474 | $1,238 | $1,343 | $2.30 | $0.52 |
Higher legume | $4,485 | $484 | $1,031 | $2,733 | $4.35 | $1.07 |
Higher nutrient supply | $4,371 | $484 | $1,055 | $2,659 | $4.14 | $1.03 |
Higher soil fertility | $4,635 | $484 | $1,048 | $2,954 | $4.42 | $1.14 |
IWM | $4,309 | $484 | $932 | $2,722 | $4.62 | $1.05 |
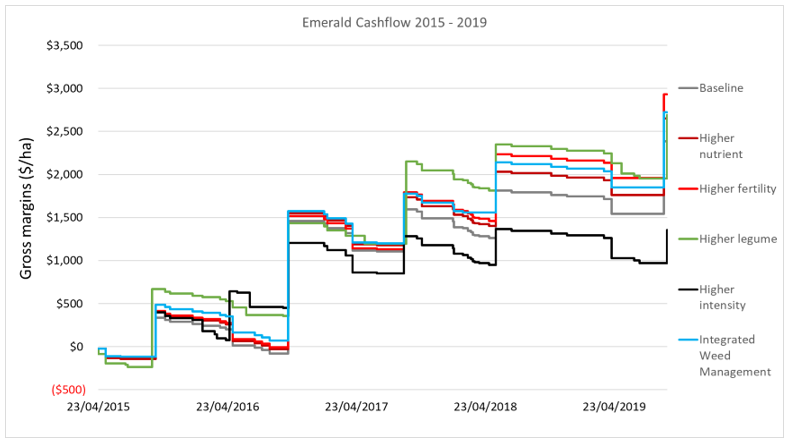
Figure 4. Systems’ cash flow - 2015 to harvest 2019 for all six systems. All systems have been profitable to date; however, since the winter crop of 2016, the Higher intensity system has struggled to improve.
The gross margins ($/mm/ha) values in Table 2 can also be extrapolated to the theoretical 2,000 ha cropping enterprise in CQ with an average rainfall of 560 mm over a five-year period. The expected gross margin for a Baseline-based farming system would be $5.2 million. The Higher nutrient supply system would have generated an additional $560,000 for the same amount of water. The IWM system would have generated $672,000 more than Baseline and impressively, the Higher fertility system would have generated an addition $1.2 million over Baseline for the same average rainfall in CQ over the five-year period.
Nutrient balance and dynamics
Nitrogen
Nitrogen (N) removal outstripped bagged supply for all systems as at harvest 2019 (Table 3). Of the four systems using the same rotation, Higher fertility shows the greatest deficit (-234 kg N/ha) followed by IWM at (-220 kg N/ha). The gap between IWM and Higher nutrient supply is significant at 45kg/ha. Total grain production from both systems over the past five years (Table 1) varied by less than 200 kg, in favour of Higher nutrient supply. However, biomass production in the IWM system was significantly higher with an additional 5 t/ha produced over the period.
Table 3. System nitrogen cycle observations throughout life of the trial. Note the spike in N levels for Higher fertility because of the manure applied as part of the system setup.
System | System N mineralisation in fallow | System ∆ | System N applied (kg/ha) | System N exported (kg/N) | System N balance |
|---|---|---|---|---|---|
Baseline | 466 | -2.0 | 82.8 | 289 | -206 |
Higher nutrient supply (+nut.) | 437 | 24.5 | 133.42 | 308 | -175 |
Higher soil fertility (+Fertility) | 690 | 156.1 | 101.2 | 335 | -234 |
IWM (+IWM) | 463 | -24.6 | 82.8 | 303 | -220 |
Table 4. Calculation definitions for Table 3.
System N mineralisation in fallow | Calculation - Sum of all fallow N mineralisation (kg/ha) | What is the total amount of N mineralised in fallows over the duration of the trial? |
|---|---|---|
System ∆ soil N | Calculation - N @ Baseline (t=0) (to 90 cm) - most recent N @ Harvest/planting (to 90 cm) | What has been the change in total N from planting 2015 to today? |
System N applied (kg/ha) | Calculation - Sum of all (total) N applied (kg/ha) | How much N has been applied in the form of bagged/liquid fertiliser? |
System N exported (kg/N) | Calculation - Sum of all grain N removed (kg) across all years | What is the total amount of N removed in the form of grain over the life of the trial? |
System N balance | Calculation - total N applied (kg/ha) - nutrient exported (kg/N) | Is the N nutrient running at a surplus or deficit based on grain removal? |
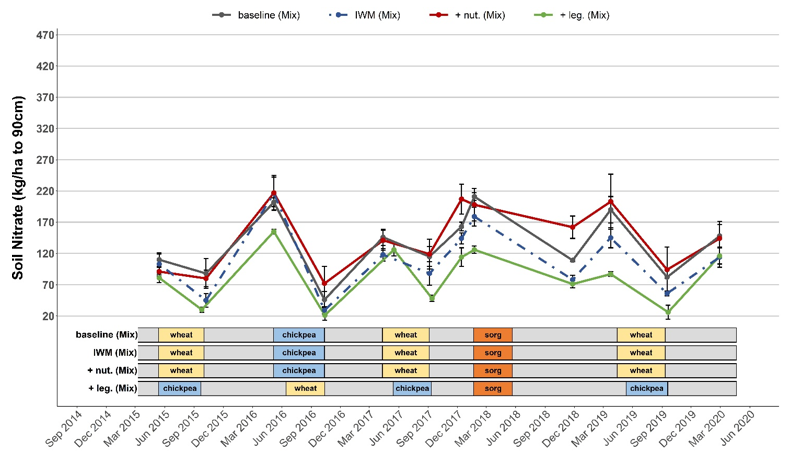
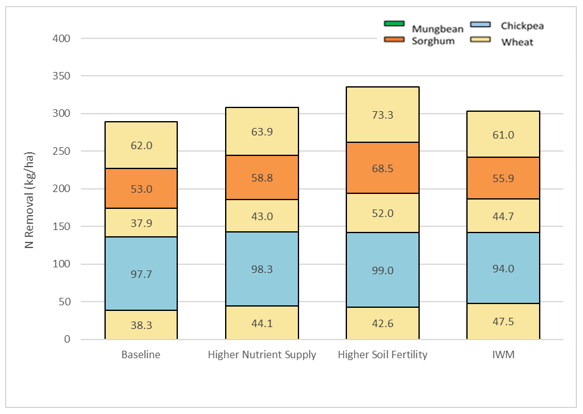
A crop-by-crop N removal comparison indicates that removal by grain for both IWM and Higher nutrient supply has been very similar (Figure 6). However, the replacement N applied was significantly higher in the Higher nutrient supply (133 kg N/ha N) than the IWM system (83 kg N/ha) (Table 3). This difference is because of the different nutrition programs applied to the two systems as described earlier. The nitrogen rates targeting 50% yield potential for IWM, rather than the 90% yield potential for the Higher nutrient supply, led to a steady run-down of N reserves over the life of the project (Figure 5). Fallow mineralisation has assisted in keeping N application to a minimum. However, available mineral N (nitrate) is now 50 kg of N/ha lower for IWM than the Higher nutrient supply (Table 3). The higher biomass production in the IWM system may be better suited to a higher nutrient supply in the future.
Figure 5. Soil nitrate levels for Baseline, IWM, Higher nutrition and Higher legumes. Note the difference in N levels between Baseline, IWM and Higher nutrient Supply over the life of the trial.
Figure 6. Crop nitrogen (N) removed based on grain analysis and crop yield - 2015 – Harvest 2019
Phosphorus and potassium
Table 5. System application and removal of (P) kg/ha from 2015 to harvest 2019 for the systems operating the same rotation.
Baseline | Higher nutrient supply | Higher soil fertility | IWM | |
|---|---|---|---|---|
System P applied (kg/ha) | 26.1 | 39 | 40.2 | 26.1 |
System P exported (kg P/ha) | 42.5 | 46 | 53 | 44.1 |
System P balance (kg P/ha) | -16.4 | -7 | -12.8 | -18 |
Grain produced/kg of P removed | 304 | 303 | 285 | 312 |
Phosphorus removal in grain exceeded replacement by granular fertiliser for all systems. The average deficit across all systems was 12.8 kg/ha of P with a spread across the systems of 14.5 kg/ha of P. The Higher nutrient supply system has gone closest to keeping P usage in equilibrium over the period thanks to the higher rates applied. Interestingly, even the higher rates applied as part of the Higher fertility system have not kept pace with yields produced and subsequent removal. IWM’s usage of P was slightly higher than Baseline, in-line with the higher yield produced. To rectify the deficit of 18 kg/ha of P in the IWM system, an additional 82 kg/ha of MAP (@ $800/t delivered Emerald) would need to be applied.
Potassium (K) usage for IWM again mirrored the Higher nutrient supply system with a total of 83 kg K/ha removed. As expected, this value was slightly lower than Higher nutrient supply at 85 kg/ha and slightly more than Baseline with 79 kg/ha of K removed.
Organic carbon
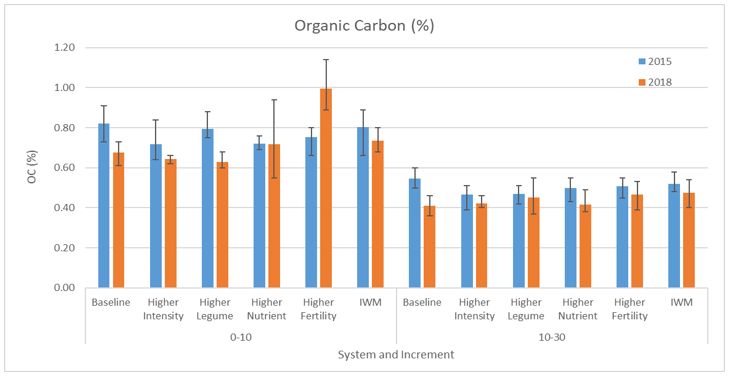
Figure 7. Observed organic carbon (%) levels at the 0-10cm increment and 10 to 30cm increments for 2015 and late 2018. Error bars indicate variation between replicates.
Only the Higher nutrient and Higher fertility systems receiving the 90th percentile nutrient applications maintained their organic carbon (OC) levels since the trial started in 2015. Higher fertility’s significant increase in OC % in the 0-10 cm band was due to application of the 51 t/ha of manure. All systems using the 50th percentile nutrition program (Baseline, Higher intensity, Higher legume and IWM systems) saw a reduction in organic carbon % (Figure 7). While variable, OC % fell less in IWM than Baseline in the top 10 cm, with lower or similar reductions to all three other comparable rotations in the 10 – 30 cm range.
Weeds
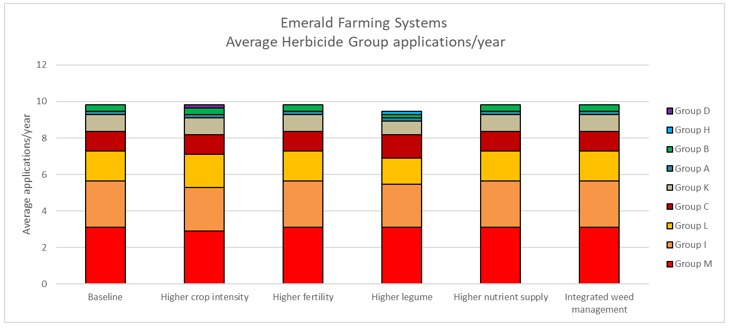
Figure 8. Average applications of herbicide chemical groups per year for each of the six systems.
Weeds are proactively managed for all systems in a timely manner at the Emerald trial site; it is not a weeds experiment, rather it is looking at the impact of IWM agronomy on the crop and system performance. Consequently, there was minimal difference in chemical applications or volumes between any of the systems. Residuals herbicides with broad crop compatibility have been used as much as possible to simplify management and not limit future cropping options.
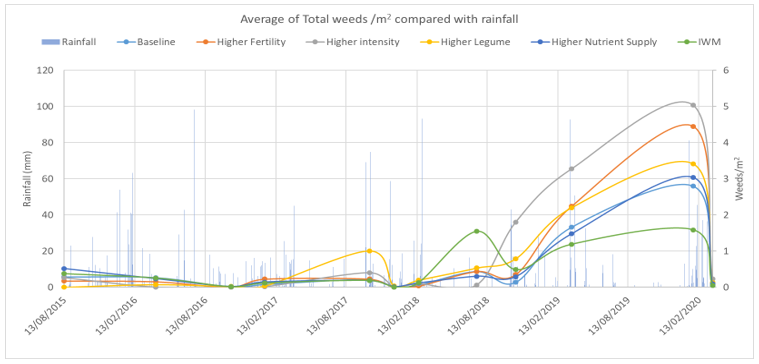
Figure 9. Daily rainfall events and total weeds/m2 observed (broadleaf and grasses) prior to spray operations across the life of the trial to date.
However, prior to any knockdown spray event, weed counts are made, with a view to identifying any linkages between system and weed populations (Figure 9). Weed emergence did spike after the sorghum crop, possibly exacerbated by the extremely dry period in 2018-2019. While the numbers are not extreme, it is interesting to note that Higher intensity treatment was observed to have the highest weed count, while the IWM system had the lowest in early 2020. The other interesting point is that broadleaf weeds make up the majority of weeds observed on site. Feathertop Rhodes grass had only one outbreak on the site since the trial commenced, and that was directly related to the manure source, rather than any treatment effect.
Conclusion
The IWM system has provided insights into the cost of a system that was managed to produce additional biomass in crops to better compete with weeds. From a financial standpoint, the IWM system has outperformed the Baseline system comfortably, and just edged out the Higher nutrient supply system over the past five years. The fallow efficiency of IWM has been one of the better systems on site. However, many would have expected better in the variable seasons given the additional biomass and ground cover compared to other systems.
The financial win over the Higher nutrient supply system (despite producing slightly less grain) may be short lived, as the additional production over Baseline to match higher nutrient supply also saw an additional draw on soil fertility. For nitrogen, mineralisation has been able to fill the gap to date, but there is a clear trend of rundown (Figure 5), which at some point will start costing yield and grain quality, particularly in a better yielding crops unless the nutrient supply is increased.
Interestingly, biomass production for IWM has exceeded all other systems, but has not been converted into higher yields. Equally, grain quality attributes have not been significantly worse than any of the other systems, except for the sorghum crop in 2018. Why yields have not increased with biomass production needs further exploration. However, the heavy rotation to winter crop so far may have favoured crops that were better able to compensate when conditions worsened during grain fill.
Importantly, the premise of the system treatment was to assess the crop and systems performance of agronomy to manage weeds. While performance data to date are generally encouraging, there has been no significant difference in weed density. Weed densities were low and have not been exacerbated due to well-timed applications of both knockdown and residual herbicides across the life of the trial.
Finally, the IWM system has potential upsides to the Baseline system, but crop nutrition will need to be adjusted to achieve this full potential. Many trials across the northern grains region have shown that summer and winter crops can benefit from higher established populations in better seasons. However, we have not seen a downside from quality when crops have a tough finish either, at least for the winter crops in this trial.
Acknowledgements
An exceptional amount of data has been collected, recorded and analysed as part of this project not only for the Emerald site, but all seven sites across Queensland and Northern NSW. The co-ordination of these activities has occurred in collaboration between CSIRO as the lead for the Pampas core site, DAF QLD as the lead for the six regional sites across QLD and NSW and NSW DPI for maintaining a consistent protocol and design for the NSW based sites.
Locally I would like to acknowledge the local growers and consultants who have given up there time to assist in the development of the six systems in place at the Emerald site and again to review and provide feedback about the trials operation and management over the past 6 years.
I would also like to acknowledge the DAF regional research agronomy technical staff based in Emerald, led by Ellie McCosker and assisted by Jane Auer, who have diligently and efficiently done all and more that has been asked of them in amassing the significant dataset that has now been collated over the past six years.
Finally, I would like to acknowledge GRDC as co-funder, with DAF QLD of the Emerald site.
The research undertaken as part of this project is made possible by the significant contributions of growers through both trial cooperation and the support of the GRDC, the author would like to thank them for their continued support.
Contact details
Darren Aisthorpe
Queensland Department of Agriculture and Fisheries
99 Hospital Rd. Emerald QLD 4720
Mb: 0427 015 600
Email: Darren.aisthorpe@daf.qld.gov.au
GRDC Project Code: DAQ1406-003RTX,

