Labour and machinery requirements: Implications of different crop sequences
Take home message
- Cropping intensity had a significant effect on labour requirements
- Diverse rotations may create higher labour demand and peak demands that may limit the adoption of diversified crop rotations in some farm businesses
- In moderate and lower rainfall environments, crop sequences with higher intensity may yield lower returns per unit of labour (i.e., more than 38% less) than those with lower crop intensities
- Cropping intensity is a critical determinant of labour organisation in the northern grain growing zone, more so than cropping diversity.
Introduction
Leading growers and advisers advocate sustainable rotations as a valuable strategy for northern farming systems within an increasingly challenging cropping environment (GRDC, 2011). Consequently, current farming systems research is focused on quantifying the impact of different cropping systems on farming system performance, including water use efficiency, N input & efficiency, grain yield, weed management, soil health effects, and profitability and risk at the paddock scale (Bell et al., 2015). While biophysical optimisation of the farming system may be possible to improve the efficiency of most cropping systems, key elements that are often ignored are how different cropping systems impact on whole-farm factors, such as requirements for labour and machinery resources. These farm-scale effects are critical because they modify farm productivity and profitability in the short and long term. Moreover, a consideration of these factors is crucial because they can influence the adoption of proposed cropping system innovations. Getting the most profitable results from a farm business requires a careful balance of limited resources to improve system performance and efficiency at an acceptable level of risk.
The central objective of this research was to investigate the effects of innovative diversified cropping systems on labour resources in the grain-growing northern region of Australia. Specifically, we aimed to:
- Determine the labour requirements for eight selected diversified rotational sequences across three different locations
- Estimate the labour productivity in terms of $ returns to labour for each system, and
- Develop labour calendars to identify periods of labour peaks and troughs and the seasonality of labour demand during the growing season.
This work is motivated to inform grain growers who must make operational, tactical or strategic decisions concerning the use of machinery and labour resources to improve the efficiency of their farming systems. The goal is to guide grain growers in their transition towards more profitable and diversified cropping systems.
Materials and methods
First, we simulated different crop consequences over 112 years (i.e. 1900 – 2012) using historical climate records in APSIM (Holzworth et al., 2014). These crop sequences represented typical rotations in the northern regions and were identified following focus group meetings with leading farmers and advisers throughout the northern cropping zone of Australia. Specifically, we focused our analysis on six rotational sequences across three sites. The rotations were selected to capture a range of cropping system intensity (i.e. the proportion of time when crops were growing) and crop diversity (i.e., the range of crops grown in the system) (Table 1). The sites analysed span high rainfall (Cecil Plains), medium rainfall (Goondiwindi) and a low rainfall zone (Mungindi) of the region. The crops in the sequences consisted of a variety of summer crops (sorghum and mungbeans) ‘set’ in APSIM to sow in December or January and winter growing crops (wheat, chickpea and faba bean), sown in May or June. Also, the crop sequences simulated were all ‘set’ so that crops were always sown at the end of their sowing window irrespective of soil water triggers being satisfied; this will have increased the likelihood of ‘failed’ crops compared to what might be expected on-farm.
Table 1. Specific crop rotations considered in the analysis
| High diversity | Low diversity | ||
|---|---|---|---|---|
System intensity | Crop sequence | % time in crop | Crop sequence | % time in crop |
High intensity | SChxWMgx | 43 | xWxWxCh | 39 |
Moderate intensity | SxSxSFbxWxChxWxx | 33 | SxSxSChxx | 34 |
Low intensity | SxxChxWxx | 28 | WxxxChxxx | 21 |
Notes: S = Sorghum, Ca = canola, Ch = Chickpea, Mg Mungbean, W= Wheat, Fb = Faba bean, x = fallow, xx = Long fallow
For each crop rotation, we calculated the labour requirement for operations including planting, spreading, spraying and harvesting.We obtained specific information on the machinery required for each of these operations, and information on a range of possible operating widths and working speeds from existing literature, local technical guides and through a consultation process with 26 farm advisers and growers (Table 2). The Effective Field Capacity (EFC), expressed as ha/hr was calculated for each implement to determine how much labour was required for each operation. An estimate of EFC was calculated as follows:
EFC in (Ha/hr/yr) = (Speed (km/hr) x width (m)) x efficiency %
10
The labour required per operation was calculated by using the inverse of effective field capacity for each implement used for the specific operation and expressed as h/ha (hours/hectare). Consequently, we multiplied the number of hours of each field operation by 120% to account for downtime tasks, such as refilling, moving and cleaning of equipment. Using this process, we determined the labour required for four common field operations, namely sowing, spreading, spraying and harvesting. Total labour was calculated by adding together the hours worked per hectare on sowing, spreading, spraying and harvesting. Labour calendars were developed to determine peaks and troughs of labour throughout the year and the seasonality of labour demand. The sum of labour hours for each month were divided by number of days in each phase of the rotation to scale labour requirements on a monthly basis. Cropping area (ha) that can be completed per unit of labour at peak demand was determined by using the inverse of maximum peak value during the year for each crop sequence and multiplied by the total hours for the month (i.e. 240hrs), assuming a unit of labour worked 12 hours a day during peak periods.
Finally, we computed the labour productivity of each of the cropping systems. Labour productivity was calculated as gross margin per unit labour used (expressed as $/hr). It indicates the amount which each labour unit earns for the farm business. Thus, gross margin per unit labour was the estimated as the gross margin ($/ha) for each of the crop sequence , divided by the total labour required (hr/ha) for the sequence. The system GM was estimated as the difference between revenues on the one hand and variable costs on the other hand, including the cost for each crop.
Table 2. Mean machinery and labour parameters estimated from farm survey
Field operation | Implement | Crop | Working width | Average | Field efficiency (%) | Effective | Laboura |
|---|---|---|---|---|---|---|---|
Sowing | Air-seeder | Chickpea, fababean, mungbean, wheat, sorghum | 12.75 | 9.00 | 80 | 9.18 | 0.13 |
Spreading | Fertiliser spreader | Chickpea, fababean, mungbean, sorghum, wheat | 22.50 | 13.00 | 80 | 23.40 | 0.05 |
Spraying | Boom sprayer | Chickpea, fababean, mungbean, sorghum, wheat | 28.00 | 21.44 | 70 | 42.00 | 0.02 |
Summer and winter fallow spray | 28.00 | 22.50 | 70 | 44.10 | 0.02 | ||
Harvesting | Header | Chickpea, fababean | 12.00 | 8.00 | 80 | 7.68 | 0.16 |
Mungbean | 12.00 | 7.60 | 80 | 7.32 | 0.16 | ||
Sorghum | 12.00 | 11.13 | 80 | 10.56 | 0.11 | ||
Wheat | 12.00 | 10.63 | 80 | 10.02 | 0.11 |
Notes: aLabour hours are the inverse of the effective field capacity multiplied by labour adjustment factor of 1.2 to account for downturn tasks.
Results
Labour requirements and variability across diverse systems
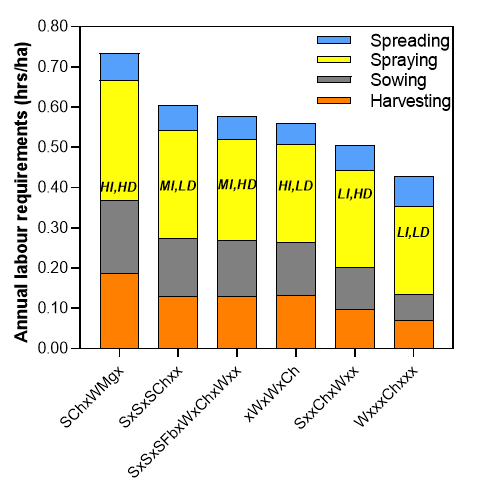
The results showed that crop sequences have a direct influence on labour requirements, with some systems requiring a much higher labour input per hectare than others. Firstly, cropping system intensity was shown to have a large influence on total labour requirement. Higher intensity systems (e.g. SChxWMgx, xWxWxCh) required 30-40% greater labour inputs per hectare than lower intensity systems (e.g. WxxxChxxx) (Figure 1). In general, the results suggest that total labour requirement are highest in those sequences with a greater diversity of crops and high intensity relative to the rest. In terms of the different field operations, the proportion of labour required for the harvesting operation was nearly the same as sowing activity even though the latter was determined based on the combined machinery work rate of both air-seeder and row-crop planter (Figure 1). However, a significant proportion of labour was required for the spraying operations, attributable to the multiple in-crop sprays and when the system is fallow. Very little labour was required for fertiliser or manure spreading operations for the eight crop rotations, possibly because it is mostly performed concurrently with sowing.
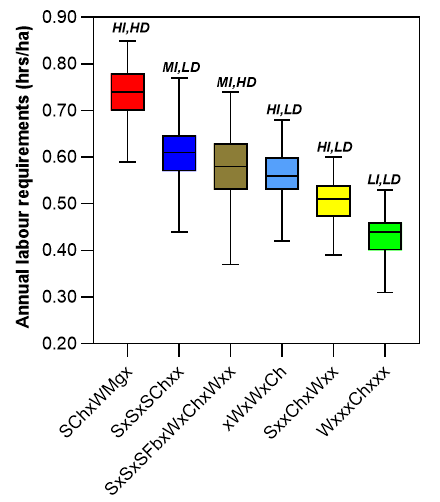
Further analysis of total labour showed a wide range of variation (Figure 2). The lowest variability was observed in the low intensity systems; SxxChxWxx ( 0.39 – 0.60 hr/ha/yr) and WxxxChxxx (0.31 – 0.53)The most variability was in the more diversified and moderately intensive system, SxSxSFbxWxChxWxx (0.37 – 0.74 hr/ha/yr), followed by SxSxSChxx (0.44-0.77 hr/ha/yr). In general, the variability caused by crop types ranged from 0.31 – 0.85 hr/ha/yr. These variations might derive from one or more crops involved in the rotation and the associated labour resource input variations.
Figure 1. Labour requirements for different field operations as influenced by diversified crop sequences. Letters on top of bars represent High intensity (HI), Moderate Intensity (MI), Low Intensity (LI), High diversity (HD), and Low Diversity (LD).
Figure 2. Total labour variability caused by diversified crop sequences. The vertical lines show the maximum and minimum values. The upper and lower edges of the boxes show the 75th and 25th percentiles, respectively, and the middle line in the box shows the median. Letters above the boxes represent High intensity (HI), Moderate Intensity (MI), Low Intensity (LI), High diversity (HD), and Low Diversity (LD).
Labour demand calendar
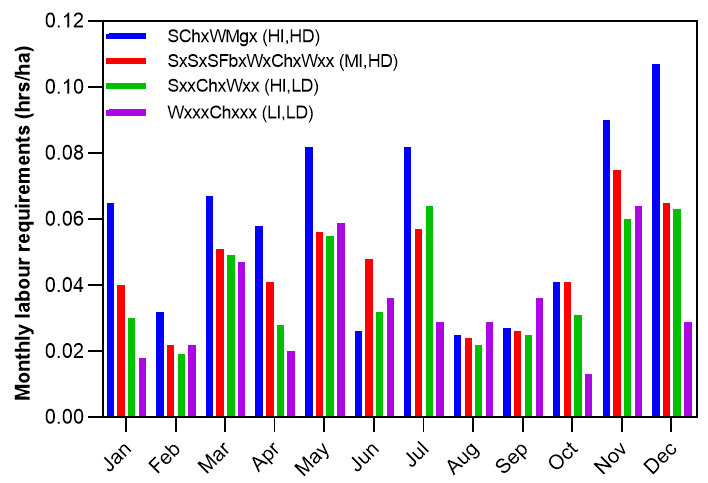
For every crop sequence, there is a calendar period during which labour requirements are at a maximum. Figures 3 shows when the peaks and troughs of labour occur throughout the year. For all sequences analysed, peak demand for labour occurred in May, July, November and in December when sowing and harvesting tend to be more intense. By contrast, there were periods of troughs and slack labour during the cropping season, and especially during February, August and September. The corresponding cropping area that can be covered by one labour unit when labour is at its peak ranged between 2,250 ha/month for the high intensity and more diverse system (SChxWMgx) to 3,700 ha/month with for low intensity and low diverse system (WxxxChxxx) (Table 3). The latter might be attributed to the rotation being less diverse (few crops), so labour did not have to be allocated to any other crops at peak times. In the former, it is the other way around. In general, a reduction in system intensity increased the area that can be covered during peak periods.
Peak periods, such as these, often require additional labour. Therefore, the results give growers a clear picture of when such extra labour might be required. However, the additional labour may often not be available. Therefore, technology or strategies that reduce the amount of labour required in the seasonal peaks is likely to increase farm profit. Moreover, identification of when these peaks and troughs of labour demand occur, allows the manager to decide how to best use the existing resources on the farm (both labour and machinery), plan ahead and plan for additional staff or resources as required. This process also helps highlight periods when staff can be encouraged to take leave and maintain a healthy work-life balance without impacting on the farming operation (GRDC, 2013). Taken together, these patterns of labour distribution imply that diverse rotations may create higher labour demand and seasonal peaks that might, in some cases, limit the adoption of diversified crop rotations in some farm businesses. This suggests that labour efficiency can be an important consideration when planning an appropriate crop sequence, diversity and intensity for a farm business.
Figure 3. Monthly total labour requirements for diversified crop sequences. Letters in parenthesis represent High intensity (HI), Moderate Intensity (MI), Low Intensity (LI), High diversity (HD), and Low Diversity (LD).
Table 3. Area that can covered per month per labour unit at peak labour demand
| High diversity | Low diversity | ||
|---|---|---|---|---|
System intensity | Crop sequence | Area (ha) | Crop sequence | Area (ha) |
High intensity (> 1) | SChxWMgx | 2250 | xWxWxCh | 3100 |
Moderate intensity | SxSxSFbxWxChxWxx | 3200 | SxSxSChxx | 3100 |
Low intensity | SxxChxWxx | 2300 | WxxxChxxx | 3700 |
Notes: S = Sorghum, Ca = canola, Ch = Chickpea, Mg Mungbean, W= Wheat, Fb = Faba bean, x = fallow, xx = Long fallow
One labour unit is assumed to work a maximum of 240 hours per month.
Dollar returns on labour
While the above analysis shows that farming systems result in different labour demands, the ability of these systems to generate enough revenue to cover these additional inputs must also be considered. That is a higher return system has more capacity to pay for the higher labour inputs required, and vice versa. The results here show that the optimal labour productivity was achieved with quite different farming systems at the different production environments.
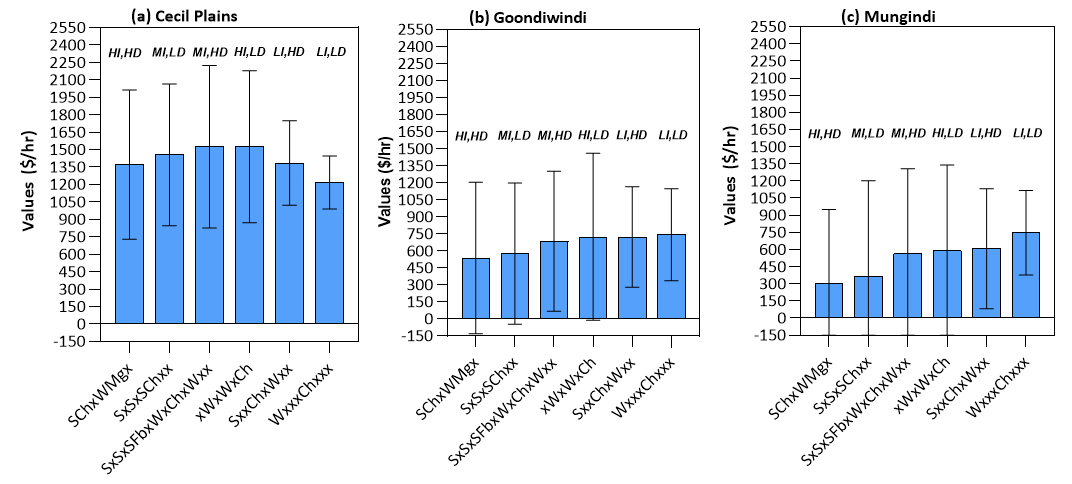
At the higher rainfall site (i.e. Cecil Plains) the returns per unit of labour for the moderate intensity and more diverse system (SxSxSFbxWxChxWxx) and the higher intensity and low diverse system (xWxWxCh) were identical, that is $1,524/hr and $1,525/hr, respectively. By comparison, the low intensity and less diverse system (WxxxChxxx) produced the lowest returns per unit of labour at $1,217/hr. Interestingly, the low intensity and less diverse systems (WxxxChxxx) also yielded higher returns to labour at both Goondiwindi ($743/hr) and Mungindi ($746/hr) due to the lower labour inputs, whereas the high intensity sequence (SChxWMgx) was relatively low averaging $539/hr because of the high labour input. At Goondiwindi, the return per unit of labour obtained for the high intensity and high diverse system SChxWMgx was about 38% less than that achieved with the low intensity and low diverse system (WxxxChxxx). At Mungindi, this difference increased to 143% less when the two systems were compared. Overall, the magnitude of labour productivity for all systems analysed is significantly greater in the higher rainfall environment of Cecil Plains than those presented in the moderate and harsher environments like Goondiwindi and Mungindi, respectively. This indicates that labour productivity in terms of $return per a unit of labour is unsurprisingly often higher in higher rainfall environments rather than in lower rainfall environments.
Figure 4. Mean GM returns per unit of labour as influenced by diversified crop sequences at (a) Pampas (b) Goondiwindi, and (c) Mungindi. Error bars represent the standard deviations. Letters on top of the bars represent High intensity (HI), Moderate Intensity (MI), Low Intensity (LI), High diversity (HD), and Low Diversity (LD).
Conclusion
While the farm labour resource is complex, awareness of issues that influence the need for labour at different times of the year, such as the diversity and intensity of cropping systems can directly assist farm resource planning. Efficient use of available labour can also have bearing on the selection of appropriate crop sequences and cropping intensities. This study showed how labour organisation is influenced by diversified crop rotations. The results showed that diversified crop rotations had a significant effect on labour requirements. The high intensity crop sequences required much higher labour input per hectare than the low intensive and less diverse systems. Therefore, reduced intensity of cropping may help decrease labour by saving working hours. Rotation selection can have a large impact on the $ returns per unit of labour with the more diverse systems achieving higher labour productivity. Our analysis highlights the importance of addressing labour productivity as labour resources are often scarce and availability can vary through the cropping season. It provides an important insight into the decisions growers face while aiming to maximise profit from limited available resources, such as labour., Labour productivity should not be evaluated in isolation as it is directly related to both the cost of labour and profit margins. In the next phase of this work, we intend evaluating the cost of labour in conjunction with crop machinery investment and cost per hectare, financial efficiency, and profitability.
Acknowledgements
The research undertaken as part of this project is made possible by the significant contributions of growers through both trial cooperation and the support of the GRDC, the authors would like to thank them for their continued support.
References
Australian Bureau of Agricultural and Resource Economics and Sciences (ABARES, 2018).
Bell, LW., Whish, J., Zull, A. and Gentry, J. (2015). Performance of current northern farming systems. GRDC Update paper.
GRDC (2011). Choosing Rotation Crops – North. Short-term profits, long-term payback. GRDC Fact Sheet.
GRDC (2013). Filling the farm labour gap. GRDC Fact Sheet.
Hochman, Z., Prestwidge, D., & Carberry, P. S. (2014). Crop sequences in Australia’s northern grain zone are less agronomically efficient than implied by the sum of their parts. Agricultural Systems, 129, 124-132
Holzworth DP, Huth NI, deVoil PG, et al. (2014) APSIM - Evolution towards a new generation of agricultural systems simulation. Environmental Modelling and Software, 62, 327-350.
Sinha, A. K., Shrivastava, A. K., Gautam, A. K., & Ahamad, S. (2016). A Decision Support System for Farm Mechanization with the Use of Computer Modelling For Soybean-Wheat Crop Rotation. International Journal of Innovative Science Engineering and Technology, 3(7).
The Australian Bureau of Statistic (ABS, 2018).
Contact details
Dr Julius Kotir
CSIRO Agriculture and Food
PO Box 102, Toowoomba Qld 4350, Australia
Mb: 0404 650 811
Email: Julius.kotir@csiro.au
GRDC Project Code: CSP1707-019RTX,
Was this page helpful?
YOUR FEEDBACK


