Causes of poor ryegrass results & paraquat & glyphosate resistance - 2020 season
Author: Peter Boutsalis (Plant Science Consulting & School of Agriculture, Food & Wine, University of Adelaide), John Broster (Charles Sturt University) & Christopher Preston (School of Agriculture, Food & Wine, University of Adelaide)1 | Date: 17 Feb 2021
Take home messages
- Ryegrass blowouts are a result of large seedbanks, insufficient weed control strategies and herbicide resistance
- Pre-emergence herbicides offer alternative modes of action to control multiple resistant ryegrass and extend the duration of activity
- Glyphosate resistance in annual ryegrass continues to increase whereas resistance to paraquat remains very low
- Improving herbicide efficacy by good application can reduce selection for herbicide resistance.
Ryegrass blowouts in 2020
The 2020 season saw the return of good rainfall across a large part of the NSW cropping zone. Ryegrass seed can survive in the seedbank for up to three years and longer if dry seasons prevail as occurred in the past few years in this region. Over the past few decades, controlling ryegrass with a single management practice is becoming increasingly difficult as the germination window of ryegrass has increased. Use of a single tactic can cause serious blowouts. Multiple tactics are often required to manage ryegrass particularly during a long season as in 2020 in NSW. Practices such as one or more double-knocks, a robust pre-emergence herbicide or herbicide mixture (Figure 1), in-crop effective post-emergent herbicides (if resistance testing has indicated susceptibility or low resistance), crop-topping if in a suitable crop and harvest weed seed control are necessary to combat ryegrass germinating during the growing season. A greater diversity of pre-emergence herbicides are becoming available with multiple modes of action providing greater benefits including duration of activity and control of multiple resistant ryegrass. It is important to introduce herbicides with alternative modes of action into cropping rotations to reduce herbicide resistance. Ultro® (Group E) and Overwatch® (Group Q) have been registered for the 2021 cropping season for use in pulses and wheat, barley and canola, respectively.

Figure 1. Averaged data showing efficacy of pre-emergence herbicide combinations from field trials in SA, Vic and NSW. As a standalone, Sakura® provided the best control. Tank-mixing or sequential applications improved control (Project code UA00113).
In addition to herbicide choice, there are several other factors such as using full label rates, good application techniques and spraying under ideal conditions that are required to optimise weed control. These are discussed for glyphosate below but are valid for most other herbicides. For pre-emergence herbicides specifically, the stubble load and rainfall prior and after sowing are two additional critical factors. Herbicides must wash off stubble and come into contact with the seed or in close proximity to be active. The germination phase of a seed is important for some herbicides. The mode of action of trifluralin is to prevent the first stage of germination with control reduced on seeds that have already started germinating (Figure 2) with Sakura and Boxer® Gold effective if sufficient moisture distributes the herbicide in close proximity to the seedling.
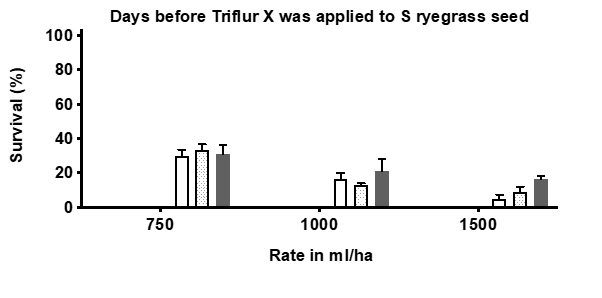
Figure 2. Percent survival of a herbicide susceptible ryegrass biotype measured 4 weeks after treatment. Three rates of Triflur X, Boxer Gold and Sakura were applied in pots. Product rates (mL/ha) are shown in the x-axis. Herbicides were applied on 13 July 2015 to seed that had been exposed to moisture 0, 3, 5, 7, 10, 12 and 14 days prior. Error bars indicate standard error of the means. No plots shown for Sakura and Boxer Gold as no survival was observed even at the lowest rate. As product is applied direct to seed, rates applied are lower or at the low end of label rates as this equates to robust field rates.
A long season can result in ryegrass germinating over an extended period. Whilst the competitive effects of later germinating ryegrass can be minimal on crop yield, the additional contribution of seed into the seedbank from these late germinators can be important for the following seasons. The presence of herbicide resistance can restrict the herbicide options available. Resistance testing can help in identifying herbicides to avoid if no longer effective.
Incidence of resistance in NSW
The GRDC continues to fund random weed surveys in cropping regions to monitor for changes in resistance levels in key weed species. The methodology involves collecting weed seeds from paddocks chosen randomly at pre-determined distances. Plants are tested in outdoor pot trials during the growing season. The majority of annual ryegrass populations in NSW are resistant to Group A ‘fop’ and Group B herbicides with some variability between the surveyed sub-regions (Table 1). No populations have been found that are resistant to the newer pre-emergent herbicides although this has been reported in other states. Of particular concern is the amount of populations resistant to glyphosate in some of the sub-regions.
Table 1. Extent (percentage) of herbicide resistance in annual ryegrass populations collected in NSW random surveys (resistance defined as populations with >20% survival)
NSW | 2019 eastern NSW | 2015 western | 2016 NSW northern | 2016 NSW plains | 2017 southern NSW | 2018 NSW slopes | |
|---|---|---|---|---|---|---|---|
diclofop | 59 | 92 | 16 | 32 | 65 | 84 | 77 |
clethodim | 2 | 12 | 1 | 1 | 1 | 3 | 0 |
sulfometuron | 50 | 82 | 30 | 22 | 35 | 74 | 70 |
imazamox/imazapyr | 47 | 83 | 8 | 22 | 39 | 75 | 76 |
trifluralin | 1 | 2 | 2 | 0 | 0 | 1 | 1 |
prosulfocarb + S-metolachlor | 0 | 0 | 0 | 0 | 0 | 0 | 0 |
pyroxasulfone | 0 | 0 | 0 | 0 | 0 | 0 | 0 |
glyphosate | 5 | 14 | 6 | 5 | 0 | 7 | 3 |
Samples | 608 | 53 | 117 | 94 | 111 | 128 | 105 |
Among the other species, resistance was much lower. 29% of wild oat populations across NSW were resistant to Group A ‘fop’ herbicides (Table 2). Group B ‘SU’ resistance was common for sow thistle (43%) and Indian hedge mustard (27%) across the state, with this rising to 75% of sow thistle populations in eastern NSW resistant (data not shown). Three populations (1%) of sow thistle from northern NSW were resistant to glyphosate. Of the wild radish populations surveyed, 38% were resistant to diflufenican and 23% to 2,4-D amine (Table 2)
Table 2. Extent (percentage) of herbicide resistance in populations of the other species collected in NSW random surveys (resistance >20% survival, * herbicide not tested or not applicable for species)
Herbicide group | Wild oats | Barley grass | Brome grass | Sow thistle | Wild radish | Indian hedge mustard |
|---|---|---|---|---|---|---|
diclofop | 29 | 0 | 0 | * | * | * |
clethodim | 1 | 0 | 0 | * | * | * |
sulfometuron | 4 | 1 | 7 | 43 | 4 | 27 |
imazamox/imazapyr | * | * | 2 | * | 0 | 8 |
atrazine | * | * | * | * | 4 | 0 |
diflufenican | * | * | * | * | 38 | 4 |
2,4-D Amine | * | * | * | 1 | 23 | 2 |
triallate | 0 | * | * | * | * | * |
paraquat | * | 3 | * | * | * | * |
glyphosate | 0 | * | 0 | 1 | 0 | 0 |
Samples | 511 | 133 | 110 | 202 | 28 | 71 |
Incidence of paraquat resistance
Resistance to paraquat has been detected in a few ryegrass populations from WA, SA, Vic. They have typically originated along fencelines, non-cropped farm areas, lucerne/clover seed production paddocks and vineyards (Figure 3). Detection has been via random weed surveys or samples sent to Plant Science Consulting and Charles Sturt University following reduced control in the field. While the number remains low it is important to use paraquat according to label recommendations with emphasis on rate, growth stage and population size. The first case of paraquat resistance in ryegrass detected globally was in South African orchards after decades of use on advanced growth stages resulting in sub-lethal effects (Yu et. al. 2004). More locally, a sample of perennial ryegrass was confirmed highly resistant to paraquat from a vineyard in the Adelaide Hills in 2019 following application of sublethal rates of paraquat for many years to keep the ryegrass suppressed but maintain ground cover (P. Boutsalis). This sample was also highly resistant to glyphosate.

Figure 3. Efficacy of the first confirmed cases of paraquat resistance in annual ryegrass from SA, Vic and WA. Error bars indicate variation. Study conducted by Plant Science Consulting.
Additionally, two populations of barley grass resistant to paraquat and one developing resistance (10-20% survival) have been collected during the NSW random surveys.
Incidence of glyphosate resistance in NSW
Bayer CropScience provides free access to the Resistance Tracker website consisting of thousands of weed samples from resistance testing across Australia. This website enables the searching of resistance according to weed species, mode of action herbicide, postcode and closest town with data presented from 2003 (Figure 4).
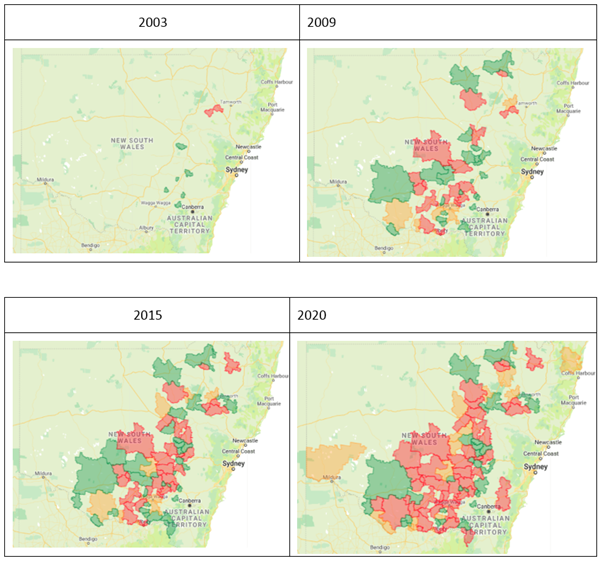
Figure 4. Occurrence of glyphosate resistance in annual ryegrass in NSW in 2003, 2009, 2015 and 2020. Dark green shading = postcode regions where testing has not detected glyphosate resistance in ryegrass, orange shading = postcodes where glyphosate resistance is developing and red shading = postcodes where resistance has been detected.
2020 season: The early break in 2020 across most southern cropping regions resulted in an opportunity for knockdown weed control. Multiple applications of glyphosate and paraquat were possibly targeting multiple flushes of weeds, in particular ryegrass from early autumn prior to sowing. Plants surviving glyphosate from WA, SA, Vic and NSW were sent to Plant Science Consulting for testing using the Quick-Test method to verify whether herbicide resistance had contributed to survival in the field. The data presented in Figure 5 indicates that 43%, 70% and 78% of ryegrass samples sent from SA, Vic and NSW in 2020 respectively, were confirmed resistant to glyphosate. This highlights that in a majority of cases, glyphosate resistance has contributed to reduced control in the paddock.
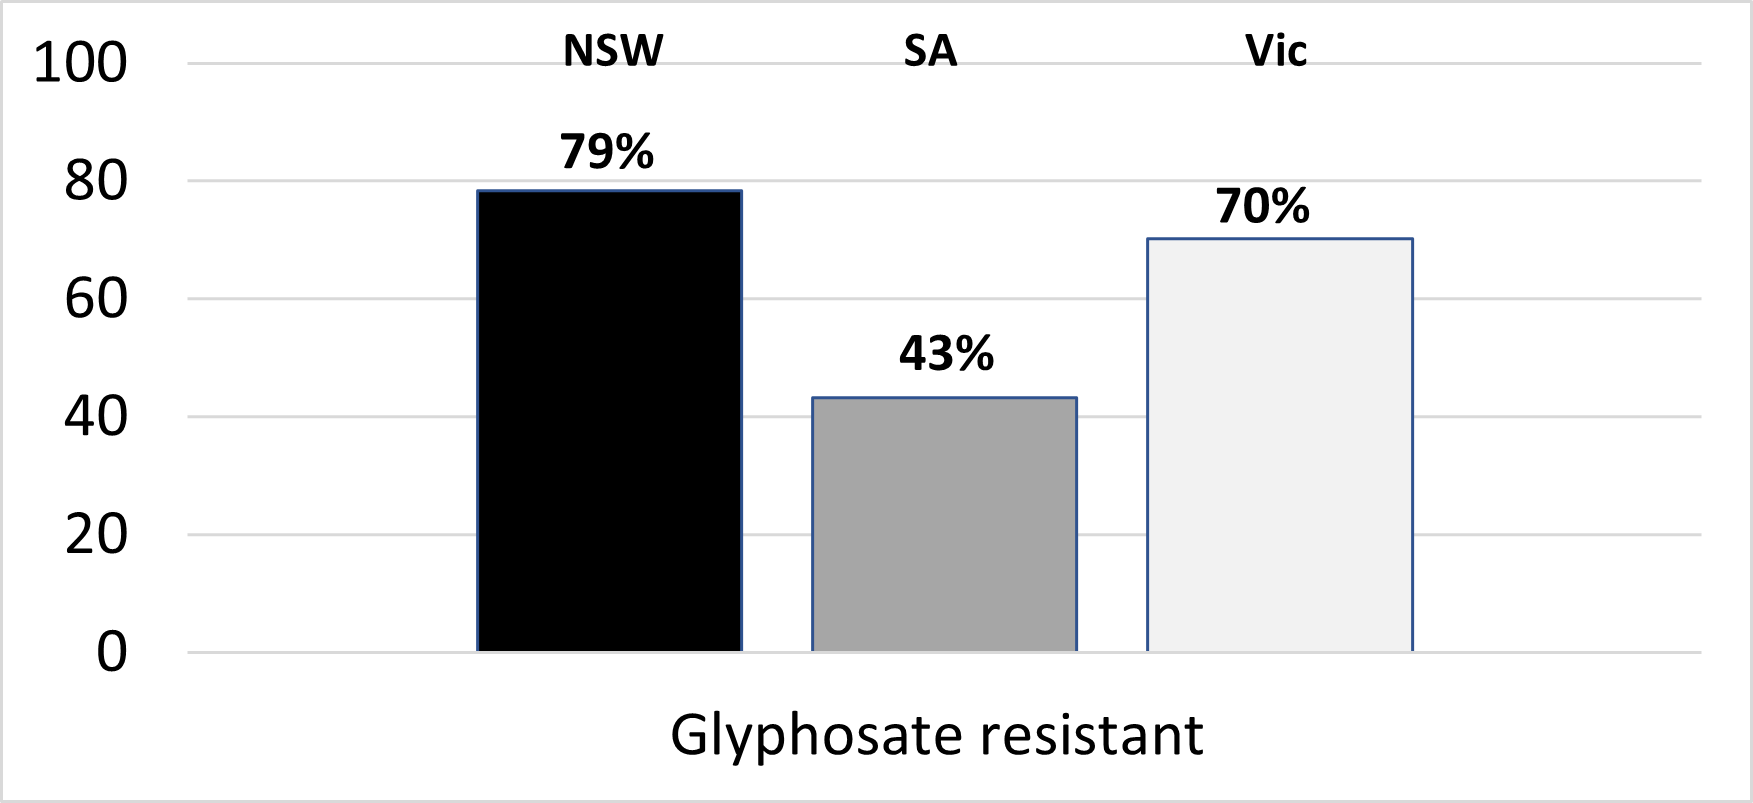 Figure 5. Percent (%) resistance to glyphosate confirmed in farmer ryegrass samples originating from 83 NSW, 37 SA and 74 Vic cropping paddocks treated with glyphosate in autumn 2020. Testing conducted by Plant Science Consulting using the Quick-Test.
Discrepancy between resistance testing and paddock failures to glyphosate
In some cases, plants that survived glyphosate in the paddock are not resistant. Reasons for the discrepancy between the paddock and a resistance test can include poor application or application onto stressed plants, incorrect timing, sampling plants that were not exposed to glyphosate, antagonistic tank mixes, inferior glyphosate formulation, poor water quality, incorrect adjuvants, or a combination of the above.
Evolution of glyphosate resistance
Glyphosate was first registered in the 1970s and rapidly became the benchmark herbicide for non-selective weed control. Resistance was not detected until 1996 in annual ryegrass in an orchard in southern NSW (Powles et. al. 1998). Only a few cases of resistance were detected in the following decade (refer to Bayer Resistance Tracker). The fact that it required decades of repeated use before resistance was confirmed indicated that the natural frequency of glyphosate resistance was extremely low.
There are several contributing factors for the increasing resistance in ryegrass to glyphosate with generally more than one factor responsible. Reducing rates can increase the development of resistance particularly in an obligate outcrossing species such as ryegrass, resulting in the accumulation of weak resistance mechanisms to generate individuals capable of surviving higher rates. This has been confirmed by Dr Chris Preston where ryegrass hybrids possessing multiple resistance mechanisms were generated by crossing parent plants with different resistance mechanisms. Other factors that can select for glyphosate resistance by reducing efficacy include:
- Using low quality glyphosate products and surfactants
- Mixing glyphosate with too many other active ingredients resulting in antagonism, particularly in low water volumes
- Using low quality water, particularly hard water. Glyphosate is a weak acid and binds to positive cations (i.e. magnesium, calcium and bicarbonate) that are in high concentration in hard water (i.e. >200 ppm)
- Applying glyphosate during periods of high temperature and low humidity, resulting in the rapid loss of glyphosate from solution on leaf surfaces thereby reducing absorption
- Translocation of glyphosate in stressed plants can be reduced. Optimising glyphosate performance requires the translocation to the root and shoot tips. While this can occur readily in small seedlings, in larger plants, glyphosate is required to translocate further to the root and shoot tips to maximise control
- Shading effects reducing leaf coverage resulting in sub-lethal effects
- Applying glyphosate onto plants covered with dust can result in reduced available product for absorption as glyphosate strongly binds to soil particles
- Application factors such as speed and nozzle selection, boom height can reduce the amount of glyphosate coverage
- A combination of the above factors can reduce control and increase selection for resistance.
Optimising glyphosate performance
The selection of glyphosate resistance can be minimised by considering the points above. A number of important pathways to improve glyphosate performance include:
Avoid applying glyphosate under hot conditions
A trial spraying ryegrass during the end of a hot period and a following cool change was conducted in October 2019. Ryegrass growing in pots were sprayed at 8am, 1pm and 8pm with temperature and Delta T recorded prior to each application. Control of well hydrated plants ranged between 0% and 40% when glyphosate was applied during hot weather (30 to 32.5°C) and high Delta T (14 to 16.7) with the lowest control when glyphosate was applied at midday (Figure 6). In contrast, glyphosate applied under cool conditions just after a hot spell resulted in significantly greater control (65%-80%), indicating that plants can rapidly recover from temperature stress provided moisture is not limiting.
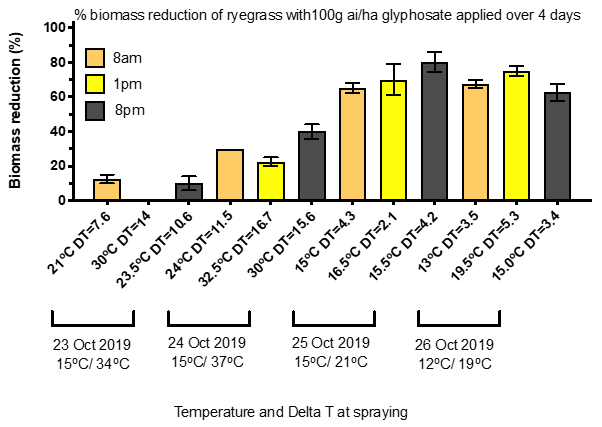
Figure 6. Effect of temperature & Delta T on glyphosate for ryegrass control
Improving water quality and glyphosate activity by using ammonium sulfate (AMS)
The addition of AMS has several functions. One is to soften water by combining to positively charged ions such as magnesium and calcium common in hard water. The negative charged sulfate ions combine with the positive cations preventing them from interacting with glyphosate and reducing glyphosate solubility and leaf penetration. Additionally, AMS has been shown to independently improve glyphosate performance, as the ammonium ions can work with glyphosate to assist cell entry, increasing uptake and activity. In a pot trial conducted with soft water, ammonium sulfate was shown to significantly improve control of ryegrass with 222mL/ha (100g ai/ha) of glyphosate 450 (Figure 7). As a general rule, growers using rainwater (soft) should consider 1% AMS, if using hardwater (i.e. bore, dam) 2% AMS is recommended. The addition of a wetter resulted in a further improvement of herbicide efficacy.
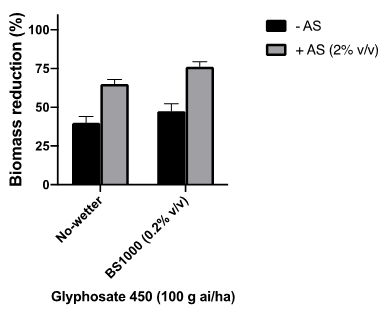
Figure 7. Effect of ammonium sulfate and wetter on glyphosate for ryegrass control.
(A sub lethal rate was used to differentiate between treatment differences. Plants were grown and sprayed under optimum conditions).
Herbicide activity can vary at different growth stages
In a pot trial investigating the effect of glyphosate at 4 ryegrass growth stages (1-leaf to 4-tiller), good control was achieved at the 3 older growth stages but not on small 1-leaf ryegrass (Figure 8). Most glyphosate labels do not recommend application of glyphosate on 1-leaf ryegrass seedlings. Very small seedlings (i.e. 1-leaf) are still growing on seed reserves and have not yet commenced sugar production via photosynthesis. As a consequence, little glyphosate is translocated downwards with the sugars to the growing point (meristem) of shoots and roots, thus reducing efficacy.
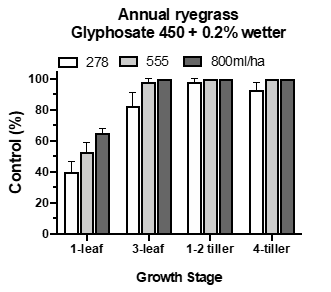
Figure 8. Effect of ryegrass growth stage on glyphosate activity
Double knock
A double knock strategy is defined as the sequential application of two weed control tactics directed at the same weed cohort (germination). The most common double knock strategy is glyphosate followed by paraquat. This has been widely adopted to prevent or combat glyphosate resistance in several weed species, including ryegrass. The first ‘knock’ with glyphosate controls the majority of the population, with the second ‘knock’ (paraquat) intended to kill any individuals that have survived glyphosate. Trial work conducted by Dr Christopher Preston (Figure 9) showed that control was optimised when the paraquat was applied 1-5 days after the glyphosate for two glyphosate resistant ryegrass populations. However optimal timing depends on weed size and growing conditions, with at least 3-5 days often being required for full glyphosate uptake and translocation, especially in larger plants. In this study, when the glyphosate resistant plants were left for 7 days before the paraquat application they can stress, resulting in the absorption of less paraquat, reducing control with the second tactic. If growing conditions are poor or plants large, the stress imposed by glyphosate maybe further delayed.
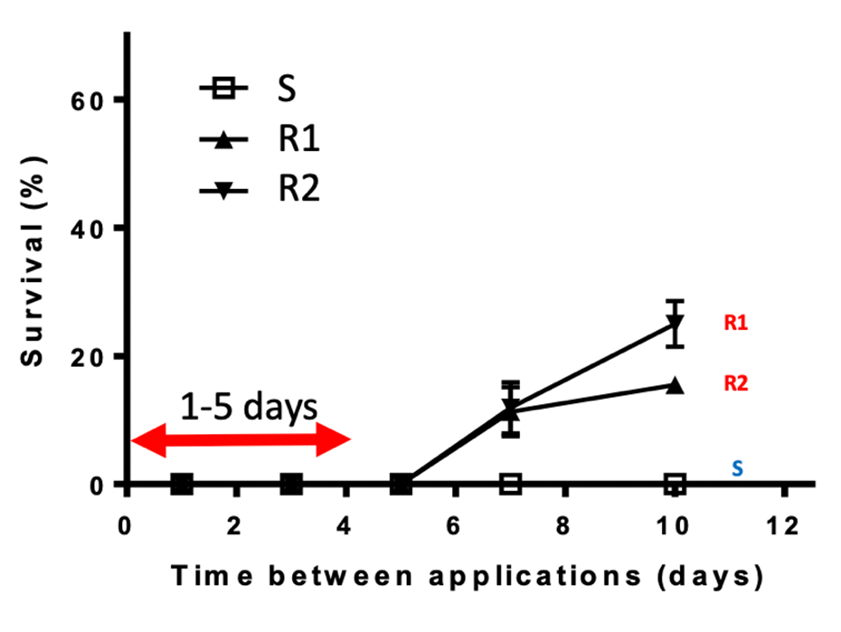
Figure 9. Double knock timing. Glyphosate applied onto a susceptible (S) and two glyphosate resistant ryegrass biotypes (R1 & R2) followed by paraquat 1, 3, 5, 7 and 10 DAA. Trial work conducted by Dr Christopher Preston (The University of Adelaide).
Summary
Ryegrass blowouts in 2020 were a result of large seedbanks, reduced weed control tactics and herbicide resistance. Using multiple tactics including new mode of action herbicides can improve ryegrass control. While paraquat resistance remains very low, glyphosate resistance in ryegrass is increasing at a rapid rate. The early break in autumn 2020 resulted in the testing of about 200 ryegrass populations prior to sowing with over half confirmed resistant to glyphosate. Decades of strong selection pressure resulting from repeated use coupled with application under suboptimum conditions has played a major role. More efficient use of glyphosate combined with effective IWM strategies is required to reduce further increases in resistance.
Acknowledgements
The information for the random weed surveys was undertaken as part of GRDC projects UCS00020 and UCS00024.
References
Powles SB, Lorraine-Colwill DF, Dellow JJ, Preston C. (1998). Evolved resistance to glyphosate in rigid ryegrass (Lolium rigidum) in Australia. Weed Science. 46:604–607
Yu Q, Cairns A, Powles S. (2004). Paraquat resistance in a population of Lolium rigidum. Functional Plant Biology. 31:247–254
Contact details
Peter Boutsalis
Plant Science Consulting P/L
University of Adelaide, Waite Campus, Glen Osmond SA 5064
Herbicide resistance website: www.plantscienceconsulting.com.au
@PBoutsalis
Email: peter.boutsalis@adelaide.edu.au
John Broster
Charles Sturt University, Wagga Wagga, NSW 2678
Email: jbroster@csu.edu.au
@JohnCBroster
® Registered trademark
GRDC Project Code: UCS00020,
Was this page helpful?
YOUR FEEDBACK
