Forewarned is forearmed – can we have better conversations with farmers about climate risk?
Author: Peter Hayman (SARDI Climate Applications) and Barry Mudge (Mudge Consulting) | Date: 25 Feb 2021
Take home messages
- Climate variability represents an important risk for farmers and advisers in central west NSW. The Bureau of Meteorology is issuing more forecasts (weeks, fortnights, months and seasons) which are updated more often. GRDC is partnering with other RDCs to invest in a project to provide more access to forecasts of weather and climate extremes for the grains industry
- Seasonal climate forecasts (SCF) are skilful (better than guessing) and likely to slowly improve. Nevertheless, they are unlikely to approach the remarkable accuracy of short-term weather forecasts and so are best represented as a change in the odds for wetter or drier than a categorical statement that it will be dry or wet. Communicating and using probabilistic forecasts in decision making is challenging. As a general rule, forecasts are right about twice as often as they are wrong and even with a 75% - 80% chance of above median rainfall there is still a minority chance of below average rainfall that can’t be ignored
- Forecasts are expressed as probabilities and this is a challenge for communication. One path forward is to use what we are calling Rapid Climate Decision Analysis. This is based on budgeting across deciles. Although this approach is important for incorporating probabilistic seasonal forecasts, we have found that the graphical representation of risk and reward leads to useful conversations about climate risk in the absence of seasonal forecasts.
1. Viable grain enterprises have skills in balancing caution and opportunity in a variable climate
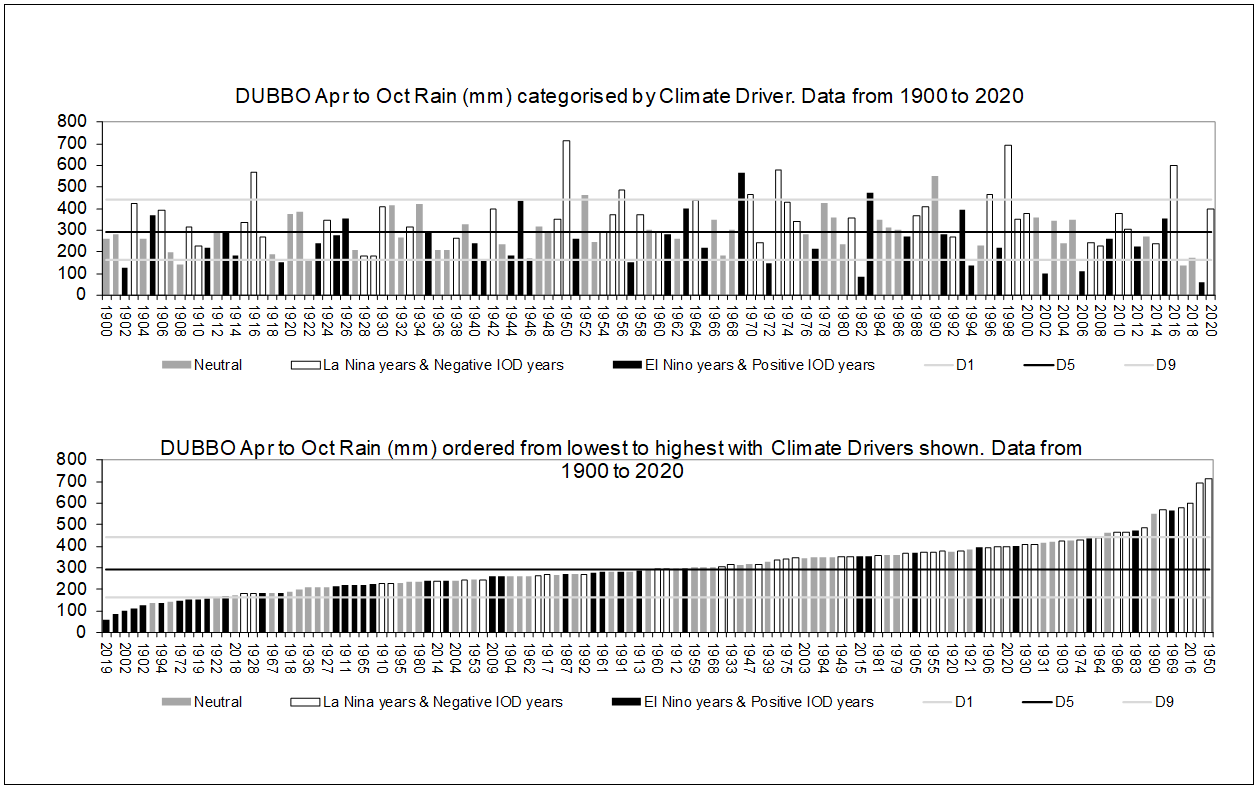
Compared to most of their international competitors, Australian grain growers face a high level of year to year variability in climate with low level of government support. Although every region can point to unique challenges, growers in the central west of NSW deal with a higher degree of variability than southern and western grains regions (variability decreases clockwise around the grains belt). Although the variability is less than in the northern regions, the limited summer cropping in the central west leads to the reliance on a single growing season and hence high variability of annual income from cropping. The high degree of variability in growing season rainfall for Dubbo is shown in Figure 1. Although the decile 5 rainfall is about 300mm, some seasons are as low as 100mm and others over 500mm. Recent experience of three consecutive poor seasons from 2017 to 2019 show the direct cost of climate variability (more detail see archives here). Beyond this direct cost to grain enterprises, the uncertainty of climate variability makes decision making more difficult due to a ‘moving target problem”‘ for inputs and a shift to more cautious lower inputs.
The GRDC RD&E plan 2018-23 observes the balancing act required when dealing with risk: “Risk management practices that are overly conservative can limit profit in above‑average production years, while approaches that are overly aggressive can expose growers to large losses that in turn could contribute to business equity issues that ultimately impact profit and future operations.” Grain enterprises that are viable after riding the variability shown in Figure 1 are clearly skilled at balancing caution and opportunity. The question raised in this short paper is whether there are ways that we can build on this local knowledge and wisdom and make the best use of information on variability from climate science. But first we need to make the point that climate science has something to offer grain growers in the central west.
2. Growing season rainfall in the central west is influenced by El Nino Southern Oscillation and the Indian Ocean
El Nino Southern Oscillation (ENSO) and the Indian Ocean Dipole (IOD) explain some (by no means all) of the variability in April to October rainfall in the central west. In recent experience the dry spring in 2015 was an El Nino year, the very wet 2016 was consistent with a negative IOD and the dry 2019 linked to a positive IOD with the above average 2020 by a late developing La Nina. The very dry 2017 and 2018 were neutral years and highlight that there can be extremely poor years not explained by climate drivers. Regions that have an impact from ENSO and IOD tend to have higher variability, but as some compensation they also have higher predictability.

The same data as Figure 1 can be presented in horizontal bars (Figure 2). Across all years there is an equal chance of decile 1 to decile 10. By definition, the chance of being in the driest 2 deciles is 20%. In El Nino or positive IOD years, the odds of a decile 2 outcome double to 40% or higher. In La Nina years the odds of being in the lowest two deciles reduce to less than 10% and in the 19 negative IOD years there have been no years as dry as the lowest 2 deciles. There is a similar pattern of an increase in the chance of the wetter deciles in La Nina and negative IOD years and decrease in El Nino and positive IOD years.

3. Forewarned is forearmed – GRDC combining with other RDCs and the Australian government in an R&D for Profit project
The last decade has seen an enormous national and international effort to better understand the climate. In Australia this has entailed a substantial investment in super-computing for the Bureau of Meteorology. As the supply of climate information is expanding, so is the demand. Grain growers want the expensive super-computer time and the limited resource of climate scientists to address issues that impact their industry. But increased demand is also coming from other rural industries and other sectors such as energy, water resources, military, health and emergency management.
Although the grains industry may be asking different questions than sectors such as health and the military, many of the questions overlap with other rural industries. For example, what’s the chance of next week or next month being extremely wet (decile 9 & 10)? What’s the chance of having a hot (decile 9 & 10) week in three or four weeks’ time or a very hot month, next month, or the month after? What’s the chance of having a very dry (decile 1 & 2) month, next month, or the month after?
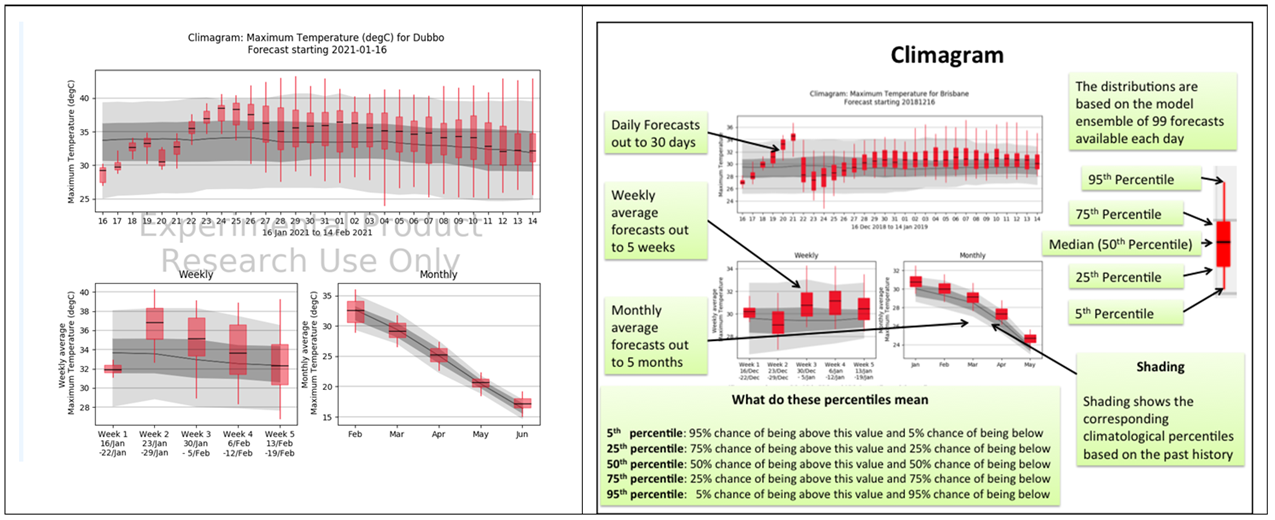
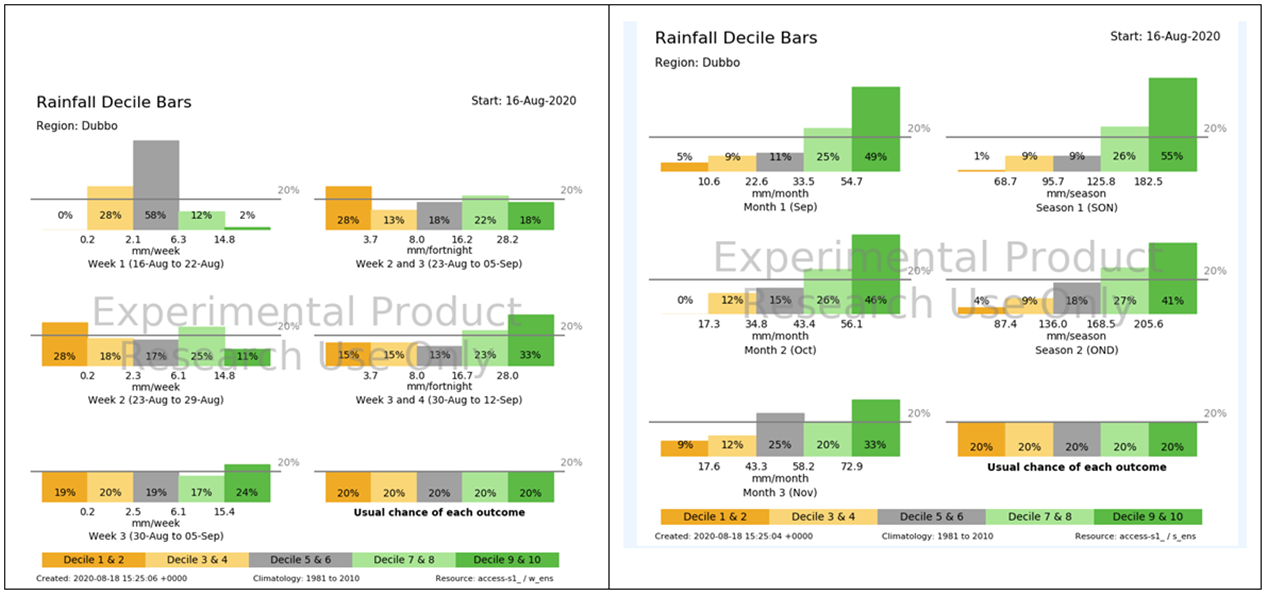
These questions are being addressed in a project where Bureau of Meteorology climate scientists are guided by six reference groups; grains, northern beef, southern beef, sugar, dairy and wine grapes. The project Forewarned is Forearmed (FWFA): equipping farmers and agricultural value chains to proactively manage the impacts of extreme climate events, runs from 2017-2022 and will provide five new forecast products for extreme events, weeks to months ahead. Funding partners include the Australian Government Department of Agriculture and Water Resources as part of its Rural Research and Development (R&D) for Profit Program ($6m), with further cash and in-kind contributions ($8m) from 14 project partners. Figures 3 and 4 show some of the experimental output. One of the roles of the grains industry reference group is to aid in selecting forecast products that will become operational. An important point is that these products show the full distribution of outcomes rather than just the percent chance of exceeding the median. The forecast distribution is generated by 99 runs of the model which considers the uncertainty in starting conditions and internal variability from the model.


In Figure 4, the forecast for October, made on 16 August should be interpreted as; of the 99 model runs, 46% fell into decile 9 & 10, and 26% in deciles 7 & 8. This can be reported as 80% chance of exceeding the median, but the extra information shows the greatly increased chance of deciles 9 and 10 and that of the 20% of model runs that are drier than the median, they are all above decile 3.
There will be ongoing improvements in seasonal forecasts and in the ways that they are communicated. They will still fall into the category of ‘too good to ignore but not good enough to be sure’ and they will be best represented as probabilities. Probabilities have long been a barrier to the use of seasonal forecasts. In one of the early reports on farmer use of seasonal climate forecasts in Australia, Ridge and Wylie (1996) noted “Much climate information is put out in the form of probabilities, which most farmers are not responsive to. Farmers have said that they want to know whether it is likely to be wet, dry or average, not whether there is a 60% chance of getting 40% of average rainfall”.
Farmers have a deep sense of living with risk and uncertainty and trade-offs between too cautious and too optimistic. It might be that they are unused to hearing about uncertainty from science. There is a suspicion amongst some farmers and advisers that the use of probabilities displays a lack of conviction on behalf of the forecaster, a form of vagueness or mumbling to cover all outcomes and avoid being wrong. Private forecasters who provide emphatic statements are admired as being straight talking. On hearing a talk on El Nino and probabilities an agronomist made the comment “nice talk on probabilities, but in the real world people have to make decisions”. This overlooks the “real world” use of probabilities in almost all of modern life including aviation safety, health, google searches and artificial intelligence. Most of us who studied agricultural science learn about probability and p values, but it might be that the extremely high confidence level used for agricultural chemicals means that we can be assured the herbicide at label rate will work and so we don’t need to practice probabilistic thinking.
Probability theory is a wonderful invention to deal with partial information and risk. The mathematician Jordan Ellennberg points out that probability theory developed surprisingly late in the history of mathematics (mid-17th Century) compared to older subjects such as geometry. Building the pyramids required geometry and understanding of levers, but not probability. Probability theory was developed to solve the seemingly trivial problem of an interrupted gamble. Say we are playing a simple game where we each put $50 on the table and agree the winner will be decided by five tosses of a fair coin. Three or more heads and I take the $100, two or less and my opponent is richer. The game is interrupted after three throws when the score is 1 head (H) and 2 tails (T). The question is whether we can split the $100. It is obvious from probability theory that the player assigned tails should take $75 because there are four possible futures, three of them favouring tails (HT, TT, TH) and the player assigned heads should take $25 representing the 1 in 4 chance of the next two throws being heads. Ellenberg argues that prior to the invention of probability theory, this problem was seen as unresolvable because the next two throws were unknown, or known only to God. The radical idea was that there is an answer and we can show the working. Bernstein (1996) in a history of risk as an idea stated “The revolutionary idea that defines the boundary between modern times and the past is the mastery of risk… Until human beings discovered a way across that boundary, the future was a mirror of the past or the murky domain of oracles and soothsayers who held a monopoly over knowledge of anticipated events.”
In many ways we are fortunate to have climate science express their confidence as probabilities as this provides the full information and indicates the relative confidence in the forecast. Not only is this a case of climate science being honest and credible, it improves the decisions based on the forecast.
4. Rapid Climate Decision Analysis
We developed an Excel based framework called Rapid Climate Decision Analysis to compare the outcomes across deciles of growing season rainfall of a higher risk and return choice (e.g. a higher N rate or a pulse crop) with a more conservative lower risk and return choice (lower N or a cereal). Examples will be provided in the presentation. The key feature is that rather than budgeting for a single outcome (often decile 5) users are stepped through a process to provide information for three to five season types and presented with an interpolated graph that covers outcomes across all deciles. The representation of adviser’s knowledge as budgeting by deciles provides a rich source of information on climate risk. The mental switch is to compare the profit of two decisions across states of climate (in this case deciles of growing season rainfall) with careful attention to where the lines cross over (if at all) and the relative size of the downside risk and the upside missed opportunity. A common request is for climate science to indicate which decile is most likely, but a better representation of the forecast is a shift in the likelihood of different deciles. If a seasonal climate forecast is represented as a revised climatology, this revision can be superimposed on the decile by profit graph which allows a new comparison of the two options.
Frameworks such as Rapid Climate Decision Analysis are not designed for routine decision making. The more modest role is as a tool to think, discuss, confirm or start arguments about rules of thumb on climate risk in the grains industry. We subtitled the framework ‘fast graphs for slow thinking’ as a reference to Khaneman (2011). The graphs can be generated relatively quickly because grain growers and agronomists have a deep understanding of production risk and how this production changes across deciles of growing season rainfall. There is a cost in time and effort of slowing down to put numbers on a page (or spreadsheet). This is only worthwhile where the outcomes matter. On a grain farm, there should be at least tens of thousands of dollars at stake.
As the psychologist Paul Slovic says, “our emotions are not good at arithmetic, we tend to think of future events as 100% or 0%”. This can translate into hearing about an El Nino outlook and planning for a dry outcome or dismissing the prediction because it isn’t certain or because it has rained in past El Nino events. The correct revision of deciles is straightforward in a spreadsheet and agronomists easily recognise patterns of shifts in graphs, especially if they were involved in providing the underlying information.
We ran a workshop with 20 agronomists – some of the comments on the strengths of Rapid Climate Decision Analysis were as follows:
- “Getting numbers down on paper and being able to test the sensitivity of a decision to a change in climate forecast. Fairly easy to use and interpret”
- “Putting numbers around some gut feelings helping to make decisions”
- “To be able to clearly visualise the risk profile of a climate sensitive decision. It makes us think through the financial aspects of a decision, and how the future climate (i.e. rainfall deciles) will impact the outcome”
- “Excellent tool to help explain the probabilities given a set of indicators”
- “Good visual data and rigor around decision based on a range of potential climate outcomes”
- “Assists in helping make a final decision or to confirm what you thought in the field”
- “Good for showing differences and putting numbers to those decisions.”
Some of the limits related to the difficulties of using it in the field, included the ‘clunky’ spreadsheet, how to include other factors, the lack of confidence in seasonal forecasts, having enough empirical data, the challenge of dealing with complex decisions. As one agronomist put it “It’s a good back up, but for me there are so many other factors to consider and as an established agronomist I don’t think I’d use this tool as generally everything in the paddock tells me the answers.”
There are opportunities for advisers in the central west to access the experimental products from the Bureau of Meteorology - please contact Peter.Hayman@sa.gov.au.
References
Bernstein, P.L. 1996. Against the gods: The remarkable story of risk. New York: Wiley.
Kahneman, D, and Egan, P. (2011). Thinking, fast and slow. New York: Farrar, Straus and Giroux
Acknowledgements
The research undertaken as part of this project is made possible by the significant contributions of growers through both trial cooperation and the support of the GRDC, the author would like to thank them for their continued support. The work on Rapid Climate Decision Analysis has been conducted with Professor Kevin Parton, Charles Sturt University. Ideas for RCDA have come from projects funded by GRDC, Wine Australia, ACIAR, The Australian Government through Rural R&D for Profit, and SARDI/PIRSA. We appreciate the input of 20 agronomists from the southern region in 2018 and a further 20 in 2020.
Contact details
Dr Peter Hayman
SARDI Climate Applications
Waite Research Precinct, Adelaide
Email: Peter.Hayman@sa.gov.au
GRDC Project Code: DAV1803-010SAX,
Was this page helpful?
YOUR FEEDBACK
