In the wake of the China barley tariffs
In the wake of the China barley tariffs
Author: Pat O'Shannassy (Grain Trade Australia) | Date: 24 Feb 2021
Take home messages
- China’s 80% tariffs on Australian barley exports stops an annual trade flow worth $A1.2 billion.
- Prior to the tariffs, China was Australia’s largest destination market for barley exports accounting for around 58% of Australian barley exports.
- Estimated cost to industry is $2.5 billion over the initial five-year period of the tariffs.
- The Australian Government has notified China it will be seeking to resolve the trade dispute through the formal dispute resolution processes of the World Trade Organisation (WTO).
- There has been significant work to build demand for lost barley exports, including focus on farm returns, other grains and modernising the grain supply chain.
- In developing policy to improve the position of the Australian agricultural industry, trade is just one, albeit important, policy consideration. Other factors, such as the supply chain, should also be considered in order to improve competitiveness and extract economic value.
Grain Trade Australia (GTA)
Grain Trade Australia (GTA) is a national association and is the focal point for the commercial grains industry within Australia. Grain Trade Australia provides an industry driven self-regulatory framework across the grains industry to facilitate and promote the trade of grain. This framework consists of Trading Standards, Standard Form Contracts, Trade Rules, Arbitration and Dispute Resolution, Professional Development and international and domestic advocacy for Market Access.
Grain Trade Australia members are responsible for over 95% of all grain storage and freight movements made each year in Australia. The overwhelming majority of grain contracts executed in Australia each year refer to GTA Grain Trading Standards and/or Trade Rules.
Grain Trade Australia provides industry stewardship through its specialist industry codes, including:
- Australian Grains Industry Code of Practice,
- Grain Transport Code of Practice, and
- Technical Guideline Documents.
These codes outline the base practices expected in the Australian grains industry supply chain and are critical to ensuring confidence of governments, regulators and consumers of the quality assurance systems and processes in place in the supply chain. The Australian Grains Industry Code of Practice is critical for our grain exports and is endorsed by the Australian Government Department of Agriculture. Australia is the only major grain exporting country that has an industry Code of Practice.
Grain Trade Australia members are drawn from all sectors of the grain value chain from production to domestic end users and exporters. Grain Trade Australia has over 270 organisations as members. Their businesses range from regional family businesses to large national and international trading/storage and handling companies who are involved in grain trading activities, grain storage, processing grain for human consumption and stock feed milling.
Australian barley production
Australian grain is produced in a belt along the east coast of Australia (including the states of Queensland (Qld), New South Wales (NSW) and Victoria (Vic)), South Australia (SA) and Western Australia (WA). The Australian grain market tends to operate in three distinct regions, with additional variances dependent on the Port Zone within each region. Domestic consumption for grain is concentrated on the East Coast states. Exporting is the dominant market pathway in SA and WA, as they account for around 50-60% of barley production. This means the major states for exports of both feed and malting quality barley to China are SA and WA.
F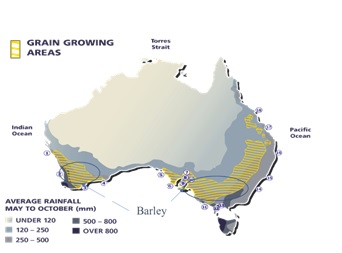
Figure 1. Australian barley production regions. (Source: AEGIC)
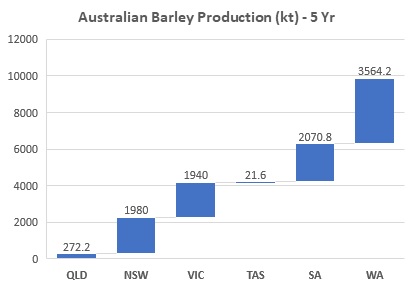
Figure 2. Australian barley production by state. (Source: ABARES).
Australia’s position in the global barley market
Australia is a small global producer. As a net exporter and consequently a price taker, Australian barley prices are dominated by global markets, which have a high level of competition from other major exporters including the countries listed in Figure 4.
The five-year average global production of barley is around 144 million metric tonnes (mmt). Europe Union (EU) is the largest producer with around 60mmt, with Australia on average being the third largest producer of barley at around 9.5mmt. Global exports of barley are around 28.7mmt with Australia being the second largest global exporter of barley with around 6.2mmt behind the EU with 7.4mmt.
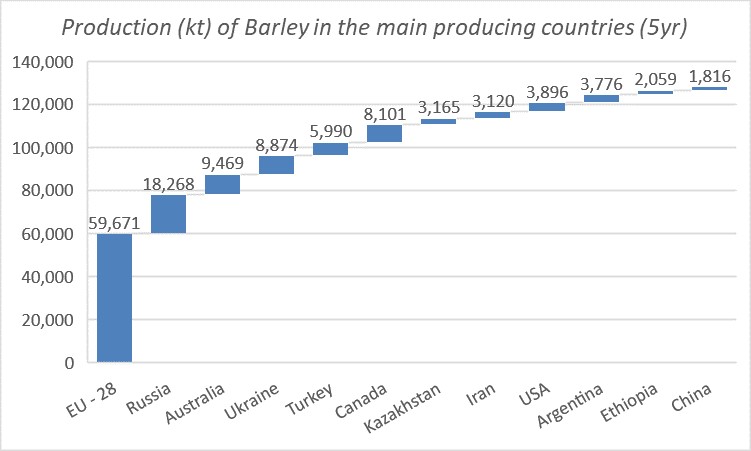
Figure 3. Global production of barley. (Source: USDA).
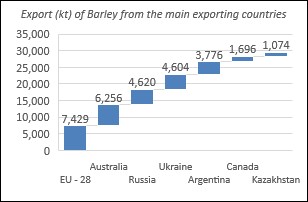
Figure 4. Global exports of barley. (Source: USDA)
Around 70% of Australian barley production is exported, and the remainder is consumed domestically mainly for malting and animal feed purposes. The five-year average of Australia’s barley exports to China is around 3.8mmt of which 1.7mmt is of malting quality and around 2.1mmt of feed quality. Other important export markets for Australian barley include Saudi Arabia, Japan and United Arab Emirates (UAE). The product specifications for each of these markets can vary.
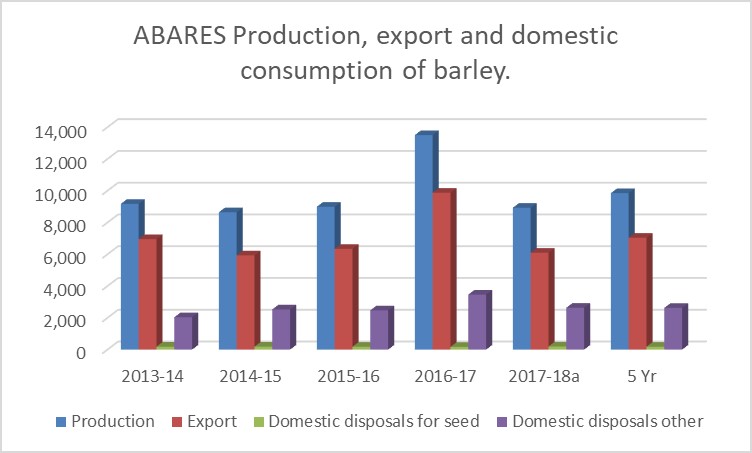
Figure 5. Australian supply and demand for barley. (Source: ABARES).
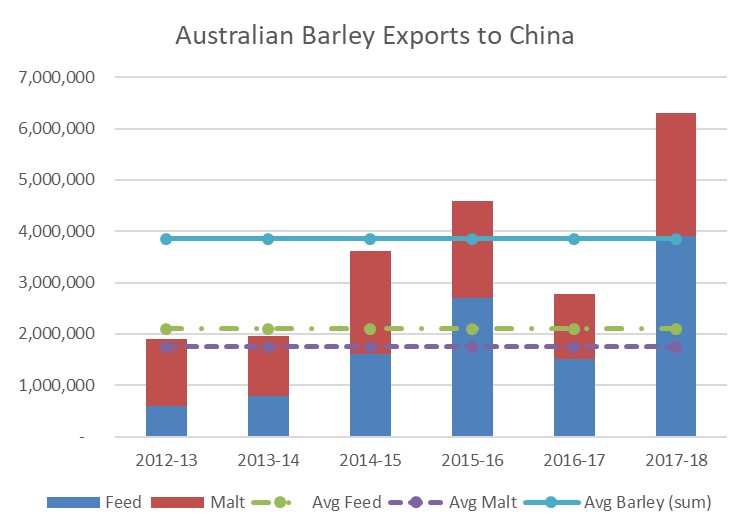
Figure 6. Australian barley exports to China. (Source: ABS)
Background to the issue and impact
On 19 May 2020, the Chinese government imposed anti-dumping (AD) duties of 73.6% and countervailing duties (CVD) of 6.9% on all barley imports originating in Australia for five years.
Australian grain industry organisations, exporters and Australian Government made substantial submissions to demonstrate the findings of the AD and CVD cases had no basis in fact.
The cost to Australian barley industry and producers is significant, estimated to be at least $2.5 billion over the initial five-year period of the tariffs (i.e., $500m per annum). This will have an impact on rural and regional communities.
Australian grain exports to China have grown since 2011-12, largely due to growth in barley exports, with a peak of around $A2.5 billion (free on board (FOB) of exports in 2014-15 and a five-year average of $A1.9 billion (FOB). The five-year average for exports is approximately 4.9mmt, of which around 65% is barley, 23% wheat, 7% sorghum and 5% canola. China’s portion of Australian grain exports has grown to around 20-25% of all grain exports, however this is expected to decline by around 7% of all Australian exports (a five-year average of around $A1.4 billion per annum), due to the trade inhibiting tariffs on Australian barley exports.
With no barley exports, analysis of historic shipments suggests that wheat will be the dominant commodity exported to China of around 1.4mmt per annum, which will comprise around 67% of the significantly reduced Australian grain exports to China. Australia has a long and established milling wheat trade with China.
In December 2020, the Australian Government advised China it would be seeking to address the dispute through the WTO trade dispute resolution process. While this process can take considerable time, it does require the parties to engage formally in dispute resolution process, which may be constructive in the current political climate and the challenged state of the Australia/China bi-lateral relationship. The objective from an industry perspective is to ‘remove politics from the trade’.
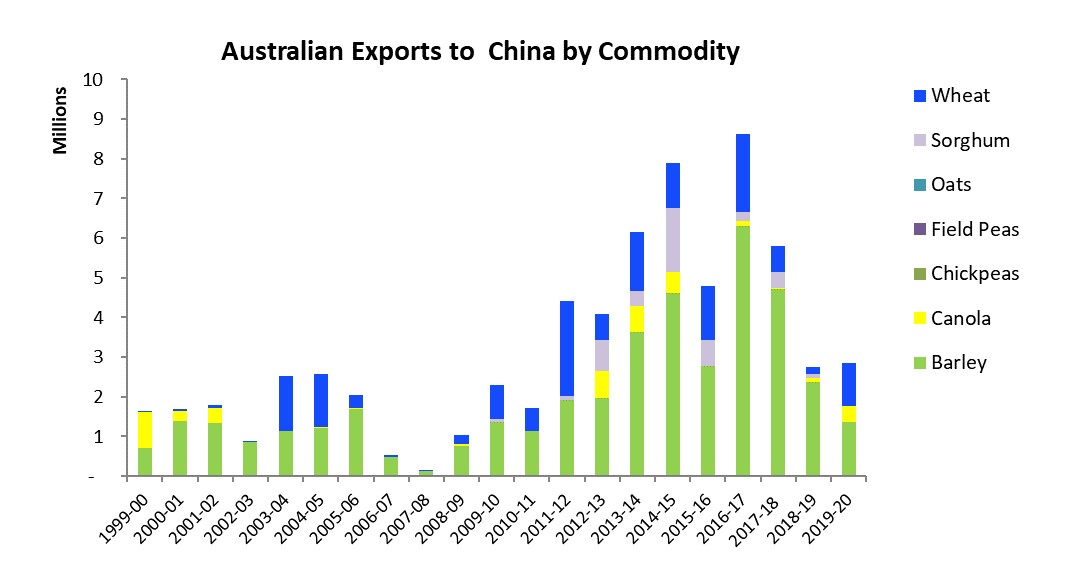
Figure 7. Australian grain exports to China. (Source: ABARES & ABS).
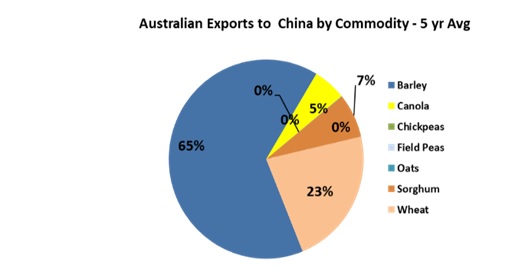
Figure 8. Commodity share of exports to China. (Source: ABARES & ABS).
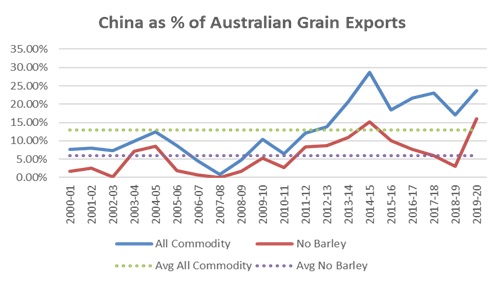
Figure 9. Percent of Australian grain exports to China. (Source: ABARES & ABS).
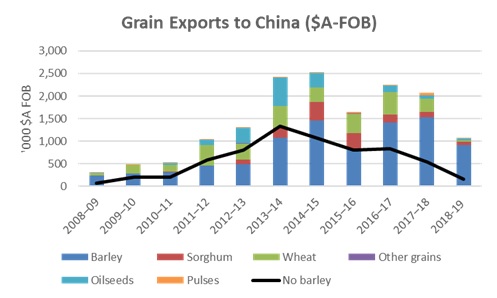
Figure 10. Grain exports to China ($A FOB). (Source: ABARES & ABS).
Building demand and market priorities
There is no ‘silver bullet’ solution to replace the lost barley demand from China. The China barley market was based on the development of strong customer relationships, specific varieties marketed for certain products and the premium prices paid by customers. This trade was entirely rational based on strong customer relationships, product marketing and value driven price premiums. Alternative markets will have their own trade/technical barriers and price challenges to overcome. To restore industry value, development work needs to look at some of the following factors (amongst others):
- Current barley markets.
- Domestic market.
- New market opportunities.
- Alternative crop opportunities.
- Technical services.
- Improving value chain efficiency.
- Technical market access.
- Tariffs.
- Non-tariff trade measures (NTMs).
This work includes focus on ‘value levers’ including research, development, extension, technical services, market access, collaborative engagement and policy development.
Demand opportunities
Figure 11 to 14 show major export destination markets, totalling the last five years, for Australian grain, noting the domestic market is the largest consumptive market for Australian grain. The graphs capture the potential markets where an expansion of volume could be a key priority. However, it should also be acknowledged that they do not necessarily present highest value or all potential growth opportunities (for example India is noted as a potential growth opportunity for barley; while Bangladesh and Myanmar are noted growth market opportunities for wheat).
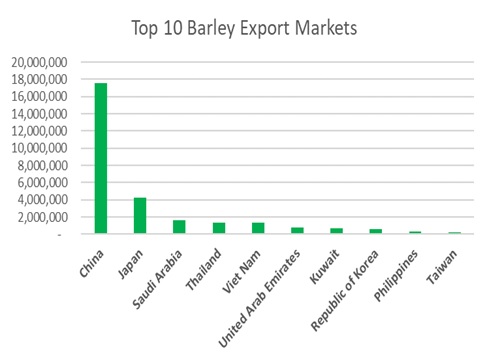
Figure 11. Top 10 barley export markets. (Source: ABS).
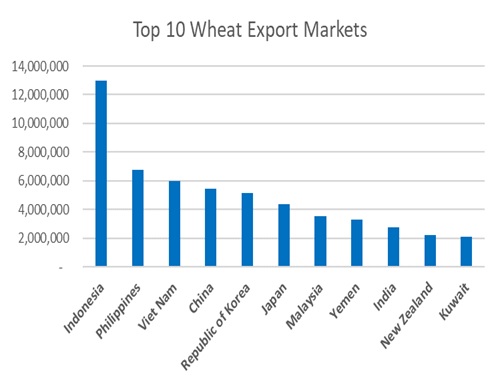
Figure 12. Top 10 wheat export markets (Source: ABS).
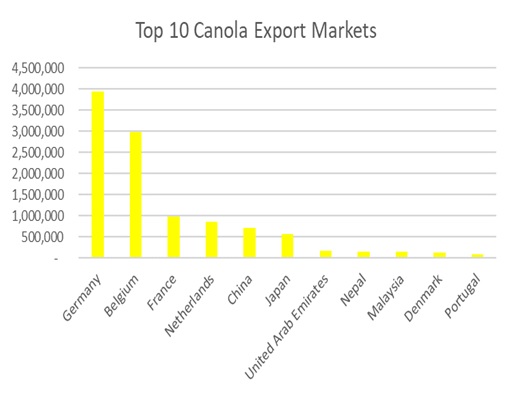
Figure 13. Top 10 canola export markets (Source: ABS).
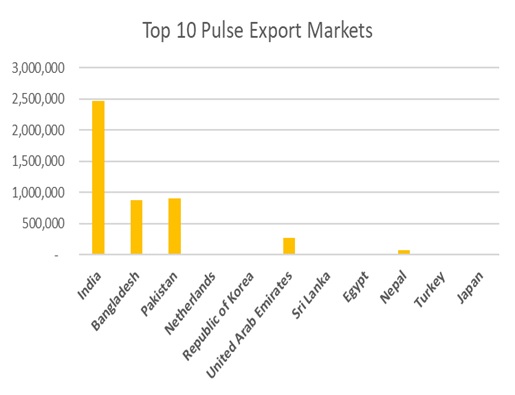
Figure 14. Top 10 pulse export markets (Source: ABS).
Demand growth
There is a substantial growth opportunity for Australian grains in South-East Asia ((SEA) Indonesia, Thailand, Philippines, Vietnam, Singapore), in both human consumption and feed markets, as population and economic growth drive increased demand for animal protein and wheat-based food products. Figure 15 shows the substantial increase in imports and consumption for wheat and corn in SEA.
Market access to many of these countries is restricted through tariff measures, import bans and also NTMs that are designed to protect domestic corn producers in each country.
While there may be short term demand challenges related to COVID-19, Australia needs to commence the longer-term process to break down these trade barriers and develop a story that Australian grain can complement and assist in the development of the local supply of feed grains and animal protein (rather than compete with local producers). A small part of these markets will be a significant market opportunity for the Australian grain industry. Similarly, improved market access and government tariff and NTM intervention in India offers opportunity to participate in India’s growing demand and food supply surety policies.
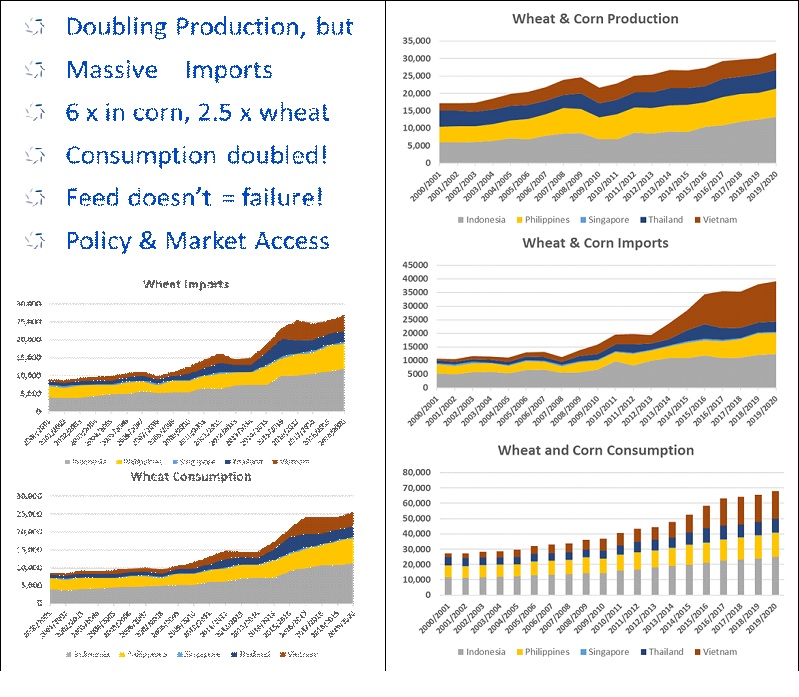
Figure 15. South East Asian demand. (Source: USDA).
Supply chain investment for competitiveness and growth
In addition to market access and efficient trade, the future success of Australia’s grain industry is dependent on a competitive and efficient supply chain.
Around 30-35% of a grower’s total cost is associated to supply chain costs. Global competition is intensifying. The quality advantage for Australian grain is reducing as processers and consumers increase their efficiency and utilisation of grain from alternative and cheaper origins and utilise technology to enable flexibility and use of different quality raw materials. This is applying pressure on Australian margins, and costs at both farm and supply chain level. Australia must compete and develop competitive advantage on both the grain quality and the supply chain fronts.
Improving supply chain efficiency, improves value of every tonne of grain and ensures the industry’s global competitiveness. The value created will flow to producers and regional communities.
A strategy developed by GTA called ‘Modernising the grain supply chain – from drought, through COVID-19 to 2030’ has identified four key ‘Strategic Growth Pillars’ to develop and grow industry, through strategic efficiency gains in the value chain. The Strategic Growth Pillars are:
- Skills & Capability
- Quality & Market Access
- Technology
- Transport & Logistics
The grain value chain is reacting to global competition. The historical consolidated supply chain maintained by large bulk handling companies is evolving into a competitive mix of on-farm storage and commercial storage operators operating in an increasingly dynamic and entrepreneurial market. The grain supply chain is increasing its storage capacity and the number of operators through multiple container packers, new ports, country storage operators and farm-based storage and logistical enterprises.
This increasingly competitive and spatially distributed storage model provides opportunity for participants including grain producers as they more than ever can extract and capture value from the post farm gate supply chain. While delivering benefit, a broad and competitive multi-operator storage model does require guidance and support and pre-competitive cooperation if Australia is to drive efficiency and maintain its well-deserved reputation in the world market that has been built and earned over many years.
To enhance the competitiveness of the Australian value chain both industry and government need to play a significant role in investing in the long-term future to increase productivity and reduce paddock and supply chain costs to ensure our market position and improve farm gate returns.
However, industry alone cannot make the required supply chain investments or drive the system wide operational efficiencies on their own. There are several reasons including:
- The overall size or quantum of investment required.
- The risks around developing new technology.
- The broad base of beneficiaries across the value chain.
- Limited ‘first mover advantage’ for developing new technology.
- Limited ‘first mover advantage’ for investing in certain infrastructure relating to pre-competitive activities.
In developing policy settings to improve the position of Australian agricultural industry, trade is just one, albeit important policy consideration. Other factors, such as the supply chain, should be considered in order to improve competitiveness and extract economic value.
The Strategic Growth Pillars identified in the supply chain report are aligned with Government policy objectives in Agriculture, Trade and Market Access, Information Technology and Transport and Supply Chain portfolios. Delivery of projects in these portfolios provides opportunity for industry to work in partnership with Government to improve Australia’s global competitiveness and deliver value to regional communities.
Conclusion
Grain Trade Australia provides an industry driven self-regulatory framework across the grains industry to facilitate and promote the trade of grain and provides industry stewardship through specialist industry codes.
The 80% tariffs imposed on Australian barley exports by China, are estimated to reduce grain industry value by $2.5 billion over the five-year period of the tariffs.
As part of China’s investigation, the grains industry and Australian Government provided extensive information to refute China’s allegations of dumping barley and subsidising Australian barley growers.
In December 2020, the Australian Government notified China of its intention to progress the dispute through the formal dispute resolution processes of the WTO.
Australian industry will work on building demand for Australian barley and other grains, oilseeds and pulses to recapture value lost from the barley tariffs. This work should also include looking to improve efficiency of the grains supply chain to ensure Australia’s competitiveness in the global market place.
As 30-35% of growers total cost is in the supply chain, most of the benefits from improvements in the supply chain, will flow back to growers in improved value for every tonne moving through the supply chain, not just against tonnes flowing to individual markets.
Acknowledgements
The author would like to thank the Barley Industry Working Group (with members from GTA members, GIMAF, Grain Growers Limited, Australian Grain Exporters Council, Grain Producers Australia) for their extensive work and commitment on the China barley tariff issues.
Useful Resources
Australian Bureau of Agricultural and Resource Economics and Sciences
Australian Bureau of Statistics
Contact details
Pat O’Shannassy
Grain Trade Australia (GTA)
PO Box R1829 Royal Exchange, NSW, 1225
02 9235 2155
pat.oshannassy@graintrade.org.au
@GrainTradeAus
