Phosphorus application recommendations based on soil characterised zones
Phosphorus application recommendations based on soil characterised zones
Author: Sean Mason (Agronomy Solutions), Sam Trengove and Stuart Sherriff (Trengove Consulting) | Date: 09 Feb 2021
Take home messages
- Optimal phosphorus (P) applications for maximising gross margins vary significantly within a paddock and have been linked to varying soil properties.
- Soil P status, phosphorus buffering index (PBI), normalized difference vegetation index (NDVI) images and in-season plant analysis have identified poor performing areas where higher than replacement P rates are required.
- P replacement strategies based on estimated P removal in grain only work on soils where P is not limiting growth i.e. those with high soil P and low PBI.
- Poor performing areas should be ground-truthed to ensure soil P is not limiting crop production before implementing a replacement P strategy.
Background
Most growers in the southern region use a P replacement strategy based on the amount of P removed in the grain (i.e., 3kg P/t grain) to determine fertiliser P application rates. Recent response trial work in the broad acre cropping regions of South Australia (SA) has highlighted that some soils with moderate to high PBI levels (>100) tend to be P deficient and require relatively high P rates (>20kg P/ha) to maximise both yields and gross margins. Phosphorus fixation at these selected locations is associated with the presence of low to moderate levels of calcium carbonate (5-20%) and is marked by high soil pH values. Data from these soils which often occur in areas within a paddock suggest that current P application rates are not sufficient at meeting crop P demands when soil characteristics are factored in. Through more extensive data measurements it has also been found that these areas are quite often marked by poor early growth and vigour of cereals and can be identified by in-season NDVI images. Where variable rate fertiliser technology is used, based on replacement P strategies determined by P removal in grain yield, these poor areas receive lower amounts of P fertiliser which amplifies the P deficiency.
Typically, P deficiency through replicated trials has been assessed on small, selected regions of a paddock with little data quantifying variations in P requirements across the whole paddock. With an aim to improve P applications determined by soil characteristics and in-season NDVI imagery (rather than the ‘traditional’ replacement P strategies), a SAGIT funded project (TC219) tested zonal strategies in five paddocks across the past two growing seasons. Broader approaches have been used in the current GRDC project to assess responses to different starter P applications across the length of a paddock utilising strip trial methodology.
Method
Intensive paddock sampling for soil pH limitations, combined with satellite imagery identified different production zones across five paddocks located in the Mid North of SA. These zones can also be linked to soil properties which drive P availability, including soil pH, soil carbonate levels and the P fixation potential (measured by PBI) which can change dramatically over short distances within a paddock. Through the SAGIT funded project (TC219), the implication of these soil attributes on economic P rates has been tested by running 21 replicated field P response trials in different soil pH, PBI and NDVI zones split across the five paddocks. Wheat or barley responses to P applications were assessed at each of the 21 sites and optimal P rates determined at: 1) maximum grain yield and 2) maximum partial gross margins. The maximum partial gross margins obtained were related back to the partial gross margins that would have been obtained if a variable rate P replacement strategy was used. The replacement P rate was determined retrospectively by using the maximum yield obtained at each site and multiplying by 3kg P/ha, which is the rule of thumb for P removal per tonne of grain exported. Partial gross margins were calculated by using the same price for monoammonium phosphate (MAP), urea and grain across both seasons which were $650/t, $500/t, and $300/t, respectively.
Results and discussion
Site soil characteristics
Site selection was based on NDVI imagery taken early in the growth season (< GS31) from the cereal phase during the previous season and soil pH mapping performed using a Veris® soil pH mapper by Trengove Consulting. In all five paddocks tested, areas of the paddock with low early vigour and biomass correlated to high pH (driven by the presence of calcium carbonate), higher P fixation potential (PBI) and lower soil P availability, identified through Colwell P with PBI interpretation and diffusive gradients in thin films (DGT) analysis (Table 1).
Cereal response to P applications
From the 21 sites across the five paddocks, 11 sites had a significant grain response to P applications (Table 1). This highlights that previous P applications were enough to build soil P reserves and no significant reliance on P inputs was observed to increase grain yields at 48% of sites. The average soil PBI in the non-responsive sites was 52 with an average soil pH of 6.14. The highly significant (p < 0.001) responses to P were found on sites with an average PBI of 106 and soil pH of 7.66.
Table 1. Soil pH and P availability values for the 21 P trials performed in five paddocks across two growing seasons (2019-2020).
pH | Colwell P | PBI | DGT P | Response to P | ||
|---|---|---|---|---|---|---|
Paddock | Site | CaCl2 | mg/kg | ug/L | (grain) | |
Koolunga | 1 | 7.55 | 24 | 126 | 20 | ** |
2 | 7.58 | 28 | 141 | 25 | ** | |
3 | 6.19 | 44 | 44 | 93 | NS | |
4 | 5.87 | 58 | 73 | 71 | NS | |
Bute 19 | 5 | 4.94 | 36 | 25 | 150 | NS |
6 | 5.96 | 33 | 61 | 51 | NS | |
7 | 7.67 | 25 | 90 | 20 | ** | |
8 | 7.67 | 19 | 73 | 35 | ** | |
Brinkworth | 9 | 6.65 | 50 | 105 | 92 | NS |
10 | 7.63 | 96 | 64 | 198 | NS | |
11 | 7.69 | 44 | 120 | 21 | ** | |
12 | 6.22 | 93 | 66 | 168 | * | |
Bute 20 | 13 | 5.75 | 32 | 19 | 135 | NS |
14 | 7.82 | 49 | 66 | 70 | ** | |
15 | 6.11 | 67 | 85 | 71 | * | |
16 | 7.63 | 39 | 108 | 47 | ** | |
Kybunga | 17 | Tbc | 27 | 53 | 69 | NS |
18 | Tbc | 28 | 108 | 25 | ** | |
19 | Tbc | 27 | 23 | 158 | NS | |
20 | Tbc | 31 | 50 | 58 | NS | |
21 | Tbc | 34 | 119 | 16 | ** |
The significance of grain yield response to P applications of each site is indicated by ** (p < 0.01), * (p < 0.05) and non-significant response (NS).
Identifying soil characterised zones for phosphorus management
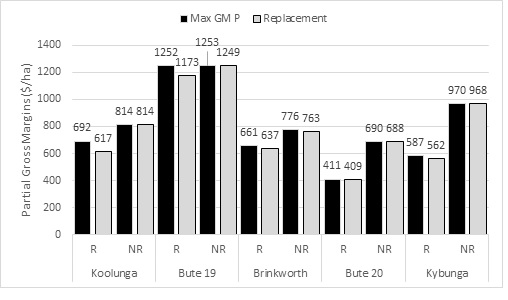
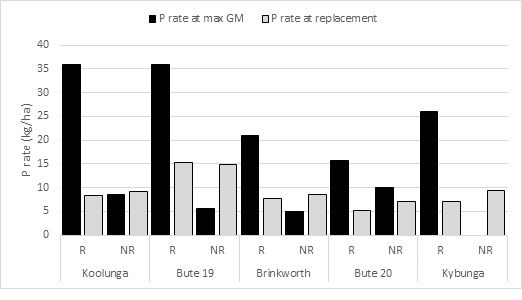
The trial sites that were highly significant and responsive to P applications had P requirements of more than 30kg P/ha to maximise yields. This P input is a large investment, and its economic advantage needs to be tested before implementation at large scales. Comparing partial gross margin analysis for two categories (Maximum gross margin (Max GM) point with P rate versus gross margin (GM) at replacement P rate) indicates that there are considerable improvements that can be made in productivity and GM by identifying soil zones prone to P deficiency and requiring higher P rates than recommended by replacement P calculators. The magnitude of the improvement in productivity will be determined by the proportion of the paddock that expresses these soil characteristics. Identification of responsive sites at Koolunga and Bute (during the 2019 season, Bute 19) improved partial gross margins (for those soil types) by $75 and $79/ha, respectively over replacement P scenarios (Figure 1). However, benefits of only $24/ha, $2/ha and $25/ha were obtained for Brinkworth, Bute 20 and Kybunga, respectively, highlighting the varying circumstance within each paddock (Figure 1). As expected, Max GM was obtained at near replacement P rates for non-responsive sections of each paddock. In theory, for non-responsive sites Max GM would be obtained at 0kg P/ha. As expected, the P rates which corresponded to Max GM were considerably higher for responsive areas compared to replacement P rates and apart from Bute 20, Max GM P rates were lower than replacement P for non-responsive sites (Figure 2).

Figure 1. Comparison of partial gross margins if P response was optimised with identification of responsive sites (R (sites merged)) compared to partial gross margins obtained if replacement P rates were used for each paddock. Corresponding analysis for non-responsive sites (NR).

Figure 2. Phosphorus rates obtained at maximum GM for responsive and non-responsive zones in five paddocks compared to replacement P rates at each zone.
The locations of the paddocks analysed in the SAGIT project) were targeted in the Mid North of SA while previous selected P trial work on similar soil zones occurred through the Yorke Peninsula. Through the GRDC investment project (9176604), similar paddock variation has been recorded through the northern Mallee of Victoria, parts of the Wimmera and on the Eyre Peninsula. Validation via the grower scale fertiliser strip treatments has shown very similar variation in P rates to maximise GM which have been associated with high soil pH and PBI, low P availability, and low NDVI. From 213 paddocks sampled in the southern region prior to the 2020 growing season, 51% of paddocks reported lower soil test P and higher PBI values in the low production zone compared to high production zones, as outlined by in-season NDVI and grain yield maps. Overall, 36% of paddocks had soil test values low enough to indicate that their yields would potentially improve from a boost in P input application within these zones.
Variation in grain yields and in-season NDVI images across a paddock can be driven by multiple soil constraints (e.g., acidity, low water holding capacity, high soil strength and poor structure) and climatic interactions. In some instances, production could be improved by targeting P inputs in lower production zones as identified through soil characterisation. It is important to ground-truth yield variability and constraints to production through soil testing and interpretation before moving to replacement P programs.
Conclusion
Phosphorus availability is controlled by inherent soil properties and often the variation across a paddock will impact the optimum P input application strategy. Increases in gross margins can be obtained by identifying zones that express high PBI, high soil pH, low early biomass, and low plant P tissue contents and increasing the P rates accordingly. In SA these poor zones within a paddock are often associated with high pH and calcium carbonate content. These zones can change quite quickly over a landscape within 100-200m. Classifying zones via soil analysis and characterisation will build confidence that current P management practice is providing maximum returns.
Acknowledgements
The research undertaken as part of this project is made possible by the significant contributions of growers through both trial cooperation and the support of the GRDC, the author would like to thank them for their continued support. We would also like to acknowledge the growers involved in SAGIT funded project TC219 for allowing multiple trial sites within one paddock.
Contact details
Dr. Sean Mason
Research and Director of Agronomy Solutions Pty. Ltd.
U3/11 Ridley Street, Hindmarsh SA 5007
0422 066 635
sean@agronomysolutions.com.au
@AgSolutionsOz
GRDC Project Code: ASO1805-001RTX,
