Russian wheat aphid thresholds - Insect density, yield impact and control decision making
Take home message
- Russian wheat aphid (RWA) risk from ‘natural invasion’ (as opposed to inoculated insect pressure) was nonsignificant in all 28 trials in 2018 and 2019
- RWA yield impact is 0.28 % yield loss per percent of tillers with RWA (%TwRWA)
- After GS30 (start of stem elongation), the number of tillers with RWA doubles about every 35 days, thus doubling %TwRWA’
- The RWA action threshold calculator is now available on-line and supports adoption of an IPM approach.
Background
This project studied the risk of infestation by the Russian Wheat Aphid (RWA, Diuraphis noxia Kurdjimov) and its effect on yield to develop best management practices in an Australian context of winter cropping of short cycle cereals (e.g. spring wheat). Risk of yield loss depends on aphid invasion, subsequent pest development and sensitivity of the crop to the pest.
Previously, there were no data available for quantitative and qualitative yield effects of RWA and the development of intervention thresholds in Australian cereal growing conditions. Overseas data, from North America and South Africa, where RWA has been present for many decades (Archer and Bynum 1992; Du Toit and Walters 1984; Du Toit 1986; Bennett 1990a,b; Kieckhefer and Gellner 1992; Girma et al 1990, 1993, Mirik et al 2009, Legg and Archer 1998, Chander et al 2006), report a wide range of potential damage levels (yield loss and qualitative losses) and derived economic injury levels. Losses of around 0.5% of yield loss per percentage of RWA infested tillers during stem elongation and grain filling are most frequently reported (Archer and Bynum 1992).
These knowledge gaps were addressed through
- 28 natural RWA infestation field trials in 2018 (15) and 2019 (13) in South Australia, Victoria, New South Wales and Tasmania (Table 1)
- 15 RWA inoculated field trials in 2018 (5) and 2019 (10) where 50 RWA/m2 (500,000 RWA/ha) were applied at GS15-20 (2-4 leaf stage, Table 1)
- Green Bridge sampling of grasses during the non-cropping period in both years in all states and extensive continuous sampling of grasses in SA over 26 months (March 2018-May 2020).
Table 1. Location of trial sites in 2018 and 2019
Site Name | State | Lat | Long | Inoculation | Irrigation |
|---|---|---|---|---|---|
2018 | |||||
Birchip | VIC | -35.9666 | 142.8242 | Y | N |
Cummins | SA | -34.3050 | 135.7189 | N | N |
Griffith | NSW | -34.1902 | 146.0920 | Y | N |
Hillston | NSW | -33.5482 | 145.4408 | N | Y |
Inverleigh | VIC | -38.1805 | 144.0390 | N | N |
Keith | SA | -36.1299 | 140.3233 | Y | N |
Lockhart | NSW | -35.0837 | 147.3280 | N | N |
Longerenong | VIC | -36.7432 | 142.1135 | N | N |
Loxton | SA | -34.4871 | 140.5891 | Y | N |
Minnipa | SA | -32.8398 | 135.1642 | N | N |
Nile DRY | TAS | -41.6759 | 147.3140 | N | N |
Nile IRR | TAS | -41.6759 | 147.3140 | N | Y |
Piangil | SA | -35.0519 | 143.2758 | N | N |
Riverton | SA | -34.2193 | 138.7350 | Y | N |
Yarrawonga | NSW | -36.0484 | 145.9833 | N | N |
2019 | |||||
Birchip | VIC | -35.9666 | 142.8242 | Y | N |
Bundella | NSW | -31.5851 | 149.9064 | N | N |
Cressy | TAS | -41.7854 | 147.1134 | Y | N |
Eugowra | NSW | -33.4944 | 148.3192 | N | N |
Griffith | NSW | -34.1902 | 146.0920 | Y | N |
Horsham | VIC | -36.7432 | 142.1135 | Y | N |
Inverleigh | VIC | -38.0497 | 144.0104 | Y | N |
Loxton | SA | -34.4871 | 140.5891 | Y | N |
Minnipa | SA | -32.8398 | 135.1642 | Y | N |
Mildura | VIC | -34.2627 | 141.8535 | Y | N |
Pt Broughton | SA | -33.5757 | 137.9987 | Y | N |
Thule | NSW | -35.6491 | 144.3914 | Y | N |
Yarrawonga | NSW | -36.0484 | 145.9833 | N | N |
Outcomes
Risk of RWA invasion of crops: Overall RWA risk was very low during these two (very dry) years with no significant RWA infestation occurring in any of the non-inoculated field trials. This shows that the largely adopted use of prophylactic seed treatments against RWA was not justified.

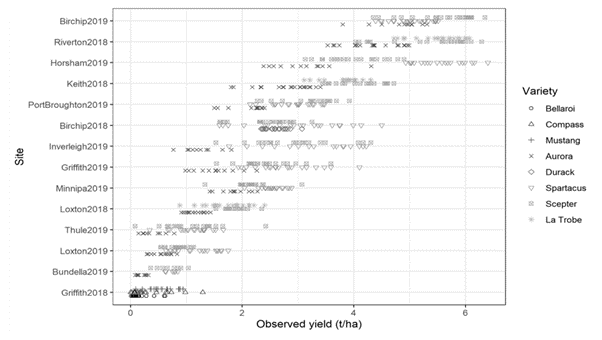
Figure 1. Yield across all trial sites and years with different cereal type/variety denoted by different markers. Varieties used: Barley: Compass; Spartacus CL, La Trobe; Durum wheat: EGA Bellaroi, DBA Aurora; Wheat: Scepter, Mustang; Oat: Durack.
Yield loss in inoculated trials: Regional and varietal differences were large (Figure 1). In some, but not all, of the inoculated field trials RWA populations reached population levels (maximum observed between GS40 and 50) resulting in yield loss. The best predictor of yield loss of various aphid pressure metrics was the maximum percentage of tillers with RWA present (%TwRWA) and a percentage of the potential yield loss with a 0.28% yield loss observed for every %TwRWA. This simple relationship applied to all the different cereal types (wheat, barley, durum wheat), years and regions (through the adjustment of potential yield), oat did not allow RWA development. This yield impact is significantly lower than described for the USA (0.46-0.48% for every %TwRWA, Archer and Bynum 1992).
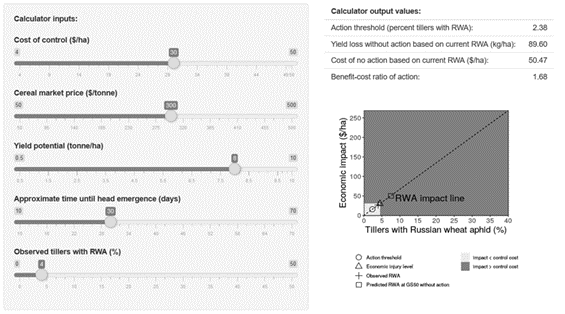
From this equation, the economic threshold (the break-even point of yield loss and control measures) can be calculated depending on the costs of control (pesticide, applications costs), the expected yield (region and year dependant) and the farm-gate price of the crop as parameters (Figure 3).

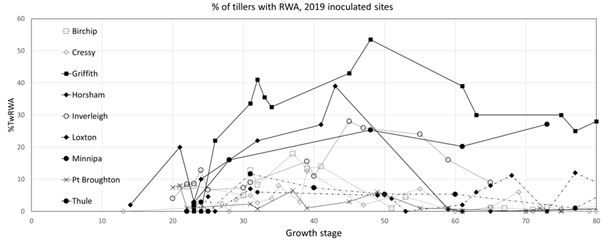
Figure 2. Percentage of tillers with RWA (%TwRWA) against growth stage for the RWA inoculated untreated control plots (AI-UTC) in all inoculated trial sites in 2019.
RWA population development: After inoculation with RWA, the highest RWA populations developed in drier regions, through a combination of increased RWA establishment during inoculation and increased rates of subsequent population increase. Less tillering in dry areas also contributed to a higher %TwRWA. The maximum population of RWA and the maximum %TwRWA was reached between GS40 and 50 (Figure 2) followed by a decrease. Between the end of tillering (GS30) and GS50 an increase in the %TwRWA of 0.021%/%/day was observed. This would result in a doubling of the %TwRWA every 35 days.
Action threshold calculator: Based on these observations and equations, we propose a decision rule (action threshold, Figure 3) for RWA management using an observation of the percentage of tillers with symptoms and the %TwRWA at GS30. This observation and the expected increase in %TwRWA (based on the expected time to ear emergence GS50), inform the need for management action, which can (if needed) be combined with existing treatments at GS32-35, thus reducing application costs. Growers and advisers are directed to the GRDC calculator (see additional resources) to calculate thresholds for their growing conditions”

Figure 3. RWA action threshold calculator (example)
Green bridge risk: The environmental conditions over summer that form a ‘green bridge’ of suitable (grass) habitat between winter crops were expected to determine the risk of early colonisation events.
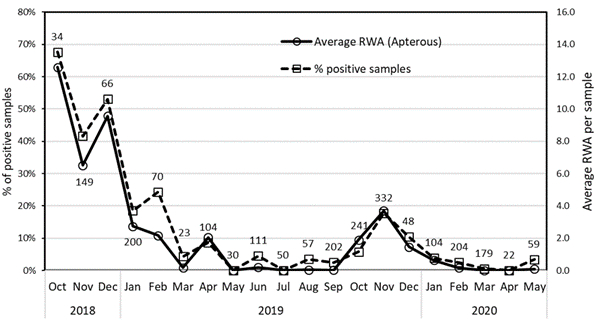
Field surveys during the spring to autumn periods demonstrated RWA detections being particularly common and with high populations during spring in the warm dry grain growing regions of northern Victoria, southern New South Wales and South Australia. During the summer, growing crops and green vegetation for most grass species disappeared and RWA populations declined (Figure 4). Apart from volunteer cereals (wheat and barley), the majority of RWA detections were on five grass genera (barley grass, Bromus sp., phalaris, ryegrass and wild oat.

Figure 4. Dynamics of the percentage of positive samples (dotted line, left axis) and average RWA per sample (Solid line, right axis) over time in SA. Samples were 2 litres of grass extracted in a Berlese funnel. Numbers above markers show number of samples taken permonth. n = 2285
Barley grass (Hordeum leporinum) and (to a lesser extent) Brome grasses (Bromus sp.) were the host plants that showed the highest combination of abundance, positive RWA detection frequency and aphid numbers. These introduced species are not summer active in low rainfall areas. In low rainfall areas, the native Enneapogon nigricans (bottle-brush) is the most important summer refuge because of its widespread distribution (207 samples collected from 135 sites) and summer growth pattern. Grazing and water availability (irrigation) can make some host grass populations, including prairie grass, couch grass, ryegrass and volunteer cereals, persist in summer. The presence of irrigated crops increased the likelihood of RWA detections 1.6-fold over the green bridge.
Early rainfall in late summer/autumn, 2-3 months before sowing, could cause RWA population to build up on grasses and cereal regrowth, potentially exacerbating early crop invasions. A 250 mm high rainfall event in the Birchip area (Vic) in December 2018 did cause significant development of a green bridge, but did not seem to result in increased RWA risk. Reports in 2020 from the Port Augusta area (SA), where a significant summer rain occurred on February 1st, suggested an increase in RWA pressure. This shows that observations, especially in early break years and better understanding of aphid population dynamics and migration on the green bridge before and after sowing, are needed to obtain more precision on the impact of the green bridge and the risk and timing of crop invasion.
A ‘wetter’ year with a higher green bridge, or if immigration of aphids occurs at a higher level for some other reason, might increase aphid colonisation, but will not automatically result in higher impact of RWA. Wetter and colder conditions are less favourable for RWA development in the crop (as can be seen from the Tasmanian trials), through a combination of slowing down population development, improving the crop development which will better resist RWA, and more tillering (diluting the aphid numbers over a lower % of tillers. The two experimental years experienced generally low levels of growing season rainfall, so RWA development in the crop (after inoculation) was probably maximal on these often drought stressed crops.
Crop sensitivity: Similar yield impact and aphid population development was observed for all crops tested, except for oats which is known not to be an RWA host. However, crop and varietal differences in RWA establishmentare likely to exist and have been reported. Also, the crop condition (growth stage, level of tillering, drought stress, nutritional stage) will play a role in RWA development and could change the probability of reaching above threshold populations.
Conclusions
RWA ecology and yield impact in Australia are now somewhat better understood. This allows growers and agronomists to manage RWA more sustainably and economically. Management based on observations and regionally adapted decision rules, rather than an over-reliance on prophylactic seed treatments, will increase profitability, minimise chemical inputs and reduce off-target risks and resistance development.
The two years during which this study was done were very dry, with hot summers and growing seasons, and were generally unfavourable for RWA survival over summer, but favourable for the development of RWA in the inoculated trials (Baugh and Phillips 1991, De Farias et al. 1995). Some anecdotal observations in 2020, and in the few years that RWA is known to be present (since 2016, Ward et al 2020, Yazdani et al 2018), do suggest that the population levels will be very different (but not necessarily more damaging) with different rainfall patterns. More experience and research are needed to better understand RWA ecology and would enable further improvement to management guidelines.
The geographical distribution of RWA is expected to increase further into northern NSW and Queensland (Avila et al. 2019), and RWA was detected in Western Australia in 2020. Different growing conditions (temperature, drought) and presence of other cereal crops, including summer cereals (rice, corn, sorghum, millet), and other grass hosts could alter the risk of RWA in those regions.
Acknowledgements
The research undertaken as part of this project is made possible by the significant contributions of growers through both trial cooperation and the support of the GRDC, the author would like to thank them for their continued support. Trials were run through multiple contractors requiring long hours of careful observations. Special thanks to Courtney Proctor, Bonnie Wake and Millie Moore for data management and long trips required for aphid inoculations and scoring trials, and Farah Al-Jawahiri for aphid rearing.
Additional resources
GRDC Russian wheat aphid resource page
References
Archer TL and Bynum EO (1992). Economic Injury Level for the Russian Wheat Aphid (Homoptera: Aphididae) on Dryland Winter Wheat. J Econ Entomol 85:987–992. doi: 10.1093/jee/85.3.987
Avila GA, Davidson M, van Helden M and Fagan L (2019). The potential distribution of the Russian wheat aphid (Diuraphis noxia): an updated distribution model including irrigation improves model fit for predicting potential spread. Bulletin of Entomological Research 109, 90–101.
Baugh BA and Phillips SA (1991). Influence of population-density and plant water potential on Russian wheat aphid (Homoptera: Aphididae) alate production. Environmental Entomology 20, 1344-1348.
Bennett LE (1990a). Preliminary economic threshold level for Russian wheat aphid (RWA) Diuraphis noxia (Mordvilko), on dryland winter wheat in south eastern Wyoming. Final Report to the Wyoming Wheat Growers Association, 20 August 1990, Laramie, WY
Bennett LE (1990b). Economic damage, economic injury levels and economic threshold levels for Russian wheat aphid (RWA), Diuraphis noxia (Mordvilko), on winter barley in Wyoming. M.S. thesis, University of Wyoming, Laramie.
Chander S, Ahuja LR, Peairs FB, Aggarwal PK and Kalra N (2006). Modelling the effect of Russian wheat aphid Diuraphis noxia (Mordvilko) and weeds in winter wheat as guide to management, Agricultural Systems, vol. 88, pp. 494–513, 2006.
De Farias AMI, Hopper KR and Leclant F (1995). Damage symptoms and abundance of Diuraphis noxia (Homoptera: Aphididae) for four wheat cultivars at three irrigation levels. J. Econ. Entomol. 88: 169-174.
Du Toit F and Walters MC (1984). Damage assessment and economic threshold values for the chemical control of thr Russian wheat aphid, Diuraphis noxia (Mordvilko) on winter wheat. Tech Commun Dep Agric Repub South Africa 58–62
Du Toit F (1986). Economic thresholds for Diuraphis noxia (Hemiptera: Aphididae) on winter wheat in the eastern Orange Free State. Phytophylactica. 18, 107-109.
Girma M, Wilde G and Reese JC (1990). Influence of temperature and plant growth stage on development, reproduction, life span, and intrinsic rate of increase of the Russian wheat aphid (Homoptera: Aphididae). Environmental Entomology 19: 1438.
Girma M, Wilde GE and Harvey TL (1993). Russian wheat aphid (homoptera, aphididae) affects yield and quality of wheat. Journal of Economic Entomology. 86, 594-601.
Kieckhefer RW and Gellner JL (1992). Yield losses in winter wheat caused by low density cereal aphid populations. Agron. J. 84, 180–183.
Legg DE and Archer TL (1998). Sampling Methods, Economic Injury Levels, and Economic Thresholds for the Russian Wheat Aphid. In: Response Model for an Introduced Pest—The Russian Wheat Aphid. pp 313–336
Mirik M, Ansley J, Michels J and Elliott N (2009). Grain and vegetative biomass reduction by the Russian wheat aphid in winter wheat. Southwestern Entomologist 34, 131–139.
Ward S, van Helden M, Heddle T, Ridland PM, Pirtle E and Umina PA (2020). Biology, ecology and management of Diuraphis noxia (Hemiptera: Aphididae) in Australia. Austral Entomol. 59(2): 238-252 DOI: 10.1111/aen.12453
Yazdani M, Baker G, DeGraaf H, Henry K, Hill K, Kimber B, Malapatil M, Perry K, Valenzuela I and Nash, MA (2018). First detection of Russian wheat aphid Diuraphis noxia Kurdjumov (Hemiptera: Aphididae) in Australia: a major threat to cereal production. Austral Entomol. 2018; 57: 410–417. https://doi.org/10.1111/aen.12292
Contact details
Maarten van Helden
South Australian Research & Development Institute
GPO Box 397 Adelaide SA 5001
Ph: 08 8429 0642
Email: maarten.vanhelden@sa.gov.au
Varieties displaying this symbol beside them are protected under the Plant Breeders Rights Act 1994.
GRDC Project Code: UOA1805-018RTX,
Was this page helpful?
YOUR FEEDBACK
