Satellites and other useful tools that are ready for immediate benefit for on-farm decision making
Satellites and other useful tools that are ready for immediate benefit for on-farm decision making
Author: Tim Neale, DataFarming | Date: 26 Feb 2021
Take home message
Growers and agronomists have access to free (and paid) precision agriculture (PA) tools to obtain immediate benefits for their crop management. Satellite imagery represents one of the simplest entry points to get started on the journey of precision agriculture. Many Australian farms have yield variation of more than 300% in every single paddock. Combined with targeted soil and plant sampling, a deeper understanding of the factors impacting on production can be identified and remediated. Coupled with that, variable rate technology (VRT) offers the ability to better target crop inputs.
Barriers to adoption
In a GRDC/CSIRO survey several years ago, it showed that whilst around 75-80% of farmers had adopted auto-steer GPS systems on machinery, only 4% of farms had viewed a satellite image of their property, and only 10% were using variable rate technology (Llewellyn and Ouzman, 2014). DataFarming set about to identify the barriers to adoption of digital agriculture technologies, and narrowed them down into five main areas:
- Cost of entry
- Complexity of the systems available
- Ease of use and user experience
- Connectivity (internet, and between equipment brands) and
- Not getting instant value.
Whilst many farmers embrace digital ag technologies, agronomists are making more and more complex decisions on increasingly bigger farms and paddocks; so there is a great opportunity to become far more efficient in the way we check, manage and treat crops.
Getting started
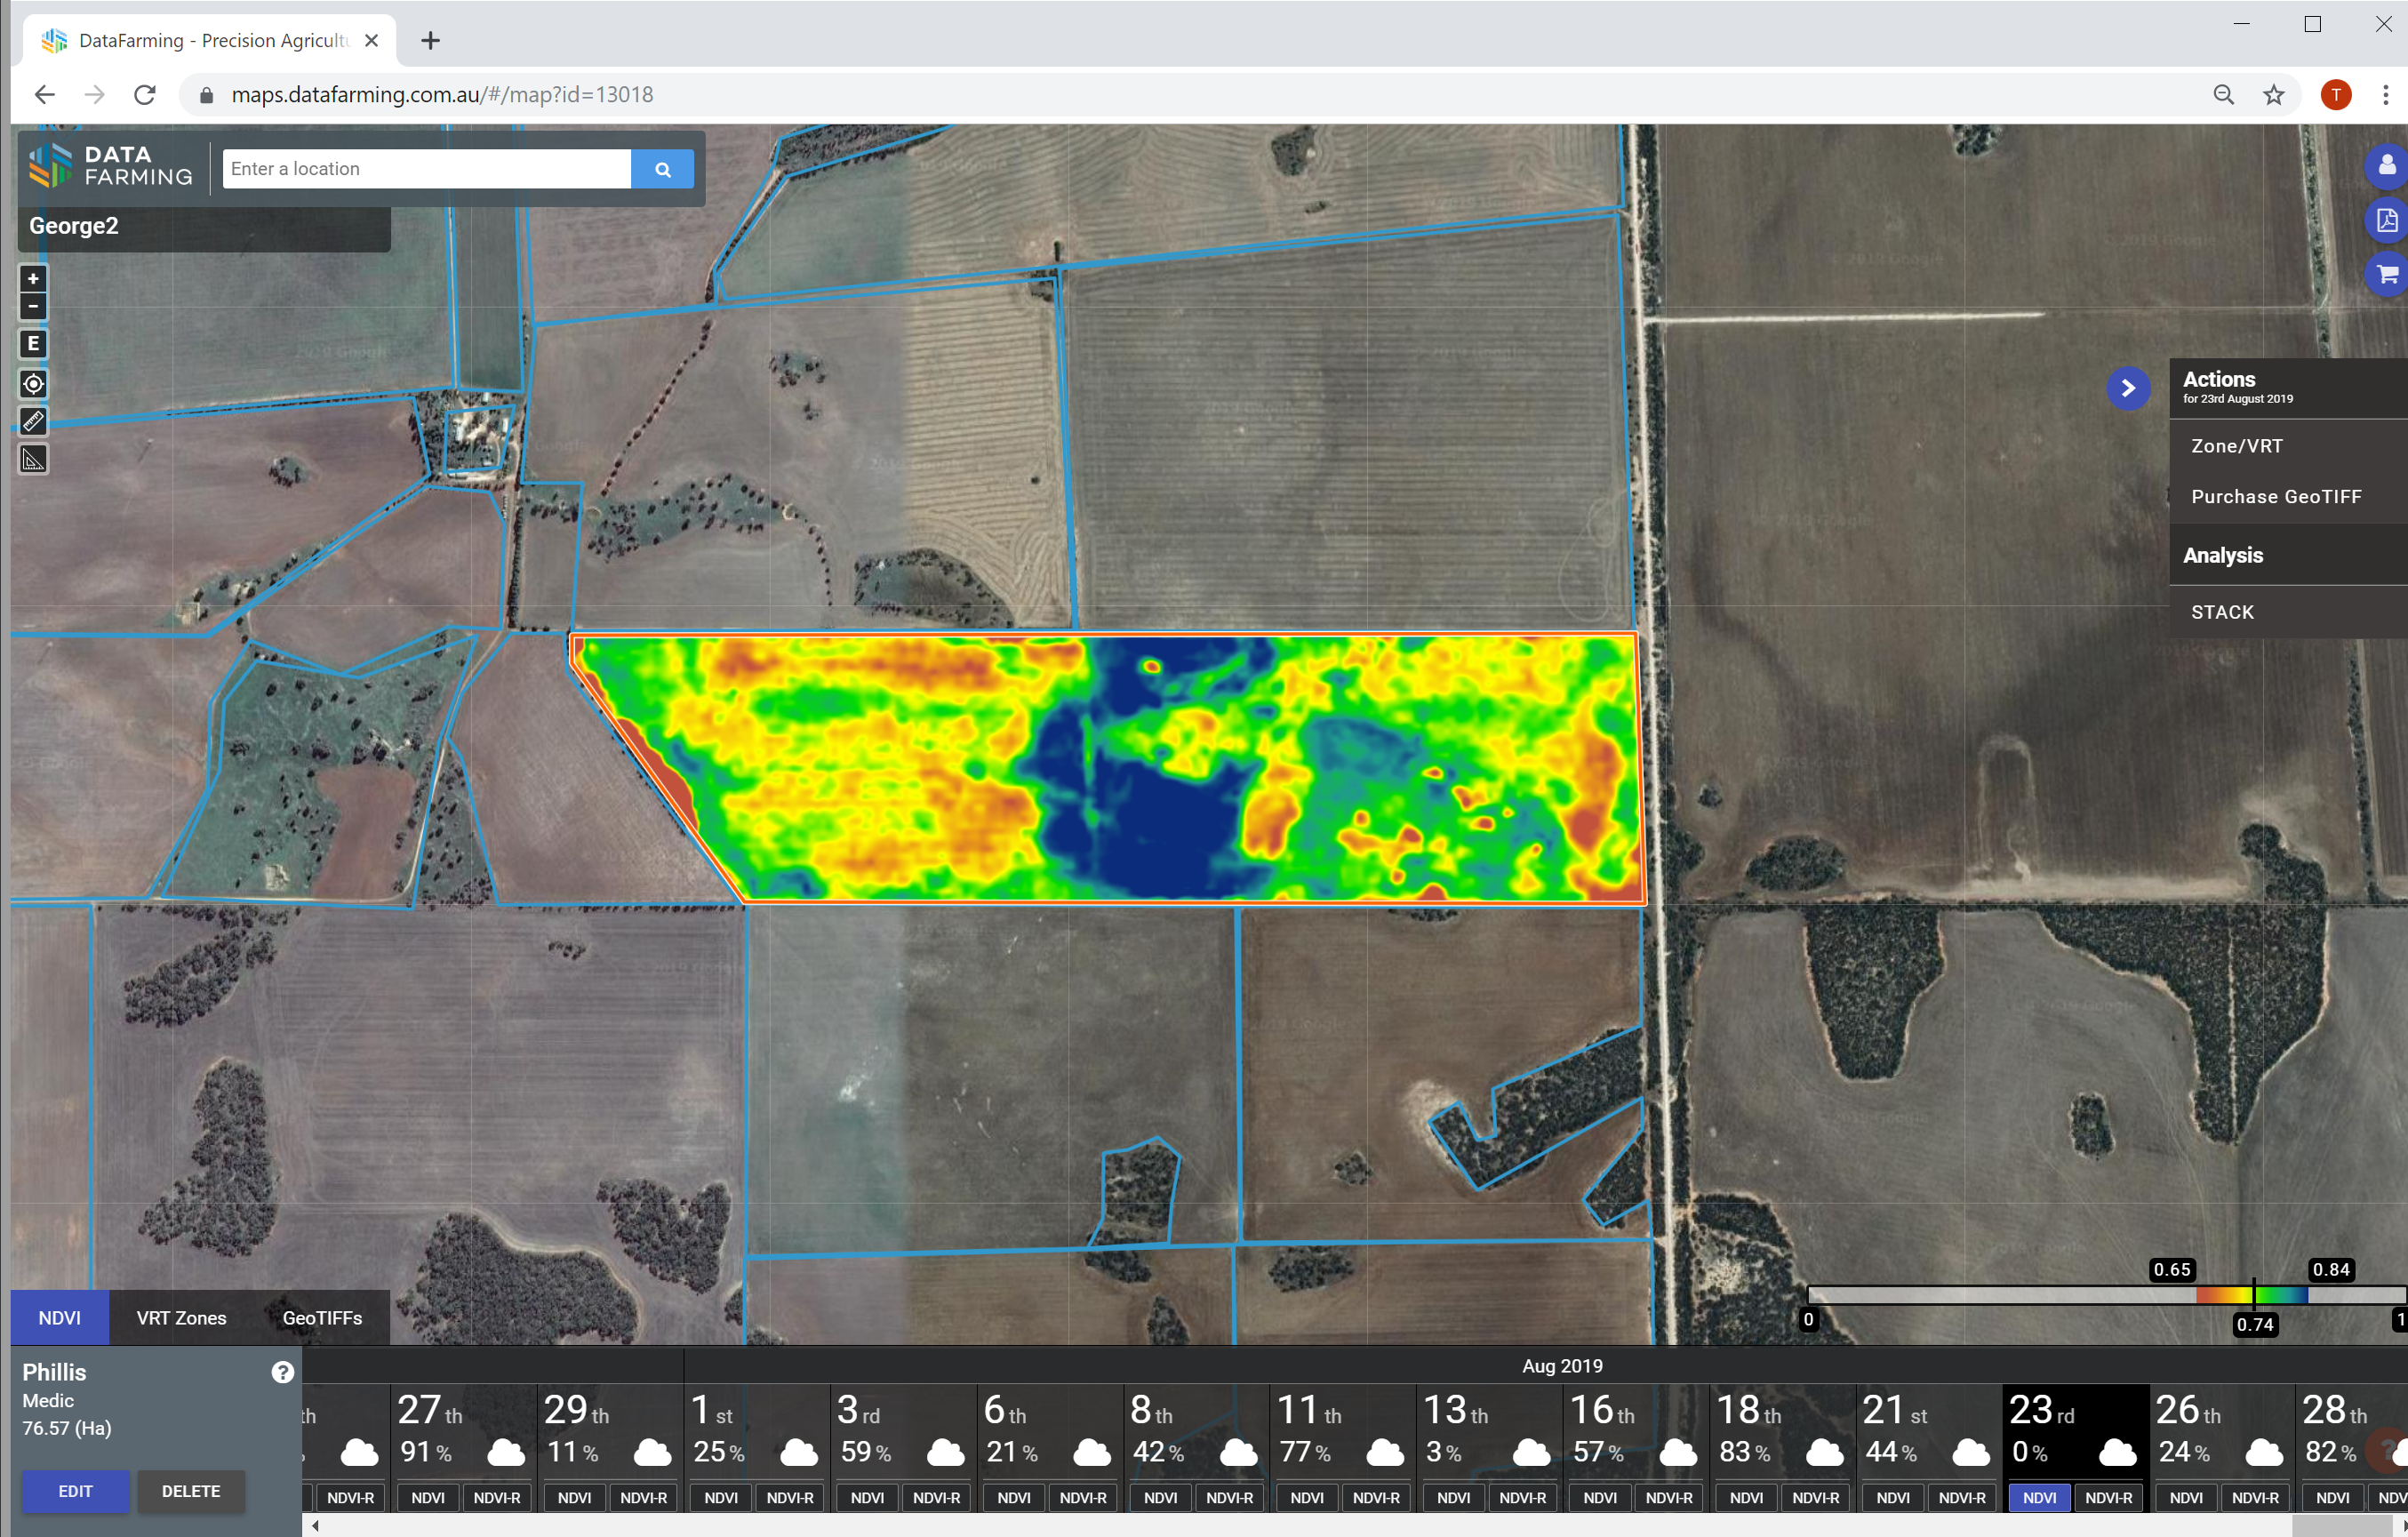
The first step is to get satellite imagery of your paddocks whilst the crop is growing. With the availability of 10 metre resolution data every five days anywhere in the world, essentially for free, this is a great starting point. The key difference is that satellite imagery shows impacts beyond what our eyes can see – so we can detect crop problems earlier, and easily measure the impacted area. A crop growth index called NDVI which measures in the infrared spectrum, picks up difference in crop health/greenness/biomass. This helps direct where to look when scouting or checking crops. See below (Figure 1) for an example from the DataFarming platform – where the blue areas (centre) of the paddock are high growth, and the areas in red (left and right) are poorer growth.
 Figure 1. An example from the DataFarming platform – where the blue areas (centre) of the paddock are high growth, and the areas in red (right and left) are poorer growth.
After three years (up to the end of 2020) there are now 20,000 farms loaded in the DataFarming platform covering almost ¼ of the Australian grains industry, and 20M acres of paddock level data processed.
Targeted soil and plant sampling
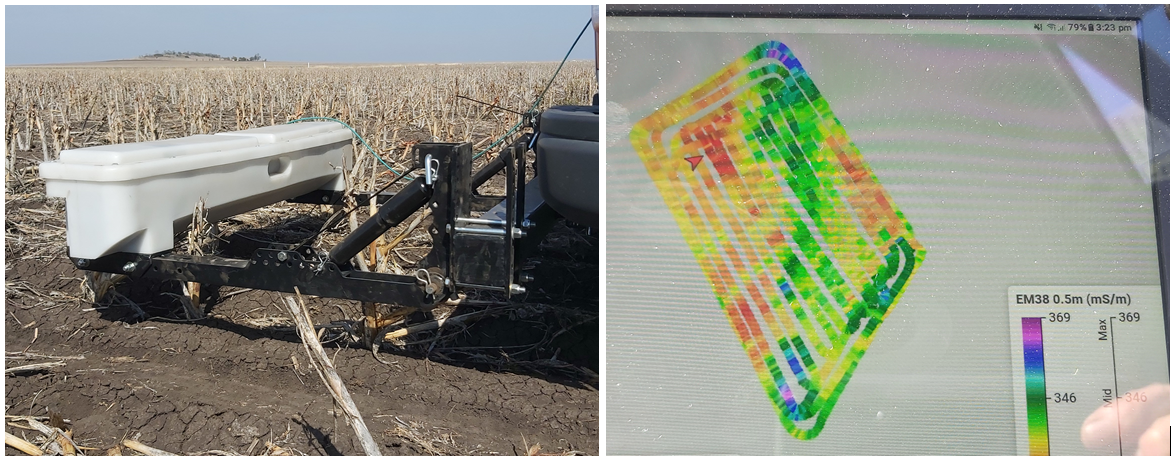
Whilst technologies such as EM (electromagnetic) mapping have been around for decades, only a few key contractors offer the service in Australia. With the advent of new tools, any agronomist can now capture soil type data using EM from the comfort of the ute. EM typically measures down to 1.5m into the soil to detect differences in clay content, moisture content, and soil salts. Below (Figure 2) is an example of one of these tools, and the resultant data on the right.

Figure 2. An example of an EM machine on the back of a ute (left) and resulting data map (right)
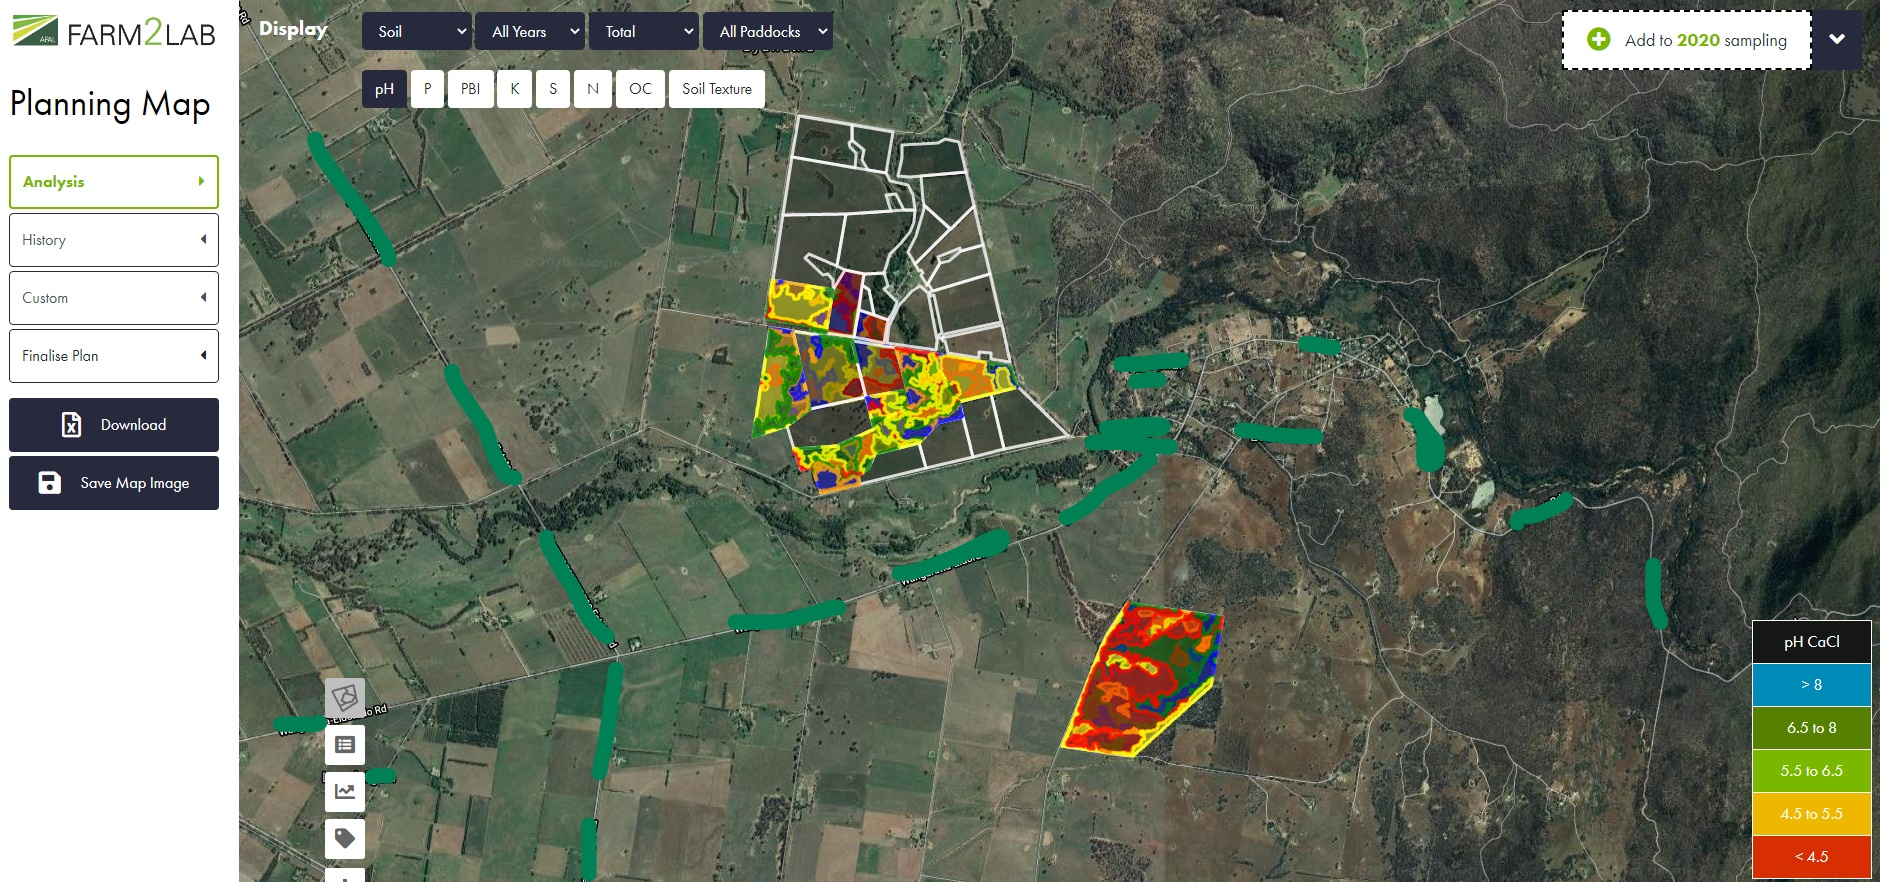
For agronomists collecting soil samples, the APAL Farm2Lab app takes the out the paperwork and streamlines the whole process. It doesn’t make the practical part of sampling any easier, but certainly speeds up the process and improves efficiency. You can add zonal layers at the planning stage, before entering the paddock, which helps select the right spot to sample. Once sites are selected and you determine the suite of tests you want, the points are available in an offline app which directs you in the field. Once collected the geo-referenced results are presented back in the app for easy viewing and understanding. The results can also be pushed to BackPaddock or Agworld software for interpretation and building recommendations.
The image (Figure 3) below shows zone maps in the Farm2Lab app, ready for soil sampling.
 Figure 3. Zone maps in the Farm2Lab app, ready for soil sampling
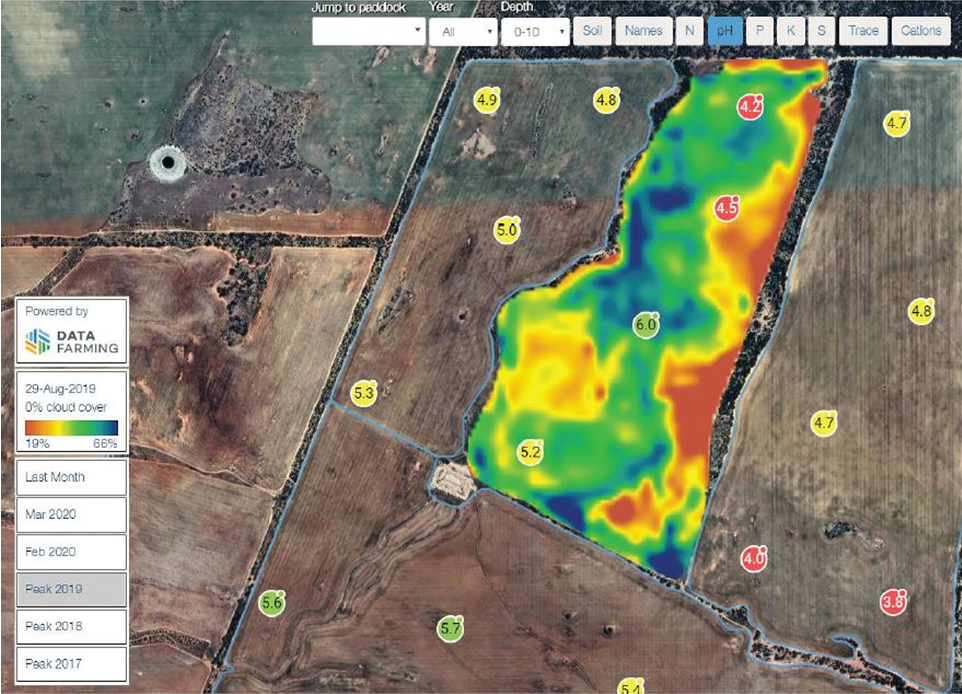
Results can also be displayed in other platforms. The image below (Figure 4), shows the resultant soil test levels overlaying the NDVI imagery in the Summit fertiliser app. This enables farmers and agronomists to get better value out of soil testing, as well as understand and alleviate production limiting factors.
 Figure 4. Soil test levels overlaying the NDVI imagery in the Summit fertiliser app
References
Llewellyn, R. and Ousman, J. (2014) Adoption of precision agriculture-related practices: status, opportunities and the role of farm advisers.
Acknowledgements
DataFarming acknowledges the funding it has received through the GrainInnovate fund managed through Artesian Venture Partners.
Contact details
Tim Neale
DataFarming
P.O. Box 253, Highfields 4352
Ph: 0409 634 006
Email: tim@datafarming.com.au
