The National Phenology Initiative: predicting cultivar phenology at point of release
The National Phenology Initiative: predicting cultivar phenology at point of release
Take home messages
- Optimising flowering time of wheat and barley cultivars is one of the most cost-effective ways for growers to maximise yield.
- The National Phenology Initiative (NPI) is improving Agricultural Production Systems sIMulator (APSIM) Next Gen so that it can accurately predict cultivar phenology classification and optimal sowing dates across Australia at point of release.
- The improved APSIM Next Gen model, parameterised and validated using NPI data, is more accurate at simulating phenology than APSIM Classic or the baseline APSIM Next Gen model.
- Work on the improved model is ongoing and it will be available to growers and advisers in 2022.
- In addition, the NPI is working to develop a new cultivar phenology classification scheme and new scale of cereal development.
Background
Flowering time is a critical determinant of grain yield in wheat and barley. When crops flower in the optimal period, yields are maximised by minimising losses due to frost, heat, drought and insufficient radiation (Flohr et al. 2017). Flowering time is determined by interactions between genetics, environment and management: the development speed of the cultivar, the environment in which it is grown, and the time of sowing. To ensure crops flower in the optimal period, accurate information on a cultivar’s development speed is needed, but this information is currently not available when new cultivars are released to the market. Instead, a cultivar’s development speed or classification is determined using time of sowing experiments over multiple sites and years. These experiments are costly, time consuming and environment specific. In addition, flowering time models like APSIM (Keating et al. 2003) perform poorly outside a narrow range of validated scenarios.
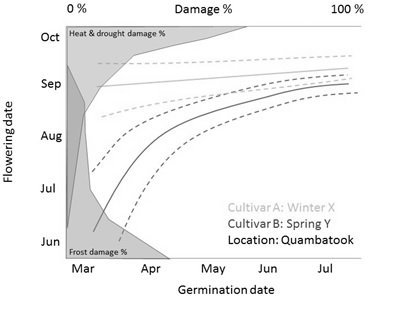
The NPI is improving the APSIM Next Gen model (Holzworth et al. 2018) of wheat and barley development so it is possible to accurately predict cultivar classification and optimal sowing dates across Australia at the time at which cultivars are released to the market. The improved APSIM Next Gen model will be able to be rapidly parameterised with controlled environment phenotypic data, molecular markers and/or other genomic data, removing the need for time of sowing field experiments. The NPI will deliver a tool for growers and advisers to more accurately predict optimal sowing date that will be available in 2022 (Figure 1). This tool will allow growers to make informed decisions about cultivar selection and time of sowing in their specific environment. It will also help to quantify the consequences of non-optimal sowing dates.
In addition to the improved APSIM Next Gen model, the NPI is also developing an improved cultivar phenology classification scheme and a new scale of cereal development.

Figure 1. A mock-up of the APSIM Next Gen model output that would be available at point of cultivar release.
Project methodology
The NPI is a collaborative, cross-disciplinary project led by La Trobe University with project partners from CSIRO, Plant & Food Research NZ, South Australian Research and Development Institute, NSW Department of Primary Industries, Department of Primary Industries and Regional Development WA, and Statistics for the Australian Grains Industry (SAGI) West. The NPI team includes field agronomists, crop physiologists, geneticists, modellers, and software engineers.
The NPI is using an Australian Phenology Panel comprising 64 wheat and 32 barley cultivars that have been selected to represent the diversity in both genotype and development patterns in these crops. Phenotyping of the Australian Phenology Panel has been carried out in controlled environments with factorial combinations of photoperiod (8 and 17 h) and vernalisation (nil and 8 weeks at 5°C) to derive plant development parameters (leaf emergence, time to heading, time to anthesis). These controlled environment data are being used to parameterise the APSIM Next Gen phenology routine.
A comprehensive model validation dataset has been compiled using field experiments conducted in Yan Yean (Victoria (Vic)), Wagga Wagga (New South Wales (NSW)), Callington and Urrbrae (South Australia (SA)) and Merredin and Dale (Western Australia (WA)) in 2019 and 2020. In each experiment, the Australian Phenology Panel was sown at eight times of sowing from 1 March to 15 June. Emergence and heading dates were collected on all 96 cultivars, and leaf emergence and anthesis dates were collected on a subset of 12 wheat and six barley cultivars.
All cultivars in the Australian Phenology Panel are being genotyped using molecular markers for major development gene alleles and assayed for single nucleotide polymorphisms (SNPs). Genome wide association analysis is being used to identify genetic associations with plant development parameters, with the view to incorporating these genetic parameters into the APSIM Next Gen model or using them as a proxy for phenotypic parameters.
The improved APSIM Next Gen model for predicting cultivar phenology
The APSIM Next Gen model is currently being parameterised using the controlled environment data and then validated against observations of heading date from the field experiments. Incremental improvements to the phenology routine and investigations into sources of error are underway, with promising results. To date, the APSIM Next Gen model has been improved with the addition of two new development stages related to vernalisation saturation and heading, the development of a new phyllocron model and the inclusion of short-day vernalisation.

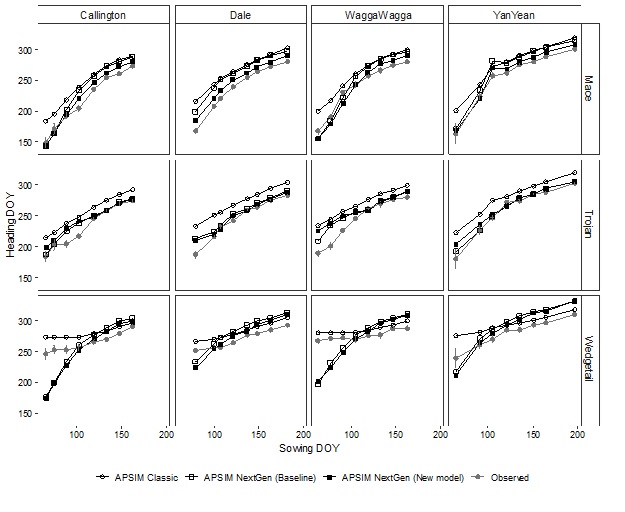
Figure 2. Comparison of ability of APSIM Classic 7.10, APSIM Next Gen (baseline) and APSIM Next Gen (new model) to simulate field observations of phenology. DOY is day of year.
Figure 2 shows the comparison of simulated and observed heading dates for Mace, Trojan and Wedgetail at the four field sites in 2019. The simulated heading dates were modelled using APSIM Classic 7.10, the baseline APSIM Next Gen, and the new APSIM Next Gen model with improvements made using NPI data. In most cases the new APSIM Next Gen model had the most accurate prediction of heading dates. The poor performance of Wedgetail at early times of sowing is suspected to be due to mis-simulation of devernalisation (when vernalised plants experience warm temperatures, resulting in a delay in heading). The modelling team are in the process of improving this aspect of model performance.
New cultivar phenology classification scheme
One of the additional outputs from the NPI is the development of an objective and nationally consistent cultivar phenology classification scheme being developed in collaboration with the Australian Crop Breeders. Until the new NPI tool for predicting phenology is available on the NVT website, these classifications are still important because they help growers make decisions around time of sowing. However, the terminology used to describe cultivar maturity or development speed is not consistent across states (e.g., ‘early maturing’, ‘fast maturing’, ‘short maturity’) and the classifications are subjective. In addition, the relative time to heading changes with environment and time of sowing which makes assigning classifications difficult.
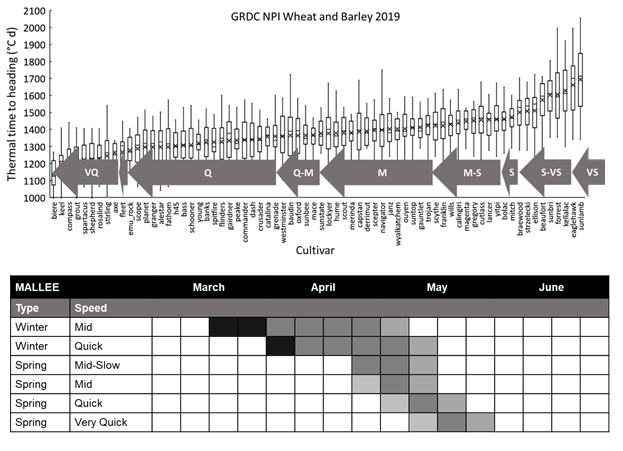
Using data from the 2019 NPI field validation experiments (five times of sowing from four field sites in SA, Vic, NSW and WA), cultivars were classified based on their degree days to heading (Figure 3). Wheat and barley cultivars in each environment were ranked according to their relative time to heading and then assigned to phenology groups ranging from ‘very quick’ to ‘very slow’. For each classification an exemplar or type cultivar was selected from the middle of the range.
This new phenology classification scheme is being developed in collaboration with the Australian Crop Breeders’ Industry Guide for Wheat Variety Maturity Description (ACB, 2021) and both resources have been used to inform the 2021 GRDC Crop Sowing Guides for South Australia and Victoria (GRDC, 2021). The scheme will be further refined in 2021 using field data from 2020.

Figure 3. The new cultivar phenology classification scheme ranks cultivars according to thermal time to heading using data from four field sites in SA, VIC, NSW and WA and five times of sowing from mid-April to mid-June. Cultivars can then be assigned into a phenology class using the Australian Crop Breeders maturity guide. This information can then be used to give regional sowing time information as per the annual GRDC Crop Sowing Guides.
New scale of cereal development
The second additional output from the NPI is the production of a new scale of cereal development. Existing scales of crop development like Zadoks’ decimal code (Zadoks et al. 1974) tend to be ambiguous, subjective, qualitative and non-repeatable. While these scales are useful for describing the development state of an individual plant at a given point in time, they are not designed for identifying the timing of key development stages in a population of plants. For the NPI it was necessary to develop a new scale of cereal development to ensure that data collection was consistent across different experiments, years and operators; to accurately determine the timing of key development stages, and so that data could integrate with the APSIM Next Gen model.
The new scale of cereal development has clear protocols for objective, quantitative assessment of each stage that were developed and tested using different operators in the geographically distant NPI field experiments. It identifies the median timing of key development stages; for the NPI, these were the dates of emergence and heading for each cultivar × time of sowing × environment. The scale can be applied to any population of culms. For example, in this new scale of cereal development, ‘heading date’ in wheat is defined as the date on which 50% of a population of culms have completed heading, with the spike fully emerged. To assess this accurately a fixed population of culms needs to be identified on which regular, repeated assessments are performed so that the population median timing can be identified.
The new development scale is currently being finalised with co-authors and will be submitted for publication this year.
Conclusion
By 2022 the NPI will deliver a tool for growers and advisors that will be able to accurately predict optimal sowing dates for different cultivars across Australia at the point of release. This will allow growers to more readily achieve optimal sowing dates and maximise yields. Underpinning this tool will be an improved APSIM Next Gen model that has been parameterised with controlled environment phenotypic data and genetic data and validated against national time of sowing field experiments. The NPI is also working to develop a new cultivar phenology classification scheme and scale of cereal development that are quantitative and objective.
Acknowledgements
The research undertaken as part of this project is made possible by the significant contributions of growers through both trial cooperation and the support of the GRDC, and the authors would like to thank them for their continued support.
Useful resources
Groundcover April 2020 “Optimal sowing times for wheat and barley cultivars may soon be at our fingertips”
See National Phenology Initiative to quantify optimal sowing times for wheat and barley
References
ACB (2021) An Industry Guide for Wheat Variety Maturity Description. Available at Australian Crop Breeders
Flohr BM, Hunt JR, Kirkegaard JA, Evans JR (2017) Water and temperature stress define the optimal flowering period for wheat in south-eastern Australia. Field Crops Research 209, 108–119.
GRDC (2021) 2021Crop Variety Guides. Available at Crop Variety Guides
Holzworth D, Huth NI, Fainges J, Brown H, Zurcher E, Cichota R, Verrall S, Herrmann NI, Zheng B, Snow V (2018) APSIM Next Generation: Overcoming challenges in modernising a farming systems model. Environmental Modelling and Software 103, 43–51.
Keating BA, Carberry PS, Hammer GL, Probert ME, Robertson MJ, Holzworth D, Huth NI, Hargreaves JNG, Meinke H, Hochman Z, McLean G, Verburg K, Snow V, Dimes JP, Silburn M, Wang E, Brown S, Bristow KL, Asseng S, Chapman S, McCown RL, Freebairn DM, Smith CJ (2003) An overview of APSIM, a model designed for farming systems simulation. European Journal of Agronomy 18, 267–288.
Zadoks, J.C., Chang, T.T., Konzak, C.F., 1974. A decimal code for the growth stages of cereals. Weed Research 14, 415–421.
Contact details
Dr Corinne Celestina
La Trobe University
c.celestina@latrobe.edu.au
@c_celestina
Varieties displaying this symbol beside them are protected under the Plant Breeders Rights Act 1994
