Within-paddock variability of subsurface pH in southern NSW – its relationship to surface soil properties (pH, buffering capacity) and implications for decision making
Within-paddock variability of subsurface pH in southern NSW – its relationship to surface soil properties (pH, buffering capacity) and implications for decision making
Author: Eva Moffitt (EM Ag Consulting) | Date: 16 Feb 2021
Take home messages
- Within-paddock soil pH varied substantially across both surface and subsurface layers however the spatial patterns of 0-10 cm and 10-15 cm pH variability did not necessarily correlate well, particularly where lime was surface applied and not incorporated
- 0-10 cm Cation Exchange Capacity (CEC) correlated more strongly with subsurface (10-15 cm) pH across the whole dataset and in more individual paddocks than 0-10 cm pH, 0-10 cm texture or EM38
- Regardless of surface soil (0-10 cm) pH:
- Paddocks or soil zones with 0-10 cm CEC values less than ~10-12 cmol/kg (i.e., sands, loamy sands, loams) generally possessed acidic subsurface layers of varying severity unless consistent liming AND incorporation had occurred
- Paddocks or soil zones with 0-10 cm CEC values greater than ~12-14 cmol/kg (i.e. clays, clay loams, some silty loams) generally did not have severe or yield constraining subsurface acidity - Liming recommendations should not be made using 0-10 cm data alone. Deeper, segmented soil testing (e.g. 0-5 cm, 5-10 cm, 10-15 cm, 15-20 cm) should be used to assess subsurface pH and pH stratification levels. These samples should be strategically located to cover the major ‘soil type’ zones present within a paddock. 0-10 cm grid pH/CEC mapping is one tool which can be used to map surface soil pH patterns and concurrently develop such ‘soil type’ zones
- In many paddocks, high rate ‘catch up’ lime applications will be required to provide enough alkalinity to ameliorate both the surface and subsurface layers. It is critical that these applications are incorporated to bring lime into physical contact with acidic soils.
Background
A recent focus on the prevalence and severity of subsurface acidity in southern NSW has highlighted that current minimum tillage practices including lime top-dressing without incorporation are failing to prevent soil acidification occurring throughout the profile, particularly at 5-15 cm. These results have also highlighted the potential masking effect of traditional 0-10 cm and 10-20 cm soil sampling practices. To negate this effect, it is now recommended that pH sampling be undertaken in finer segmented intervals, such as 0-5 cm, 5-10 cm, 10-15 cm, and 15-20 cm (Scott et al., 2017; Burns and Norton, 2018; Condon et al., 2020).
Also, within the past few years, a growing understanding of the level of within-paddock pH variability common to our region has led to the increasing uptake of site-specific (variable rate) liming practices. While a number of methods have been utilised, 0-10 cm grid soil mapping has emerged as the most readily implementable, commercially scalable method to capture the combined effect of both inherent (natural) soil type variability and the influences of historical management on surface pH. While automated soil sampling equipment has made this approach feasible in a single depth interval (e.g. 0-10 cm), the current lack of such a solution for segmented soil sampling renders this approach cost-inhibitive for finer interval sampling.
This presents a considerable problem for growers and advisors as they attempt to accurately measure soil pH variability within their paddocks in both a lateral and vertical sense to devise targeted, effective lime application maps. To overcome this problem, substantially more knowledge is required regarding the level of spatial variability of pH in the subsurface and factors driving such variability. If these factors can be understood, they may be utilised to guide the strategic placement of segmented soil tests and/or to create proxy maps of subsurface pH.
Methodology
Eighteen growers in southern NSW each selected approximately 150 ha of broadacre cropping and/or pasture area to be included in the survey, constituting 42 individual paddocks and a total area of 2,692 ha (Figure 1). There was no emphasis on selecting paddocks at a particular stage of the liming rotation or paddocks considered to be acidic. Paddocks spanned the numerous soil types present within the region and across medium to high rainfall zones. The majority of paddocks had received reasonable historic lime inputs in line with industry recommendations, with most recent applications (after 2000) being top-dressed only (not incorporated). No paddocks had been limed in the past two years or undergone variable rate liming, however many paddocks were comprised of amalgamated former paddocks that had been limed separately in the past.
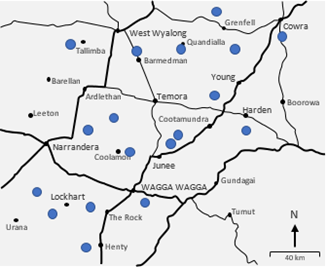 Figure 1. Location of the 18 grower participants and 42 paddocks included in the survey.
Data collection was undertaken during the summer of 2019/20 in two rounds. The first round consisted of apparent Electrical Conductivity (ECa; via EM38) and elevation surveying, followed by surface soil (0-10 cm) pH (CaCl2), Cation Exchange Capacity (CEC) and MIR texture grid mapping at 2 ha resolution. Approximately 20 locations per grower site were selected from the grid soil mapping sampling points for follow up strategic soil sampling at 0-5 cm, 5-10 cm, 10-15 cm, and 15-20 cm intervals. Locations were chosen to span the range of ECa, pH, CEC and MIR texture values within each paddock. A total of 360 segmented soil samples were collected across the 42 paddocks and analysed for pH (CaCl2), CEC, exchangeable aluminium and acidity, organic carbon and MIR particle size analysis (sand/silt/clay percentages).
Results and discussion
Description of dataset
Across all paddocks, the average grid mapped 0-10 cm pHCa was 5.16, with individual paddock averages ranging from 4.60 to 6.48. Eighteen paddocks (43%) had an average pHCa of ≥ 5.2 at 0-10 cm, half (21 paddocks) averaged between 4.8 – 5.2 while three paddocks (7%) averaged < 4.8.
The average within-paddock pH range was similar at both 0-10 cm and 10-15 cm depths (1.23 pH units and 1.28 pH units respectively), suggesting the magnitude of lateral spatial pH variability within the surface and subsurface layers is comparable.
Substantial pH stratification and subsurface acidity was observed across many sites when sampled in 5 cm intervals (Figure 2). As a whole dataset, the most alkaline layer was at 0-5 cm (average 5.38 pHCa), dropping to 4.87 pHCa at 5-10 cm. pH levels were most acidic at 10-15 cm (average 4.83 pHCa), where 33% of samples were < 4.5 pHCa and 29% of samples had > 5% exchangeable aluminium. Almost three-quarters of samples (73%) were more acidic at 10-15 cm than their corresponding 0-10 cm grid sample. The majority of samples (87%) increased in pH from 10-15 cm to 15-20 cm depth, where the average pHCa was 5.19.
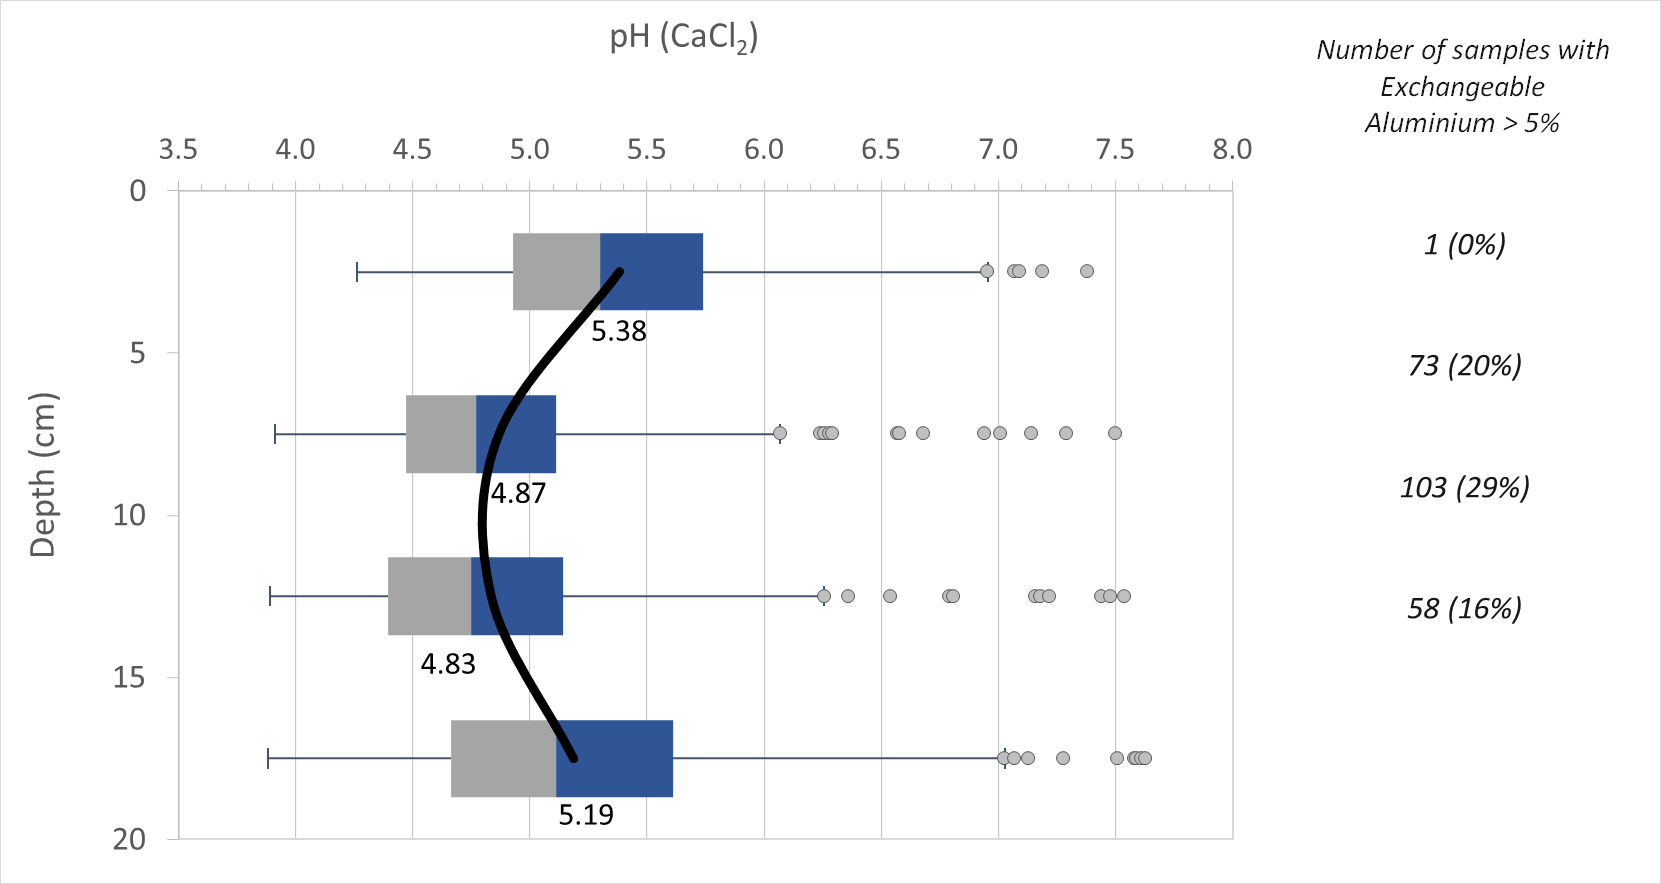 Figure 2. Box and whisker plot for all strategic segmented sampling results (0-5 cm, 5-10 cm, 10-15 cm, 15-20 cm; n = 359). Boxed area represents the middle 50% of data (interquartile range). Heavy black line and data labels are averages at each depth. Dots are outliers beyond 1.5x IQR.
While there was considerable variation within paddocks, examining results grouped by individual growers revealed a number of trends related to historic management (Figure 3). The largest cohort of similar results consisted of paddocks that have had moderate to high, predominantly unincorporated, lime inputs. These sites (e.g., Wagga Wagga, Marrar, Henty) typically displayed a sharp decline in pH between the 0-5 cm to 5-10 cm layers and moderate to high levels of subsurface acidity. For example, Figure 3a located at Marrar (loam; av. 0-10 cm CEC 7.0 cmol/kg) has a total lime history of 6.7 t/ha from 1991-2014 with no physical incorporation. Average pHCa levels at this site were 5.81 (0-5 cm), 4.57 (5-10 cm), 4.29 (10-15 cm) and 4.61 (15-20 cm). It is worth noting that the average 0-10 cm grid pHCa at this site was 5.35, highlighting the masking effect of traditional 0-10 cm sampling.
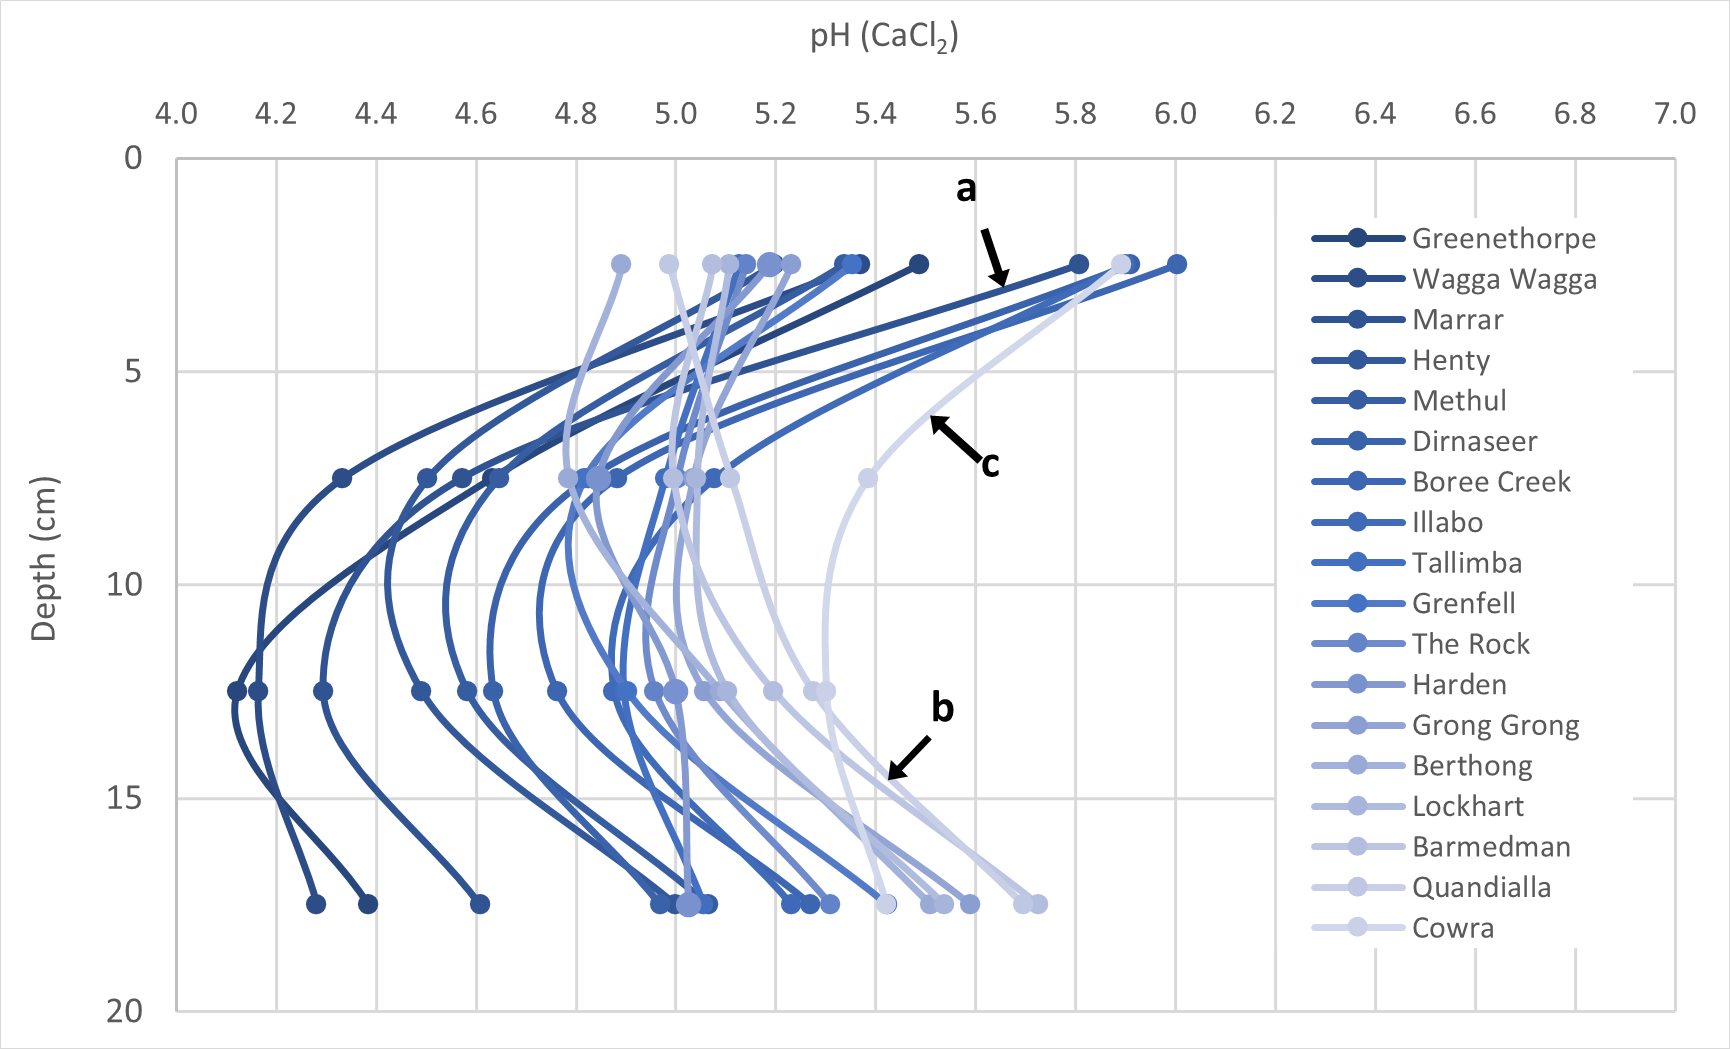 Figure 3. pH profiles to 20 cm depth for each of the 18 growers included in the survey (coded by location of grower). Profiles are averages of all strategic samples taken at each site (n = 17 – 23). Legend is in order of increasing pH at 10-15 cm, where dark = most acidic and light = most alkaline. Arrows point to a) Marrar, b) Quandialla and c) Cowra sites.
A second cohort of results came from sites located on more clay-rich, naturally alkaline soils (e.g., Quandialla, Barmedman, Lockhart) which had mostly received no or low lime inputs owing to their higher starting pH levels (i.e., being on soil types not typically considered acidic). These paddocks generally had lower than average pH levels at 0-5 cm however were consistently more neutral to alkaline in the subsurface layers. For example, at the Quandialla site (Figure 3b; av. 0-10 cm CEC 15.2 cmol/kg), average pHCa values were 4.99 (0-5 cm), 5.11 (5-10 cm), 5.27 (10-15 cm) and 5.70 (15-20 cm).
Paddocks not fitting into either of the above groups consisted of sites where growers had implemented some form of liming plus incorporation within the past decade. Here, results were highly variable depending on the commencement date, rates and regularity of liming. Of these paddocks, the Cowra site (silty loam/loamy sand; av. 0-10 cm CEC 7.8 cmol/kg) had the most robust liming and incorporation history (between 5 to 7.7 t/ha total since 1994, incorporated to 10 cm depth). This was reflected in the results through much less severe pH stratification and subsurface acidity when compared to most other sites (average pHCa = 5.89 at 0-5 cm, 5.39 at 5-10 cm, 5.30 at 10-15 cm and 5.42 at 15-20 cm; Figure 3c).
Relationship between surface and subsurface layers
Across the whole dataset, a weak correlation was found between surface (0-10 cm) and subsurface (10-15 cm) soil pH (r2 = 0.18). Of particular note, results demonstrated that highly acidic (< 4.5) pHCa levels and elevated exchangeable aluminium percentages can still be present in subsurface layers where the corresponding 0-10 cm sample is neutral or alkaline (i.e., > 5.5 pHCa; Figure 4a, 4c).
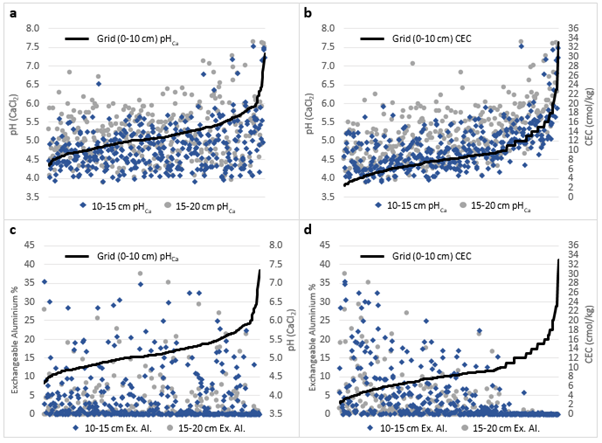
Figure 4. 10-15 cm (♦) and 15-20 cm (●) pH (top) and Exchangeable Aluminium percentages (bottom) plotted against their corresponding 0-10 cm pHCa (left) and Cation Exchange Capacity (right) as collected by grid soil mapping. Data has been arranged in order of increasing 0-10 cm pH (a,c) and CEC (b,d).
The poor nature of this relationship appears to be strongly driven by the shallow surface layer (0-5 cm pH vs. 10-15 cm pH r2 = 0.06) rather than the 5-10 cm segment, which correlated strongly with 10-15 cm pH (r2 = 0.75). This supports the notion that surface applied, unincorporated lime applications are having very little influence on soil pH below 5 cm depth.
Of the various other data layers examined (0-10 cm grid CEC, 0-10 cm texture, EM38); subsurface (10-15 cm) pH correlated most strongly with 0-10 cm grid CEC (r2 = 0.47). Figure 4b and 4d show:
- For soils or soil zones with 0-10 cm CEC levels less than ~10-12 cmol/kg (i.e. sands, loamy sands, loams), subsurface pH levels ranged from neutral to highly acidic. Individual results appear to be related to liming and incorporation histories
- For soils or soil zones with 0-10 cm CEC levels greater than ~12-14 cmol/kg (i.e. clays, clay loams), no severe acidity or elevated exchangeable aluminium levels were observed in the subsurface layers. This observation can be explained by the longer period of time required to acidify soils of higher buffering capacities given the same management, therefore it is expected that this ‘threshold’ CEC value will increase over time.
These trends are also reflected when strategic soil sampling data is grouped according to surface soil CEC and soil textural classes (Figure 5). Although substantial variability due to contrasting management histories is encompassed within the dataset, there is a reasonably consistent trend below 5 cm depth of decreasing pH (more severe acidity) with lower CEC and clay concentrations.
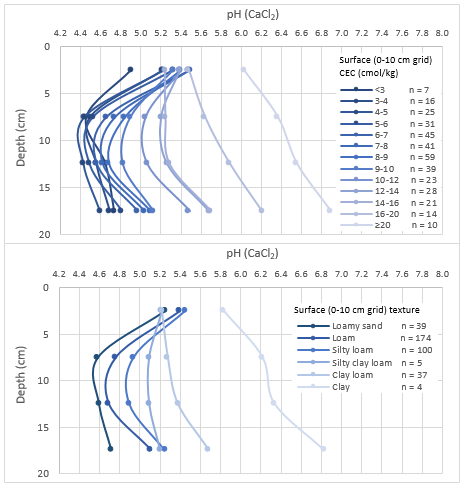
Figure 5. Average pH profiles to 20 cm depth for strategic samples (n = 359) of varying 0-10 cm Cation Exchange Capacity (top) and soil texture (bottom; as per Australian Soil Classification system from MIR Particle Size Analysis data). Note: Averages for samples < 4 cmol/kg were heavily influenced by one location where incorporated lime applications appear to have increased the subsurface pH.
On an individual paddock level, 0-10 cm grid CEC also correlated most strongly with subsurface (10-15 cm) pH for the largest number of paddocks compared to any other layer (followed by grid pH, grid clay%, grid sand%, ECa 0.5 m and ECa 1.0 m).
Correlations between surface pH (0-10 cm grid) and subsurface pH (10-15 cm) were substantially stronger in paddocks with nil or low lime histories (e.g., Case Study 1 (Figure 6)), compared to paddocks where lime had been surface applied without incorporation (particularly within the past five years; e.g., Case Study 2 (Figure 7)).
Correlations between subsurface pH and all 0-10 cm layers were also generally strongest in paddocks with higher degrees of inherent (‘natural’) soil type variability, such as those with surface (0-10 cm) CEC values spanning a range of greater than 5 cmol/kg. Paddocks with more consistent soil types (particularly those on lower CEC soils) could still possess quite variable subsurface pH levels, however their spatial patterns were often erratic and difficult to predict.
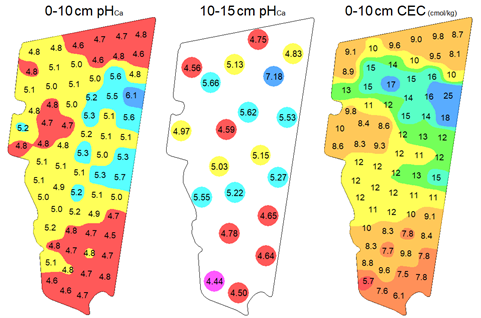
Figure 6 (Case Study 1). ‘Lockhart’ paddock (143 ha) has a high degree of natural variability in CEC and soil texture (red loam to grey clay). The paddock has never been limed owing to a relatively high starting pH typical of the area. Subsurface acidity (10-15 cm pH) correlates reasonably well with both surface CEC (r2 = 0.62) and pH (r2 = 0.56) as mapped by 0-10 cm grid sampling. A zone-based VR strategy could be considered to raise the subsurface pHCa to 5.2 in areas where the 0-10 cm CEC is less than ~10-12 cmol/kg. This would be applied in addition to the lime required to raise the topsoil pHCa to 5.5, which would need to be incorporated to be effective.
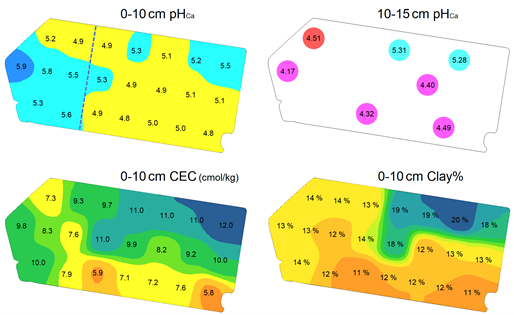
Figure 7 (Case Study 2). ‘Henty 3’ paddock (48 ha) consists of two former paddocks (dashed line) where the western (left) side received 2.9 t/ha lime in 2017 versus 1.2 t/ha on the eastern (right) side (neither incorporated). Subsurface (10-15 cm) pH correlates well with 0-10 cm CEC (r2 = 0.50) and clay% (r2 = 0.88) however there is no correlation whatsoever with 0-10 cm pH (r2 < 0.01). The higher clay zone in the north-eastern corner has a relatively high subsurface pH compared to the remainder of the paddock, despite contrasting surface soil pH trends driven by recent liming, which has not moved beyond 5 cm depth. This example highlights the potential danger of using 0-10 cm data in isolation to develop site-specific liming plans.
Management implications
The results of this survey strongly echo other recent studies which have highlighted that standard 0-10 cm sampling is not identifying the widespread pH stratification and acidification of subsurface layers in our region. The level and extent of acidification identified at 5-10 cm and 10-15 cm in the present study suggests that significant ‘catch-up’ lime rates above traditional rates combined with incorporation are now required in many paddocks.
The poor correlation observed between surface (0-10 cm) and subsurface (10-15 cm) pH appears to be the result of contrasting key influencers on soil pH at different depths in minimum tillage systems. In particular, top-dressed lime applications have the potential to greatly alter surface pH patterns, such as in paddocks with varying soil buffering capacities or where historic lime inputs have not been consistent (e.g., across old fencelines). With poor penetration of alkalinity past the top few centimetres of soil, it follows that subsurface pH patterns may more closely align with soil buffering capacity than surface pH patterns.
These findings demonstrate that surface pH patterns (e.g. 0-10 cm grid or zoned sampling) cannot be used in isolation to manage soil acidification throughout the full profile (except perhaps on consistently high CEC soils). Rather, it is suggested that targeted segmented sampling (e.g., 0-5 cm, 5-10 cm, 10-15 cm, 15-20 cm) be used to examine the major ‘soil type’ zones within a paddock. This could be achieved using 0-10 cm grid soil pH/CEC mapping as an initial round of data collection to concurrently map surface pH and develop such ‘soil type’ zones. Liming rates could then be formulated using a number of approaches; each requiring the lime to be well incorporated into the soil profile:
- Calculate lime rates for 0-10 cm targeting a pHCa of 5.5, plus add additional requirements for the 10-20 cm layer. If subsurface pH varied in a predictable manner corresponding with CEC/soil type zones, 10-20 cm lime inputs could be adjusted accordingly. This approach is likely most suitable for paddocks possessing a higher level of natural variability (i.e., 0-10 cm CEC levels varying by > 5 cmol/kg). If subsurface pH patterns do not vary in a predictable manner, blanket lime rates to ameliorate the 10-20 cm layer would be more appropriate.
- Alternatively, a simpler approach of targeting a higher 0-10 cm pHCa (e.g. 5.8 – 6.0) may be suitable in certain situations, however segmented soil sampling to 20 cm should still be undertaken to gain a complete picture of the soil pH profile.
While the resultant lime rates for either approach are likely to be much higher than traditional maintenance rates, it is important that additional product is added on top of that which will be ‘used up’ neutralising the surface soil. Given the expense of cultivation and preference for minimum tillage management, it is also logical to use higher rates to prolong the period between strategic tillage events.
Concluding comment
The overall findings of this survey have demonstrated that there is currently no single ‘one size fits all’ solution to accurately measuring and managing vertical and lateral within-paddock pH variability. Rather, a high level of skilled advisor and/or grower input is required for best outcomes, taking into consideration the unique soil type and management history factors of each paddock. This is an area that would greatly benefit from an engineering/technology solution that integrated cost-effective three-dimensional data collection and interpretation methods.
References
Burns H.M. and Norton M.R. (2018) Subsurface acidity threatens central and southern NSW cropping areas. In: Proceedings National Soil Science Conference, Canberra, 2018.
Condon J., Burns H.M. and Li G.D. (2020) The extent, significance and amelioration of subsurface acidity in southern New South Wales, Australia. Soil Research. CSIRO Publishing.
Scott B.J., Conyers M.K., Burns H.M., Evans C.M. and Fettell N.A. (2017) Stratification of acidity in the shallow soil surface - experiences in the cropping areas of southern and central NSW. In: Proceedings of the 18th Australian Agronomy Conference, Ballarat, Australia.
Acknowledgements
This project was undertaken in partnership between FarmLink Research and Precision Agriculture. It was supported by the Department of Agriculture, Water and the Environment through funding from the Australian Government’s National Landcare Program.Research was further supported by Charles Sturt University where the author holds an Adjunct Research Fellow position.
The contribution of the 18 growers participating in this project is greatly appreciated. Thank you to Dr Kirsten Barlow (Precision Agriculture) for input and conversations regarding results and review of reports. Thanks also to Dr Jason Condon (NSW DPI and CSU) and Helen Burns (NSW DPI) who reviewed a previous version of the report. The support of APAL agricultural laboratory who generously provided MIR Particle Size Analysis in-kind for this project is appreciated.
Contact details
Eva Moffitt
EM Ag Consulting
Barmedman, NSW 2668
Ph: 0437 189025
Email: eva.moffitt@outlook.com
