Chickpea yield gaps – how much yield potential could we be losing in a dry season, and why?
Chickpea yield gaps – how much yield potential could we be losing in a dry season, and why?
Take home messages
- Chickpea yield gaps tend to be larger than for cereal and canola crops
- Average chickpea yields between 1996 and 2015 for growers in the GRDC northern region (1.05 t/ha) are 1.6 t/ha below the water-limited yield potential. On average, this is costing growers $806/ha
- Average chickpea yields between 1996 and 2015 for growers in the GRDC southern region (0.82 t/ha) are 2.38 t/ha below the water-limited yield potential. On average, this is costing growers $1,200/ha
- Alternative management (narrower rows, higher plant populations and earlier sowing) was predicted to increase grain yield by 0.4 t/ha on average across monitored fields in 2019
- Preliminary recommendations are made for optimum sowing date at a range of representative locations across northern NSW.
Introduction
The yield gap is the difference between the actual yield achieved by the average grower and the water limited yield potential (Figure 1). The water-limited potential is defined as the maximum possible yield able to be grown with the optimal sowing date, current cultivars and with nutrients, pests, disease and weeds not limiting yield. Historically, yield gaps are calculated after the actual yield is observed, and potential yield is calculated using a crop growth model. When crops are grown in response to a variable climate such as that of the Australian grain zone, a period of 15 years is required to reliably capture the variability of year to year weather and hence of the extent of yield gaps in each year. Previous studies have shown that, over a wide range of seasonal conditions, well managed commercial wheat crops can reach about 80% of their potential (van Rees et al., 2014). This yield level is called the exploitable yield (Figure 1).
It is well known that Australia’s grain growers are among the best in the world so how close are chickpea growers in the northern region to achieving their water-limited yield potential? How much does this vary from area to area?
An earlier GRDC-funded project (CAS00055) identified that rainfed crops in Australia achieved about half of their water-limited yield potential in 2000-2014. This was made up of 50% for wheat, 53% for canola, 40% for barley, 58% for sorghum and 39% for pulse crops (www.yieldgapaustralia.com).
As part of the GRDC funded ‘Pulse Adaptation’ project, we examined the latest data to see whether significant yield gaps still exist in chickpea, and if so, what might be causing them. Two types of yield gap analyses were conducted: one at a regional data scale (described below in part A), and the other at a single paddock scale (described in part B).
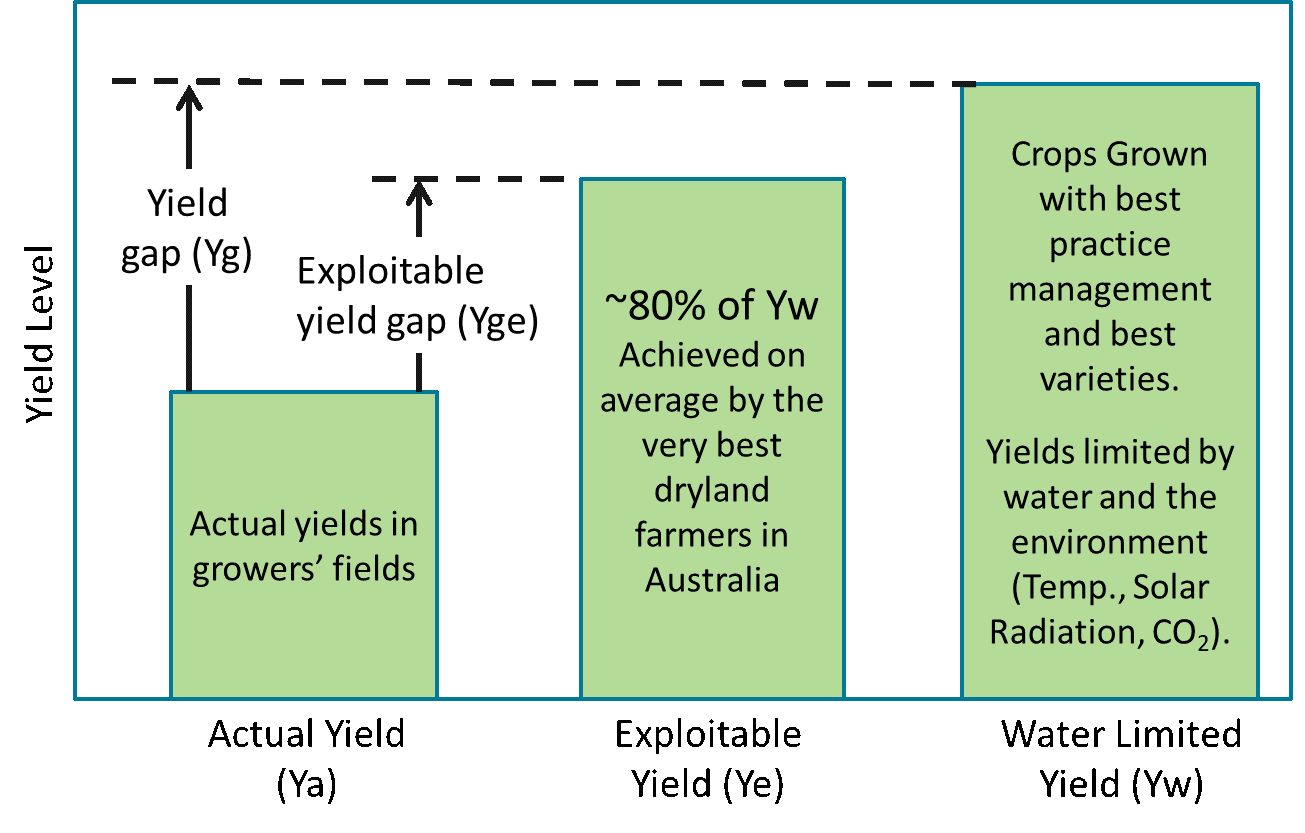 Figure 1. Actual yield, water-limited yield and exploitable yields (after Lobell et al. 2009)
A. Region scale yield gap analysis
What did we do?
For the regional analysis, we calculated the yield gap by subtracting average farm yields from the water-limited yield potential simulated with the APSIM crop growth model. Actual farm yields (Ya) were derived from the latest available ABS and ABARES sources at the statistical local area (SA2), which were averaged over the period from 1996 to 2015 to account for seasonal variability. Water-limited yield potential (Yw) is defined as the APSIM simulated yield of a crop for a given soil type using the rainfall and soil water available, but assuming that frost, diseases, pests and nutritional disorders have not affected yield.
Yw was simulated with the APSIM chickpea model for at least 5 years of the 20 year study period for the three dominant soil types within a 20 km radius of every weather station in each SA2 in the Australian cropping zone where actual yield data were available (Figure 2). All crops were simulated according to current best practice. Sowing windows varied by location: Central Queensland = 15 Apr – 7 Jun; SE Queensland and northern NSW = 15 May – 7 Jul; Victoria = 7 May – 7 Jul. For all regions a sowing opportunity required rain >= 15mm over 3 consecutive days during the sowing window. Sowing density was set at 30 plants/m2, row spacing at 500 mm, and sowing depth at 50 mm. Two varieties were simulated: HatTrick (mid-late) and Seamer (early) for each weather station x soil combination and the highest yielding variety (average 1996-2015) was chosen to represent Yw. Sowing soil water was determined by running a 15-year wheat/chickpea continuous crop simulation prior to each year used in the yield gap simulation. We then interpolated the Yw data from each station x soil combination to their SA2s to produce the Yw map at SA2 resolution to match all the SA2s in Figure 2. This enabled us to produce a chickpea water-limited yield potential map (Figure 3).
Yield gaps (Yg, the difference between water-limited chickpea yields and actual chickpea yields) were calculated for each SA2 to produce a chickpea yield gap map (Figure 4). Finally, because areas with larger water-limited yields tend to have larger yield gaps we are also interested in the yields achieved relative to their potential, we present the relative yield (Y%) achieved by growers (Figure 5.). This is calculated as: Y% = 100 x Ya/Yw
It is important to note that the confidence we have in calculating chickpea yield gaps is lower than for crops such a wheat and sorghum. This is due to some uncertainty about the reliability of actual farm data due to gaps in the ABS and ABARES data on farm yields and in uncertainty about the accuracy of the yield predictions of the APSIM chickpea crop module.
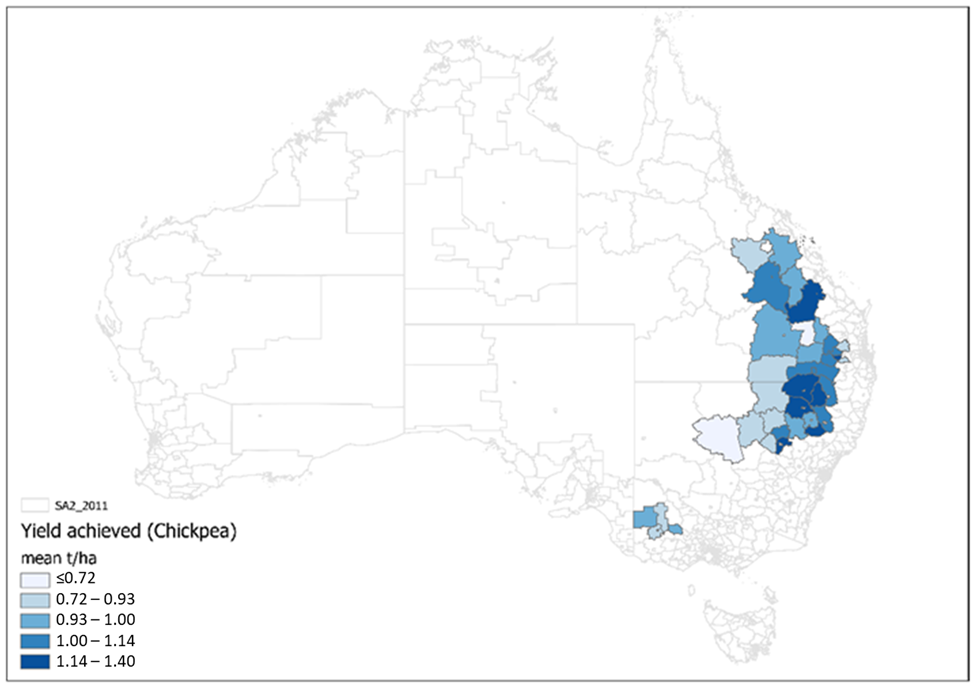
Figure 2. Actual chickpea yields (Ya) per statistical local area (SA2), averaged from 1996 to 2015.
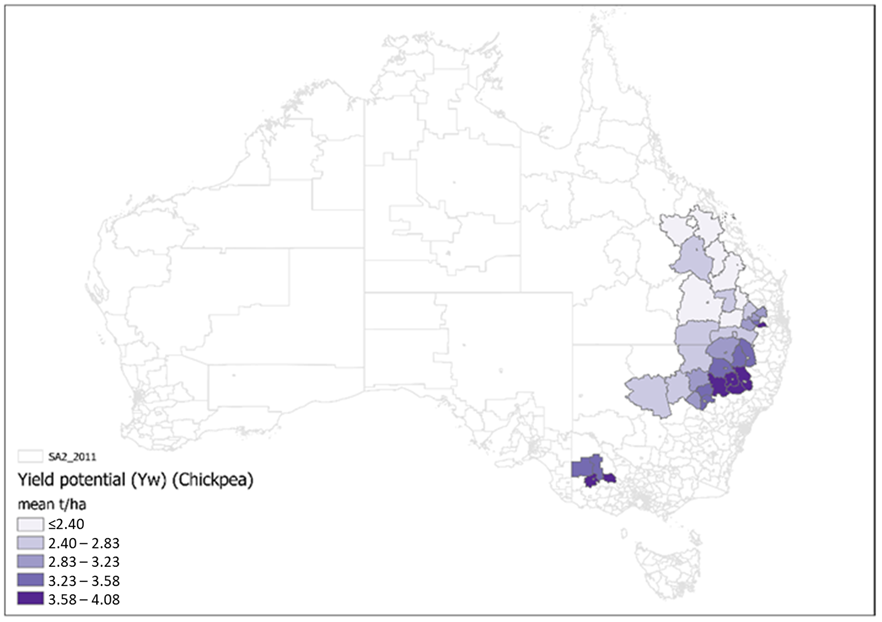
Figure 3. Simulated water-limited chickpea yields (Yw) per statistical local area (SA2), averaged from 1996 to 2015.
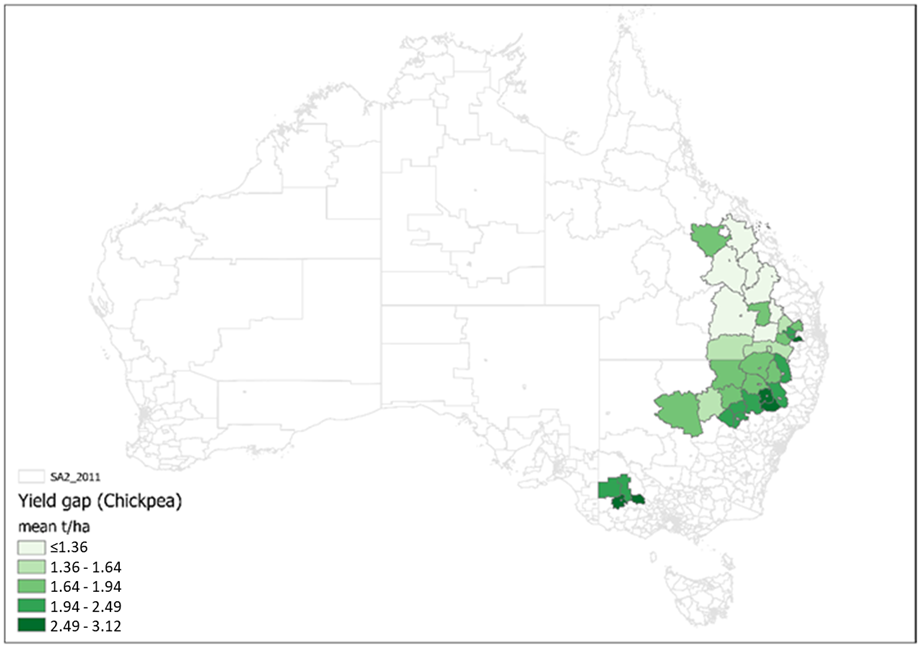 Figure 4. Chickpea yield gaps (Yg) per statistical local area (SA2), averaged from 1996 to 2015.
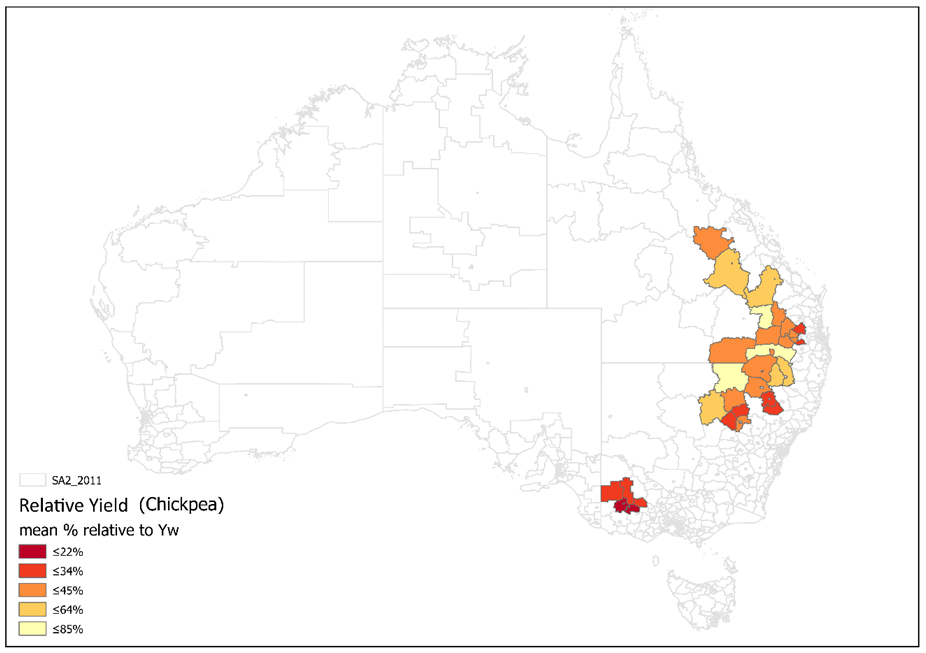 Figure 5. Chickpea relative yields (Y%) per statistical local area (SA2), averaged from 1996 to 2015.
What did we learn?
At a regional level, the northern region’s average actual yield (Ya) was 1.05 t/ha and water-limited potential yield (Yw) was 2.66 t/ha, leaving a yield gap (Yg) of 1.61 t/ha and achieving a relative yield (Y%) of 42%. For the southern region, Ya was 0.82 t/ha and Yw was 3.20 t/ha, leaving a Yg of 2.38 t/ha and achieving a Y% of 25%. Interestingly, the southern region with its higher average Yw had the bigger yield gaps and achieved lower relative yields. This is not an unusual observation, but it is one that prompts us to ask why there are such large yield gaps for chickpea.
B. Paddock scale yield gap analysis
What did we do?
We used APSIM and local paddock data to conduct a paddock scale yield gap analysis on farmer fields in 2019, to see if we could determine the causes of any yield gaps found in the regional scale analysis. For this analysis, soil water and nutrients were measured by taking soil cores from a representative section of each paddock at sowing and harvest. Growers’ paddock management data (e.g. row spacing, plant population, sowing date and depth) was also collected. This information was then used to conduct APSIM simulations of each field, in conjunction with local weather data. As with the regional scale analysis, APSIM was used to simulate yield that is attainable given growers’ management practices and considering water availability (both rainfall and stored soil moisture) and other environmental conditions (e.g. temperature and solar radiation) through the season. APSIM simulations did not include the effect of nutrient deficiencies or of other biotic stresses on yield. We therefore expect the difference between observed and simulated yields to reflect a combination of simulation error, measurement error, biotic stress, and nutrient deficiencies.
After assessing the gap between paddock yields and simulated yields, APSIM was used to conduct ‘what-if’ scenario analysis of alternative management options for each field. This involved changing the APSIM simulations to use narrower rows (250 or 350 mm for southern and northern districts respectively), higher plant populations (40 plants/m2) and earlier sowing (by up to 2 weeks where sowing had been delayed by rain). Simulated yield from the best ‘what-if’ scenario was compared to the originally simulated yield, to determine whether yield increases could be achieved by using these alternative agronomic practices.
What we found
When water availability is low, nutrient deficiency or diseases are unlikely to limit crop growth because water availability is the overriding limitation. In a dry year such as 2019, it was not surprising that on-farm yields of chickpea crops were generally close to simulated yields (Figure 6). On-farm yield in the monitored section of each paddock was usually within 300 kg/ha of the simulated yield, within the margin for error caused by variable soils across the monitoring transects. Out of the remaining six fields, three were only slightly outside the threshold and had some uncertainty about soil type and/or soil water at sowing below the sampling depth. However, the remaining three paddocks all had good levels of sowing soil water (110-150 mm) and may have been nutrient deficient (attainable yield gaps of 0.4, 0.6 and 1.3 t/ha). Two paddocks had low levels of P which would have been largely unavailable in the surface layer in a dry year. The other paddock had low sulphur levels with previous sulphur responses in canola and may also have been deficient in potassium because the soil type is naturally low in potassium, although this was not tested for this paddock.
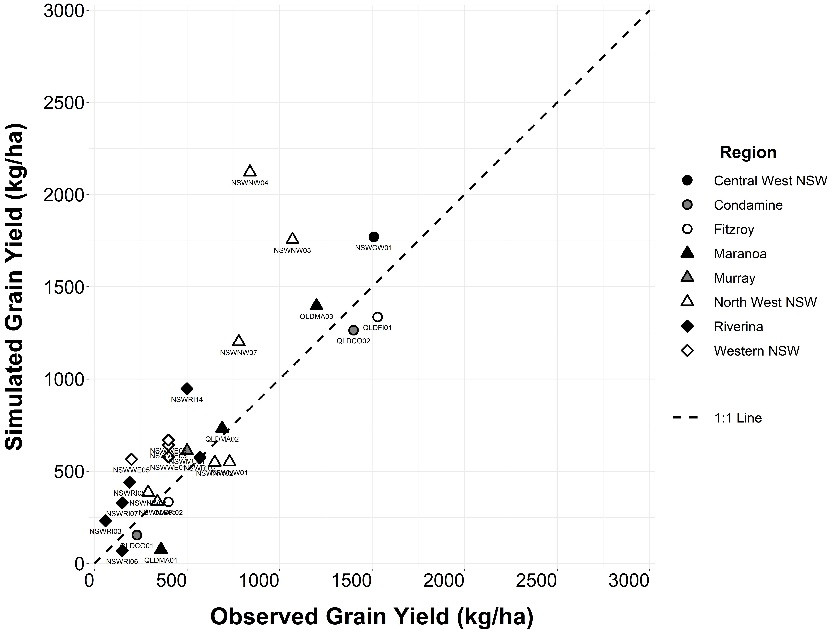 Figure 6. APSIM simulated vs measured yields for on-farm chickpea monitoring sites in 2019.
Although most paddocks did not appear to have significant nutrient deficiencies or disease problems, it is still possible that alternative agronomic practices may have led to yield gains in a below average rainfall season such as 2019. Our ‘what-if’ scenario analysis (Figure 7) showed that when using the predicted best management practices (i.e. optimum plant population, row spacing and sowing date) APSIM simulated grain yield was 0.4 t/ha higher on average across all the monitored fields. Paddocks with greater soil water at sowing showed the largest potential for improved yield, while extremely drought stressed fields gained little or no benefit from the alternative agronomic management. These simulated results should be tested further in field experiments.
One consideration yet to be resolved is whether increased plant populations should be used in combination with narrower row spacing, as changing both factors simultaneously may be necessary to realise the full yield benefit of either practice. An additional consideration is whether recently released chickpea cultivars can produce greater yield than older cultivars when sown early. Field trial data from our project shows that potential yield of chickpea can decline rapidly (up to 250 kg/ha per week that flowering is delayed (Figure8)), so ensuring chickpea crops flower at the optimum time is important for maximising grain yield.
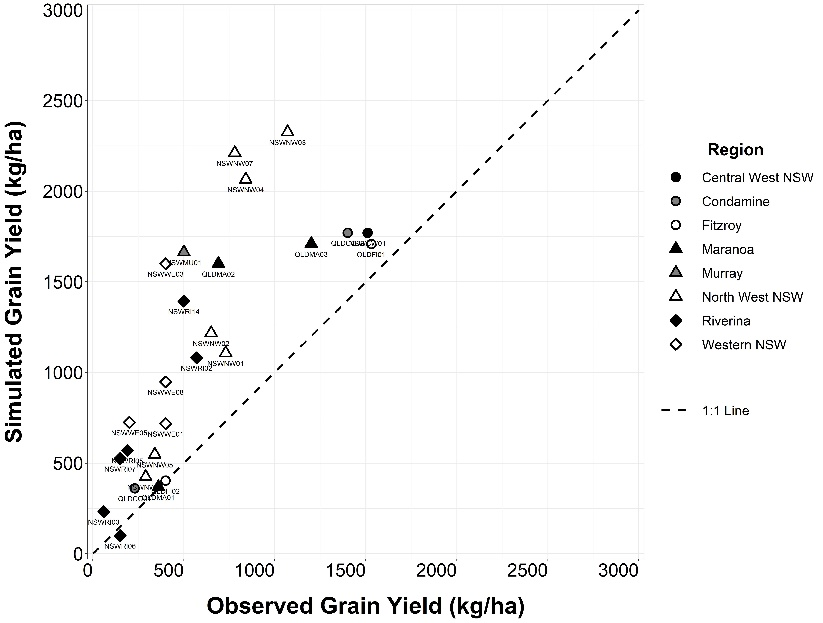 Figure 7. APSIM simulated vs measured grain yield for the best practice treatments discovered by ‘what-if’ scenario analysis of on-farm chickpea monitoring sites in 2019.
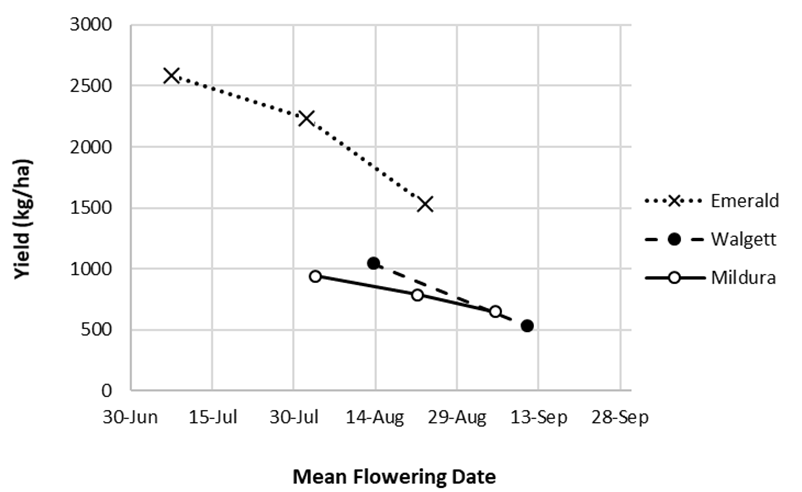 Figure 8. Average grain yield vs flowering date of 5 desi chickpea varieties from three ‘time-of-sowing’ field experiments conducted in 2019. Markers (cross or circles) represent average data generated from a single sowing date.
C. Determining optimum sowing date
What did we do?
A key aspect of addressing yield gaps is ensuring that crops are sown at a time that means they will flower when frost risk is declining but heat risk is still low. One of our project’s aims was to use APSIM to better understand when this ‘optimum flowering window’ occurs, and when should growers sow to achieve it. APSIM was therefore used to predict flowering date (measured as the date of appearance of the first flower on 50% of plants) and water-limited potential yield for the last 20 years (2000-2019), for a range of sowing dates (every fortnight from 1st March to 1st August) at 13 locations across the northern region, although we only present 6 from northern NSW in this paper. All simulations in northern NSW assumed that stored soil water on the 1st of March was 90 mm. Simulated row spacing was 40cm, sowing depth was 5cm and plant population was 30 plants/m2.
Frost and heat-stress risk assessments were conducted by examining daily minimum and maximum temperatures with the potential for frost/heat stress (below +2°C and above +30°C at the standard met-station height of 1.2m). Accumulated degrees below/above these thresholds for a given time period (e.g. last week in August) was compared with the time periods that recorded the most severe frost conditions at Breeza and the worst heat-stress conditions at Emerald over the entire year. This created an estimate of relative risk that could be used to compare different production environments in assessing the flowering and sowing dates needed to avoid extreme temperature events. A function was developed within APSIM to account for chilling sensitivity of chickpea that prevents pollination and causes flower abortion at mean daily temperatures below 15°C (Clarke and Siddique, 2004) and delays pod-set, so the emphasis herein is on the risk of intermittent frost events that may cause yield-limiting damage to floral structures and developing pods.
We prepared charts (Figure 9,10) to estimate the sowing dates needed to ensure flowering occurs in the optimum window where frost risk is acceptable and water-limited yield potential is still high. For ease of presentation we have presented results for a single cultivar (PBA HatTrick) which represents a medium maturity cultivar. If quicker/slower maturing cultivars are chosen, then sowing date should be adjusted to be slightly later or earlier to achieve the same flowering data. More data needs to be collected using the new phenology key (Whish et al., 2020) in order to better understand the comparative maturity of more chickpea cultivars across environments, but local knowledge can be used in the interim to decide whether cultivars will flower earlier or later than PBA HatTrick.
Interpreting the potential yield graphs
In these graphs the box and whisker plots have a small black line which indicates the median yield. The yield from 50% of years fall inside the box (i.e. yields from 10 years, with five years either side of the median yield), and the box whiskers represent 1.5 times the value of the adjacent quartile (i.e. between the median and the edge of the box), while grey dots represent outliers beyond this range.
Determining optimal sowing date
A shaded box is used to connect three-graph sets from the same location showing the predicted optimal time of flowering and pod initiation. The beginning of this ‘optimum flowering window’ is determined by assuming that the earliest flower needs to appear in the last week when relative frost risk is still above 20% (approximately one day with a minimum temperature of 0°C in the week), as additional experiments suggest that the most sensitive growth stage to stress possibly falls 100 degree days later than the appearance of the first flower (Dreccer et al., 2020). The end of the optimum flowering window is the point when relative heat risk of 20% is reached, or when 5 weeks have elapsed since the window opened. An arrow has been inserted in the week where average temperature increases above 15 degrees (and the risk of cool temperature flower abortion is reduced), to help demonstrate when pod-set is likely to begin. In the middle graph for each location it is possible to determine which sowing dates can be used to achieve the optimal flowering dates, by referring across to the y-axis.
Desi Chickpeas – NSW
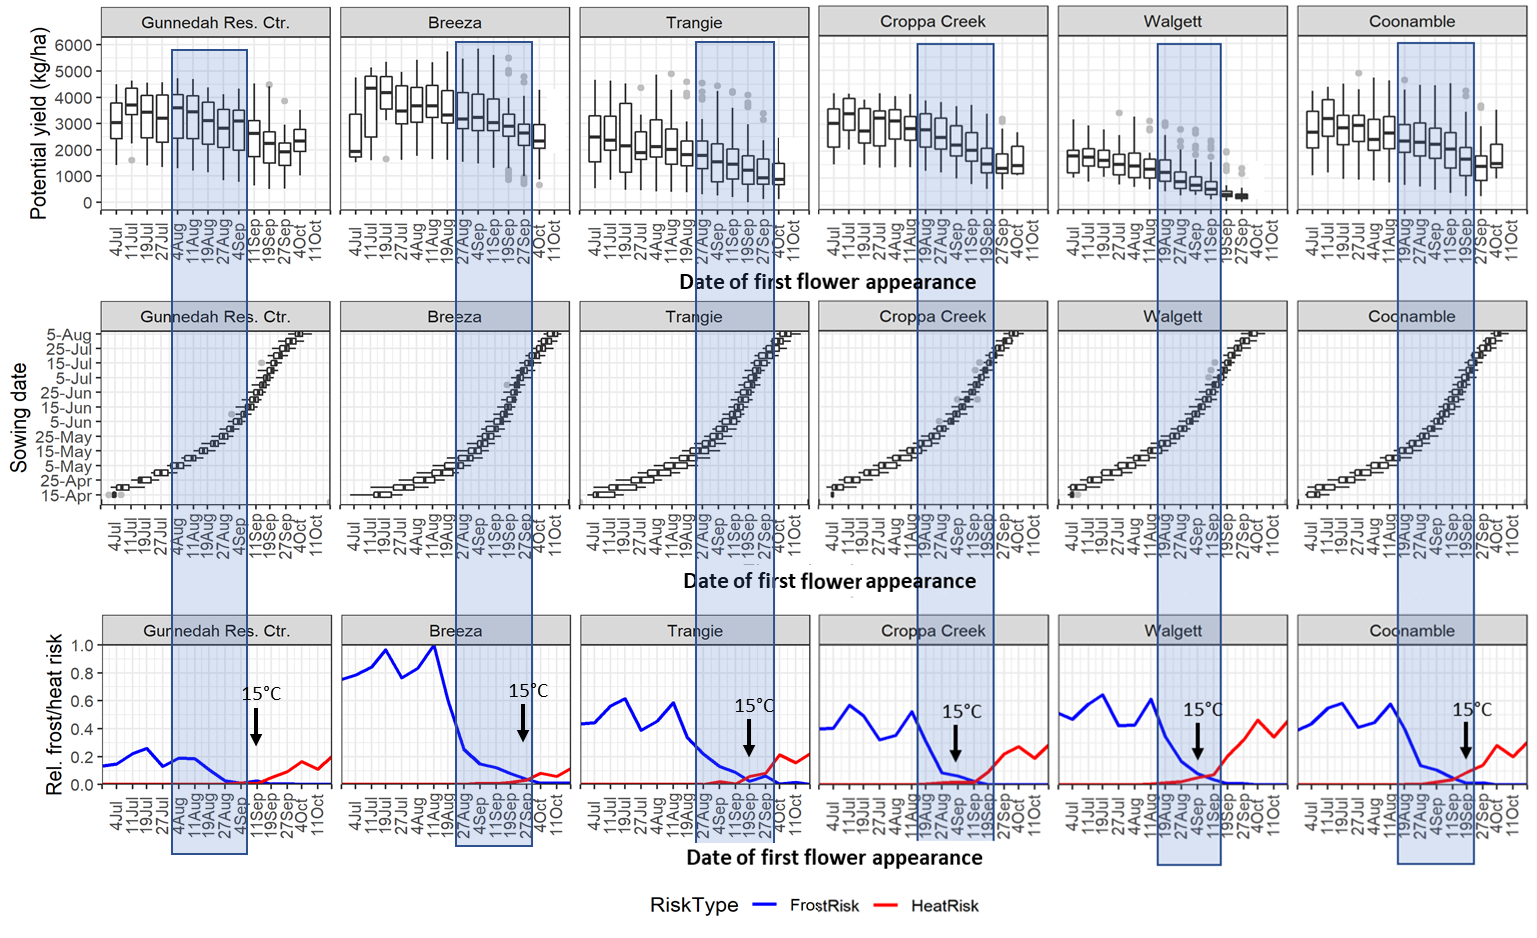 Figure 9. Water-limited yield potential, sowing date and relative frost/heat risk, plotted against the date of first flower appearance for PBA HatTrick at six locations in northern NSW. Shaded area represents the predicted optimum window for appearance of first flowers. Arrows and ‘15°C’ mark the first week that has an average daily temperature greater than 15°C in the second half of the year, i.e. when conditions become favourable for pod-set.
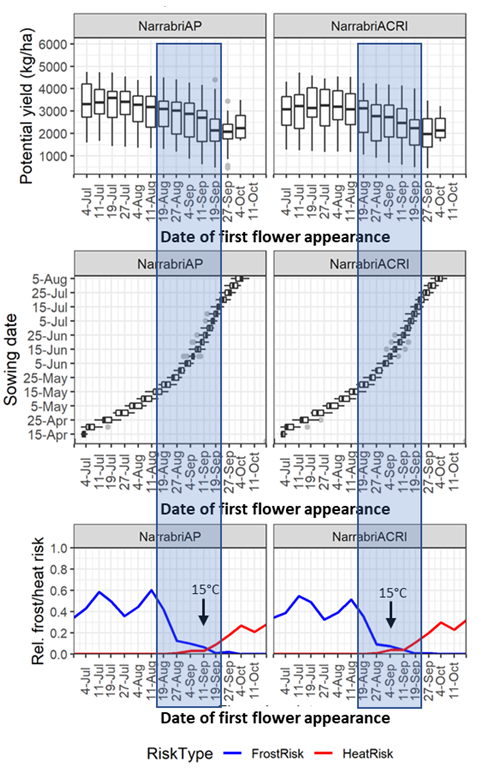
Figure 10. Water-limited yield potential, sowing date and relative frost/heat risk, plotted against the date of first flower appearance for PBA HatTrick at Narrabri Airport and the Australian Cotton Research Institute (ACRI). Shaded area represents the predicted optimum window for appearance of first flowers. Arrows and ‘15°C’ mark the first week that has an average daily temperature greater than 15°C in the second half of the year, i.e. when conditions become favourable for pod-set.
Trends and observations
Water-limited potential yield declines rapidly in spring with later sown crops, particularly in the more northern environments.
Within the optimum flowering window, yield declined up to 300 kg/ha per week that first flower appearance was delayed in the most extreme situations (e.g. Croppa Creek (Figure 9)). Although the model showed a tendency to over-predict grain yield on early sowing dates in some environments (Figure 11), yield was lower for later sowing dates in the field trials (Figure 8), where grain yield declined at between 60 and 225 kg/ha per week that appearance of the first flower was delayed, depending on location and time-of-sowing. While it can be difficult to determine if yield reductions are due to heat stress, water stress or simply the shorter growing season experienced by late sown crops, delayed flowering into warmer weather conditions reduced yield in the 2019 field trials and the simulations. Nevertheless, further model testing is necessary in different seasons to ensure that the model can successfully simulate different types of season (e.g. early stress followed by mid or late-season rainfall). In wet seasons delayed sowing may not have the same yield penalty, so further research is necessary to investigate the relationship between time of sowing and yield across a range of locations and seasons. It should also be remembered that simulations were prepared using 90mm of stored soil water prior to sowing. Water-limited yield potential will vary from that presented here if more/less water is available at sowing.
It is unclear whether ultra-early sowing could provide even greater yield advantages in a dry season
While most northern sites reached the 15°C threshold for pod set 2-3 weeks after the beginning of the optimum flowering window, the more southern sites had a larger gap (e.g. 5 weeks at Wagga and 9 weeks at Mildura: data not shown). While early sown crops may not set pods for many weeks after the first flower appears, the increased biomass development and/or root growth that occurs during this delay may be important for maximising grain yield in a dry season. While Richards et al. (2020) identified a yield penalty associated with ultra-early sowing in southern NSW, their results were obtained in different environments to those of southern QLD and northern NSW. Further research is recommended in both high and low frost-risk environments with a range of stored soil water to understand how long this infertile flowering phase can continue before significant yield loss occurs. This research would help define the optimum flowering window and sowing dates with more precision for a range of environments and seasons.
Frost risk varies over short distances within the landscape, so individual farms or paddocks may have different risk profiles (and optimum sowing dates) to those presented here.
Recent work by AMPs Research in wheat has shown that the top sections of some sloping paddocks on the Liverpool Plains can be sown 4-6 weeks earlier due to lower frost risk. Similarly, it is important to understand that the charts presented here may not be applicable to nearby farms or paddocks due to differences in local topography. For example, our first simulations for the Liverpool Plains used the Gunnedah Resource Centre meteorological station, but we later realised this data was not representative of most farms in the Gunnedah district. We then compared these simulations with the equivalent data from nearby Breeza (side-by-side comparison in Figure 9) showing a much greater frost risk at Breeza compared to the Resource Centre for the same dates in August. Growers should seek independent advice on frost risk for their individual locality, and be careful about making large changes to their normal sowing dates based on data presented here.
Kabuli cultivars are generally slower maturing than desi cultivars
Growers swapping between the two types for the first time need to be mindful of sowing Kabuli chickpeas earlier than desi chickpeas, to flower in the same optimal flowering window.
Extremely early and ultra-late sown crops have the lowest water-limited potential yield.
Some growers in southern NSW are experimenting with spring-sown chickpea to avoid the overly wet, winter growing conditions they encounter in good seasons. However, they may struggle to generate acceptable grain yield unless they are in a cool environment and/or have a genuinely full profile of moisture, and experience good spring rainfall. Further simulations could be conducted to investigate these possibilities.
When testing APSIM on 2019 field trials not discussed in this paper, APSIM simulated the maximum grain yield for field trial data reasonably well, although grain yield for the earliest time of sowing was overpredicted at most locations except Emerald (data not shown). This may have occurred because the effects of cold temperature or frost on flower viability or pod-set are not being fully simulated. Alternatively, the first time of sowing typically has the highest potential yield, so any nutritional limitations are also more likely to impact grain yield in the early time of sowing. Further research is necessary to determine the reasons for these yield gaps.
An example of this is shown in Figure 11 where PBA HatTrick had similar field-measured grain yield across sowing dates and irrigation treatments at Greenethorpe, but potential (simulated) yield of the irrigated early sown treatments was much higher than measured grain yield, causing a large ‘yield gap’. In this experiment PBA Slasher was much closer to achieving potential yield across sowing dates under irrigation and achieved 50% more grain yield in the irrigated trial on the first time of sowing compared to the third time of sowing, but still had a sizeable yield gap of 1 t/ha on the early sowing date. Further research is needed to determine if cultivar choice or other agronomic practices can be used to improve grain yield in conjunction with early sowing dates under favourable conditions.
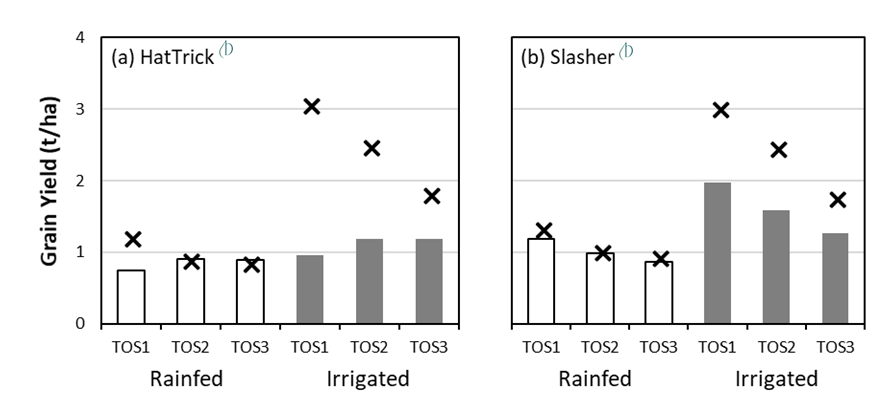 Figure 11. Measured grain yield (bars) and APSIM simulated yield (crosses) for the desi cultivars (a) PBA HatTrick and (b) PBA Slasher across three times of sowing (TOS) at Greenethorpe, 2019. Sowing dates were 30-April, 21-May, 12-Jun. Standard error is ≤ 0.1 t/ha for all measured yield data
Effect of deep sowing and water stress on optimum sowing date
As discussed above, the predictions of optimum sowing date in Figures 9-10 assume a sowing depth of 5cm. As chickpea is often sown deeper than this, it is possible growers may need to take this into account when deep sowing, by sowing earlier than the sowing dates presented here to achieve the same flowering date. However, experiments in Western Australia on sandy soils have shown negligible differences for emergence date and flowering date for an early-season chickpea experiment sown at 5 and 20cm (Rich and Lawes, 2020). Additional anecdotal evidence suggests that while the delay may be small in a warm environment (e.g. Central Qld), it may be larger in cooler environments such as the Liverpool Plains. A rule of thumb used by some agronomists is to allow one days delay in emergence for every additional centimetre of sowing depth, however it is possible that deep sown seedlings may be accumulating ‘heat units’ toward their phenological development while underground, so delayed emergence may not lead to an equivalent delay in the appearance of the first flower. More research is necessary to determine the effect of sowing depth on emergence date and phenology processes across QLD and NSW pulse production regions. Growers and agronomists are advised to keep records on this information for individual fields, as it probably varies between soil types and location.
Additional experiments from 2019 also showed that flowering date sometimes occurred earlier in rainfed plots compared to irrigated plots, suggesting that water stress may hasten reproductive processes. The trend was not consistent across locations and cultivars, but in the most extreme case (Genesis 90 at Greenethorpe) flowering processes were 10-19 days earlier in rainfed treatments compared to irrigated treatments, while at Gatton no differences were detected in flowering date for any cultivar but podding date was 4-12 days earlier in rainfed treatments of both PBA HatTrick and GenesisTM 90. The degree of water stress was probably different between these locations, which would explain the variable results. Further work is needed to determine how different severity of water stress might impact on the occurrence of the optimal flowering window for specific situations and soil types. Wet conditions might reasonably be expected to delay flowering (and hence require earlier sowing to achieve the same flowering date) as has been observed in crops such as wheat. However, disease control may be more difficult in conjunction with early sowing in wet seasons, so optimum sowing date from a grower’s perspective may ultimately not differ greatly between wet and dry years.
Conclusions
While acknowledging the uncertainty in calculation of yield gaps for chickpea crops, and the need for further work on chickpea model development as well as more systematic chickpea farm data collection, we are confident that the gaps described are broadly realistic if not accurate. Other research to identify the causes of yield gaps in Australia’s cropping zone have identified that for wheat, nitrogen was the single most limiting factor. This is less likely to be the case for legume crops such as chickpea that can meet their nitrogen requirement by symbiotic N fixation, although some anecdotal evidence suggests it could be an issue on certain soil types in high-rainfall seasons or when residual chemicals affect rhizobium activity.
The process of investigating experiments using the models also provides direction for future research by highlighting the scientific ‘bottlenecks’ that improved prediction and understanding of crop performance. Additional research is needed across additional seasons to ensure that the predictions of crop performance apply to a range of seasonal conditions, not just the extreme drought conditions experienced during 2019. Model testing in additional environments and seasons will undoubtedly highlight further strategic research priorities that could be addressed to benefit Australian grain farmers into the future.
While Australian grain producers are among the most efficient in the world, there is still room for closing the yield gap of chickpea crops even in a drought year, by adopting best agronomic practice while aiming for a maximum profit level adjusted for individual growers’ risk appetite.
Acknowledgements
The research was undertaken as part of this project is made possible by the support of the GRDC Project ‘The adaptation of pulse (chickpea and lentil) across the northern grains region’ (CSP1904-005RXT). We also acknowledge the many growers, agronomists and researchers who assisted by providing paddock monitoring data and conducting the time of sowing trials, including Michael Moodie (Frontier Farming Systems), Matt Gardner (AMPS Research), Doug Sands and Peter Agius (DAFQ), Jeremy Dawson (MCA Agronomy), Peter Baird (Dodgshun Medlin), Kate Coffey (Riverine Plains Inc), Barry Haskins and Albert Gorman (Ag Grow Agronomy and Research), Chris Minehan and Fred Broughton (Rural Management Strategies), and Jim Hunt (Hunt Ag).
CSIRO, NSWDPI, SARDI, QDAF, USYD, UQ-QAAFI, The Australian Federal Government, QLD, NSW and SA State Governments are also acknowledged for directly and indirectly contributing to project funding. We would also like to thank Jeremy Whish, Fernanda Dreccer and Tony Swan (CSIRO), Richard McCallum, Mark Richards and Kirsty Hobson(NSWDPI), Helen Bramley and Josie Clarke (University of Sydney) for their contributions to the project that were not reported in this paper. We thank Paul McIntosh (Pulse Australia and the Australian Herbicide Resistance Initiative) for assisting with disease control protocols of field trials, and Neil Huth (CSIRO) for assisting with APSIM model development. We also acknowledge the incredible work carried out by the many technical staff from many organisations in successfully planning and conducting the extensive field trial program, which was instigated at short notice.
References
Clarke, H. J. and Siddique, K. H. M. (2004). Response of chickpea genotypes to low temperature stress during reproductive development. Field Crops Research, 90, 323-334.
Dreccer, M.F., Sadras, V., Lake, L., Peake, A.S., Lee Long, I. et al. (2020). Appendix B: Understanding the critical stage for yield formation in chickpea and lentil in response to abiotic stress. In Peake A.S. et al. (Eds) ‘Final Report to GRDC project CSP1904-005RXT: The adaptation of pulses (chickpea and lentil) across the northern grains region’. CSIRO Agriculture and Food, ACT, Australia.
Lobell, D. B., Cassman, K. G., & Field, C. B. (2009). Crop yield gaps: their importance, magnitudes, and causes. Annual Review of Environment and Resources, 34
Rich, S. and Lawes R. (2020) Sowing flexibility of chickpea and lentil in the Western Australian farming system. GRDC Updates, February 2020, Perth.
Richards, M., Maphosa, L., Presto, A., Napier, T., Hume, I. (2020). Pulse adaptation – optimising grain yield of chickpea and lentils. GRDC Northern Region Updates, 2019.
van Rees, H. McClelland, T. Hochman, Z. et al. 2014. Leading farmers in South East Australia have closed the exploitable wheat yield gap: Prospects for further improvement. Field Crops Research, 164, 1-11.
Whish, J., Peake, A.S., Rodriguez, D., Swan, T., Richards, M., et al. (2020). Appendix F: Chickpea Phenological Key. In Peake A.S. et al. (Eds) ‘Final Report to GRDC project CSP1904-005RXT: The adaptation of pulses (chickpea and lentil) across the northern grains region’. CSIRO Agriculture and Food, ACT, Australia.
Contact details
Allan Peake
CSIRO Agriculture and Food
Ph: 07 4571 3212
Email: allan.peake@csiro.au
Zvi Hochman
CSIRO Agriculture and Food
Ph: 07 3214 2234
Email: zvi.hochman@csiro.au
Important disclaimer
CSIRO and GRDC advise that the information contained in this publication comprises general statements based on scientific research. The reader is advised and needs to be aware that such information may be incomplete or unable to be used in any specific situation. No reliance or actions must therefore be made on that information without seeking prior expert professional, scientific and technical advice. To the extent permitted by law, CSIRO, GRDC and the partner organisations listed above (including their employees and consultants) exclude all liability to any person for any consequences, including but not limited to all losses, damages, costs, expenses and any other compensation, arising directly or indirectly from using this publication (in part or in whole) and any information or material contained in it.
Varieties displaying this symbol beside them are protected under the Plant Breeders Rights Act 1994.
TM Trademark
GRDC Project Code: CSP1904-005RXT,
