Identification of crop-specific and varietal tolerance limits to acidity, salinity and sodicity
Identification of crop-specific and varietal tolerance limits to acidity, salinity and sodicity
Take home messages
- In Qld and NSW, the soil constraints affecting the greatest cropping areas are sodicity combined with toxic chloride (Cl) concentrations. Acid sub-soils are also important in some areas
- Reduced ability to extract soil water from deeper layers is the main affect reducing yield
- Crop-specific tolerance limits vary between species and between soil constraints
- Tolerance to soil constraints differs between varieties of wheat
- Robust ranking would allow growers and breeders to select the most tolerant varieties, but high spatial soil variation over short distances makes consistent ranking difficult
- We are testing whether pre-screening for proxy traits in the laboratory and using remote sensing to account for spatial variation in the field can be used to increase our ability to select the most tolerant varieties.
Introduction
Successful dryland crop production in the north-eastern Australia depends on utilising soil moisture accumulated in the period preceding sowing. Due to the high clay content of the soils in the region, these soils can potentially store 200-250 mm of water in the soil profile or more. However, soil constraints, especially in the subsoil, reduce the effective rooting depth thus also reducing the amount of water and nutrients that plants can obtain from the soil, resulting in reduced crop yield (e.g. Figure 1) (Dang et al. 2006 and 2016).
High sodicity in surface soil and subsoil, high salinity and phytotoxic concentration of chloride (Cl) in the subsoil, alkalinity, subsoil acidity and compaction are common soil constraints in many semi-arid regions worldwide and in particular Queensland and NSW (Figure 2, Table 1). These soil constraints often occur in combination and can interact with each other to create unique environments for root growth at a given location (Nuttall et al. 2003). They may also vary both spatially and temporally. Spatial variation can occur within a field, across the landscape and with depth in the soil profile.
Spatial variability and the interactions between constraints can limit agronomic and management options. Variability in the impact on crop growth and yield is also compounded by the interaction between constraints and environmental factors, particularly the timing and amount of rainfall relative to the crop development cycle.
The amelioration of soils affected by constraints is usually expensive, if it is possible at all. The application of ameliorants (e.g. gypsum for sodicity) can sometimes improve surface soils (Page et al 2020, 2021). However, amelioration of constraints occurring in the subsoil is not usually practical. Where subsoil constraints are present, the selection of crops or varieties tolerant to soil constraints and the identification of traits for pre-selection may provide a long-lasting, tangible solution to improve yields.
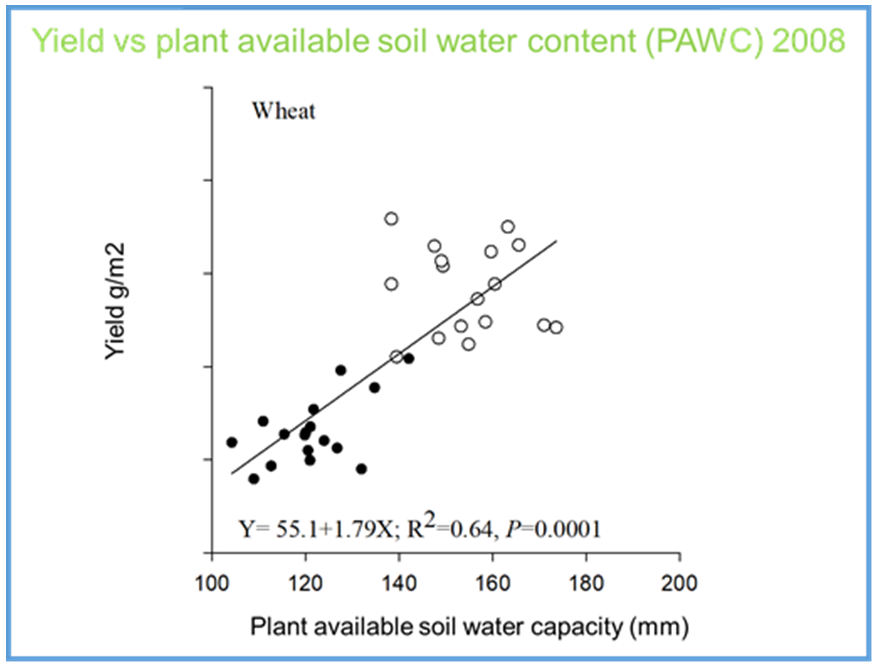 Figure 1. Wheat yield versus soil water extracted between sowing and maturity (plant available soil water capacity, Dang et al., 2016). Solid dots represent data for a highly sodic site and open dots a less-sodic site.
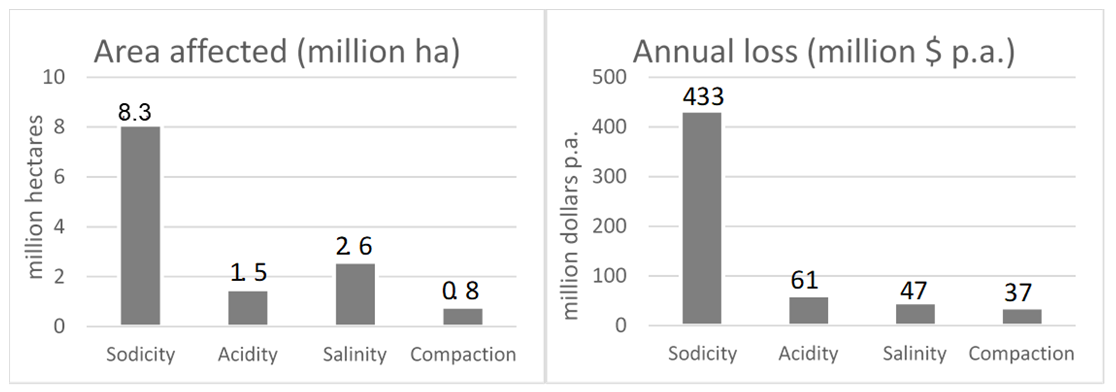 Figure 2. Area affected and annual financial loss due various soil constraints in Queensland and NSW (Orton et al. 2018)
Table 1. Sodicity combined with high chloride concentration at depth represent the main soil constraints in QLD and NSW (Orton et al. 2018).
Region | Area of cropping land affected (million ha) | Estimated cost in lost production | |
|---|---|---|---|
Sodicity | Subsoil Cl | (million $/yr) | |
Central Qld | 1.4 | 0.7 | 59.5 |
Southern Qld | 1.4 | 0.9 | 85.4 |
Northern Qld | 3.0 | 1.0 | 157.0 |
Central NSW | 1.3 | <0.1 | 54.3 |
Southern NSW | 1.0 | <0.1 | 77.0 |
Total | 8.1 | 2.7 | 433.1 |
Crop-specific tolerance limits vary between species and between constraints
Saline soils
Soil salinity refers to the amount of salt dissolved in the soil solution and is quantified by measuring the electrical conductivity of a saturated soil extract (ECe). Lower ECe values are generally more favourable for crop production.
A recent survey of published studies on the tolerance of 17 crop species reported that the tolerance thresholds for soil constraints varied between species and between constraints (Page et al., 2021). The tolerance levels of different crops for soil salinity were classified using a ‘traffic light’ system (Figure 3). Salinity levels for which little if any reduction in yield was reported in the literature were classified green. Levels where some yield loss might be observed (depending on soil type, season and variety) are represented in yellow, while those where loss was reported for most soils, seasons and varieties are represented in red. For example, the studies indicate that the more tolerant cereals, such as barley and millet, will typically perform well up to salinity levels of ECe 5 ds/m. However, they usually suffer severe damage at levels above ECe 10 ds/m (Figure 3). In contrast, more sensitive cereals, such as maize and sorghum, only performed well up ECe 2 ds/m and suffered severe damage at levels greater than ECe 5 ds/m. Some legume species were even more sensitive (Figure 3).
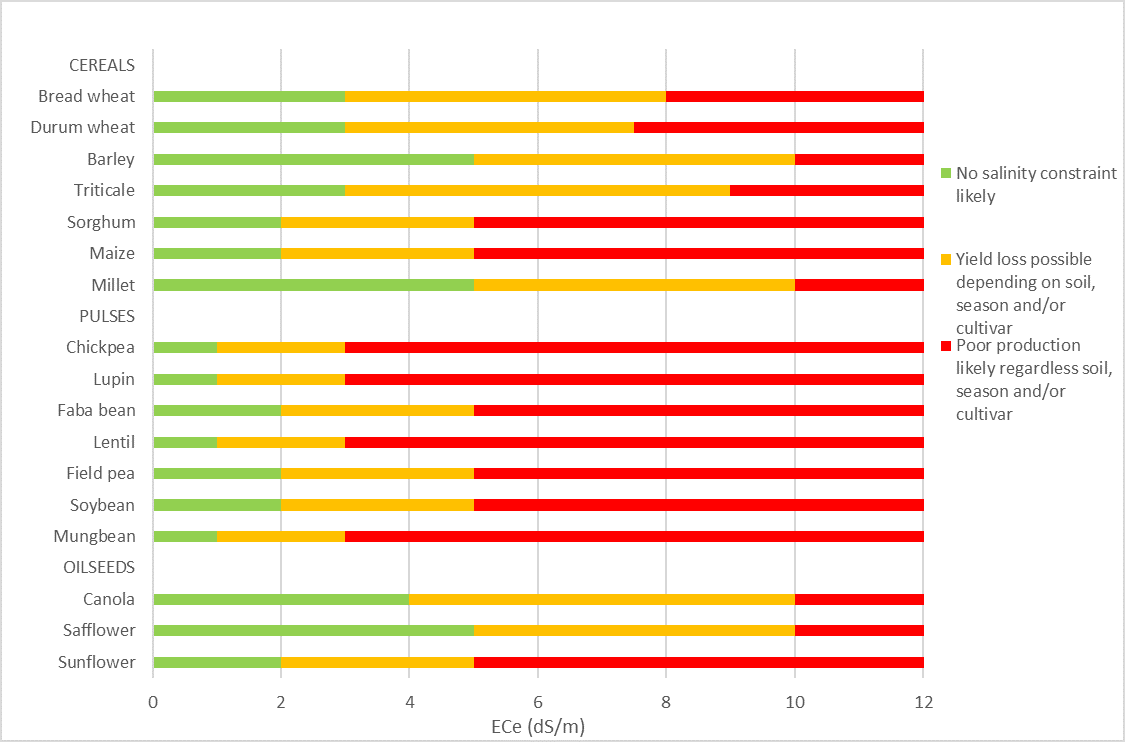 Figure 3. Soil ECe tolerance limits proposed for crop species when grown under rainfed conditions in subtropical regions (Page et al., 2021).
Acid soils
The adverse effects of soil acidity generally increase with lower pH values measured in the soil solution.
Just as for salinity, the tolerance thresholds of crops varied between the 17 species and between constraints (Page et al., 2021). However, the ranking of the crops was very different. Results are represented here in Figure 4, again using the ‘traffic light’ system described above. For acidity, the cereals sorghum, maize and millet were able to tolerate more severe acidity levels than many other species, with good growth to as low as pH 5.5 and severe yield loss once pH dropped below pH 4.8. In contrast, the most sensitive cereals were durum and barley, which performed well only down to pH 6.0 and suffered severe yield loss below pH 5.3. Some legume species were also similarly sensitive (Figure 4).
Thus, the crop species most suitable for a particular paddock can vary greatly depending on which are the most prevalent soil constraints. Crop and cultivar choice are also affected by the season and the variety.
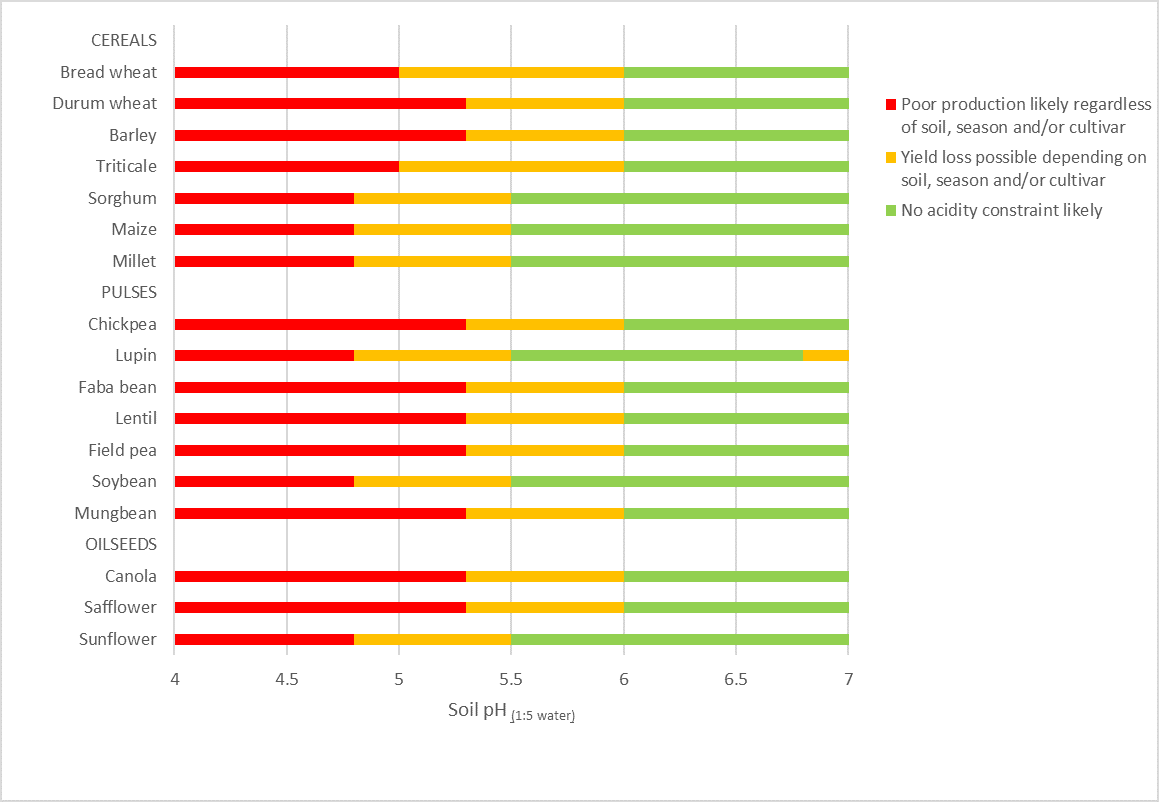 Figure 4. Soil pHw1:5 tolerance limits proposed for crop species when grown under rainfed conditions in subtropical regions (Page et al., 2021).
Sodic soils
The literature report also indicated that tolerance to soil sodicity varies between species, although there is not currently enough information available to publish ‘traffic light’ boundaries for sodicity. However, it is clear that there are differences in the tolerance of different species and varieties to sodic conditions. Improving our understanding about which are the best species and varieties for areas with sodic soils is an important research priority and will help improve productivity, particularly when sodicity occurs in the subsoil and is difficult to ameliorate.
Tolerance to sodicity varies between cultivars of wheat
A limited number of cultivars have been tested at contrasting sites in several seasons
As part of a GRDC co-funded project ’Improving wheat productivity on sodic, saline and dispersive soils‘, (UA00159, 2015 to 2020), trials in Queensland were conducted at a highly-sodic site and a less-sodic site in each season to compare tolerance to soil constraints between certain wheat genotypes (Figure 5).
A key aim of this project was to characterise the tolerance to soil constraints of wheat genotypes in all the major Australian cropping regions. To achieve this, a core set of lines from all over Australia were tested in all regions. A small number of lines from Qld and NSW were included in each season. A comprehensive comparison of current commercial cultivars in each region was not a focus. However, data on the small number of Qld and NSW cultivars tested do show genotypic differences.
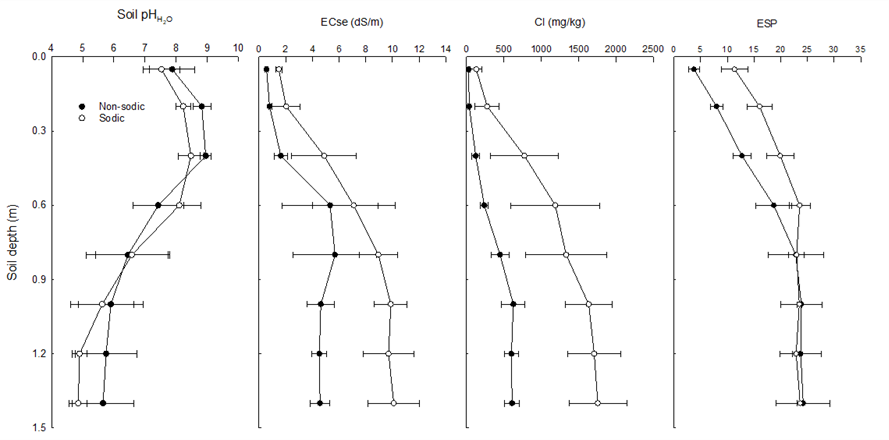 Figure 5. Average and standard errors of soil constraints for the less-sodic and highly sodic sites during 2015-19 experiments.
Soil and seasonal variability complicate field comparisons
The effects of soil constraints vary both spatially and temporally complicating attempts to compare genotypes in the field. Spatial variation in the field occurs both across the landscape and with depth in the soil profile (Figure 5). High levels of variation at the surface over distances of a few metres are common, particularly after levelling (Figure 6). There are also complex interactions among the various physio-chemical constraints (Nuttall et al., 2003). These complicated interactions can limit the agronomic and management options. Variability in the impact on the crop growth and yield is compounded by the complex interactions between the physiochemical constraints and environmental factors, particularly the timing and amount of rainfall relative to the crop development cycle. This leads to variation in genotype ranking from season to season and the ability to ascribe differences between genotypes to soil constraints.
Spatial variability
To find genetic differences in the presence of high spatial variability, it is necessary to have many plots for each genotype spread across the trial. During UA00159, 4 replicate plots per genotype were used in most years with 6 replicates in 2020. This compares to 2 or less replicates per genotype in standard multi-environment genotype trials. The need for such high numbers of replicates limits the number of lines that can be tested each year.
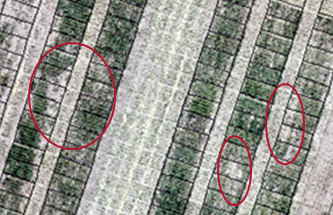
Figure 6. Drone image of a highly constrained trial site near Goondiwindi in 2020 showing spatial differences in canopy cover likely due to small scale differences in soil constraints.
We are currently using remote sensing information from drones to determine whether information on canopy cover might be used to compensate for some of the spatial variation in soils to improve detection of genetic difference.
Temporal variability
The ability to discriminate between genotypes for tolerance to sodic soils with variable subsoil constraints in field experiments varied greatly in each season during project UA00159 (Figure 7). In 2015 and 2016, higher than average in-crop rainfall meant that plants were less reliant on access to water from the soil. Thus, rankings in these seasons are less likely to be representative of tolerance to soil constraints.
Conversely, during 2019 when in-crop rainfall was extremely low, the high-constraints trial could not be harvested at all. In dry years more generally, genotypic differences are usually much harder to differentiate because of very low yield.
In years when in-crop rainfall is near the district average, as in 2017, 2018 and 2020, discrimination between genotypes was much better.
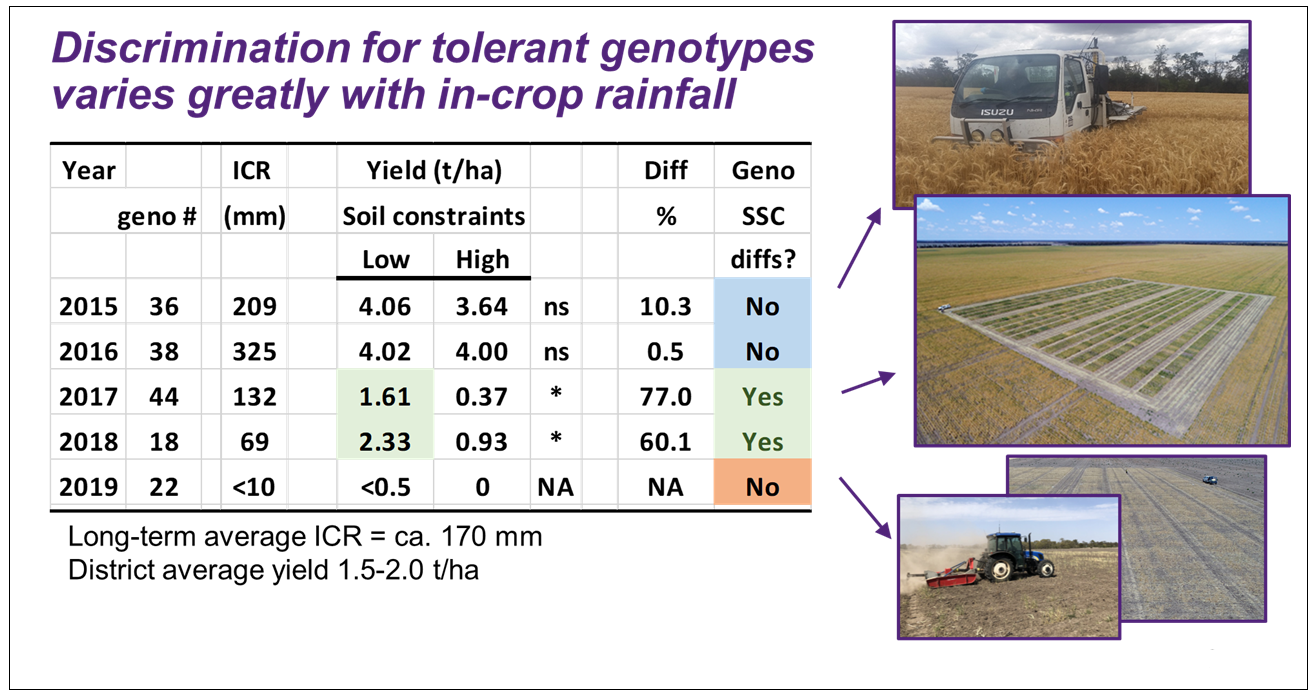 Figure 7. Differences between mean yield at a highly sodic site and less sodic site in each season as well as differences in genotype ranking between sites were most evident in years where in-crop rainfall (ICR) and site mean yields were close to the district average.
Genetic differences in tolerance can be found
Despite the challenges discussed above, genetic differences between varieties could be identified particularly in seasons 2017, 2018 and 2020. In general, the yield ranking of genotypes at the less-sodic site was not a good indicator of the ranking at the highly sodic site. This indicates that testing on highly sodic soils is likely to be required to identify varieties best for those sites. For example, in 2018 the cultivars Corack, Mitch, Trojan and Mace ranked highly at the non-sodic site, while the wheat genotypes Flanker, Corack, Janz and Sunco ranked highly at the sodic site (Figure 8). However, given the small number of varieties tested to date, it is not yet possible to determine sufficient economic value that would provide useful grower advice on variety choice at this time.
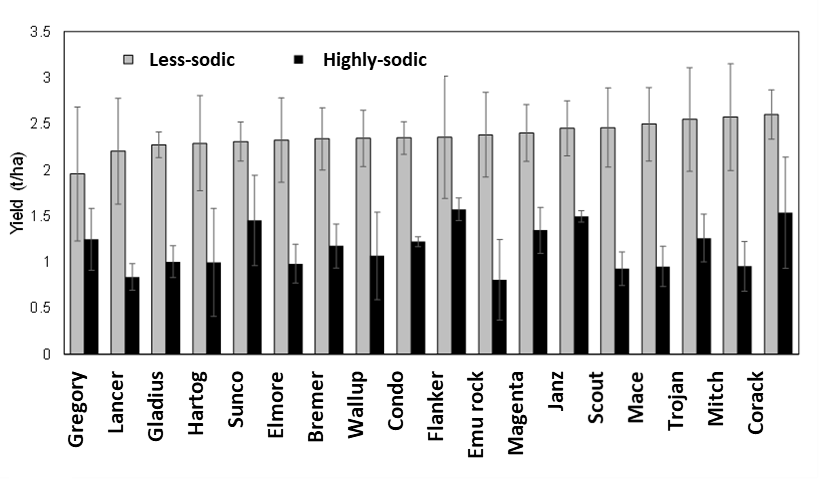 Figure 8. Mean grain yields of wheat lines at the sodic site in 2018, ranked in ascending order of yield at less-sodic site in 2018.
(The varieties Gregory, Lancer, Gladius, Elmore, Bremer, Wallup, Condo, Flanker, Emu rock, Magenta, Mace, Trojan, Mitch and Corack are protected under the Plant Breeders Rights Act 1994.)
Proxy traits could help identify prospective cultivars and breeding lines
Proxy traits are often used in research and breeding where the primary trait, in this case performance on sodic sites, is hard or expensive to measure. Field validation is always needed; however, proxy traits can sometimes be used to quickly identify genotypes most likely to perform well. Even if the proxy trait is not highly accurate in identifying the best performing lines, it may be useful to identify the vast bulk of lines that are not likely to be well adapted. This can reduce the number of lines requiring highly replicated field trials at multiple sites in multiple years.
Thus, proxy traits can potentially be used
- To provide recommendations to growers, by helping identify the most prospective cultivars for expensive field testing
- In breeding programs aiming to develop more tolerant lines, to screen out the bulk of low ranking lines.
Potential proxy traits have been identified
Potential proxy traits associated with tolerance to sodic soils with high Cl at depth include lower concentrations of Cl in the youngest mature leaf blades close to flowering as well as higher concentrations of calcium and potassium (Figure 8; Dang et al 2016).
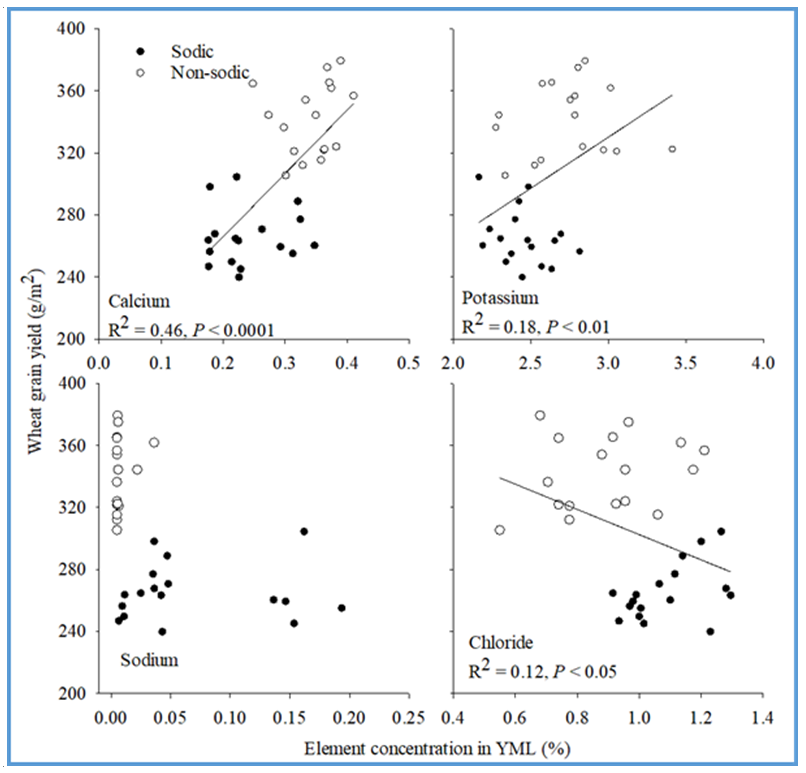 Figure 9. Concentrations of elements in the youngest mature leaf (TML) of wheat near flowering (Dang et al. 2016). Solid dots represent data for a highly sodic site and open dots a less-sodic site.
Additionally, a number of traits have been identified as associated with better establishment in the presence of a soil crust (which can often form on sodic topsoils). These include rapid germination, increased emergence force with greater hypocotyl diameter and narrower root angle (Anzooman et al. 2018, 2019).
Thus, choice of species and variety are important for optimising return on sites with soil constraints. The most tolerant species and variety differs depending on the most limiting constraint.
References
Anzooman M, Christopher J, Dang YP, Taylor T, Menzies NW and Kopittke PM (2019). Chemical and physical influence of sodic soils on the coleoptile length and root growth angle of wheat genotypes, Annals of Botany, 124(6):1043-1052
Anzooman M, Dang YP, Christopher J, Mumford MH, Menzies NW and Kopittke PM(2018). Greater emergence force and hypocotyl cross sectional area may improve wheat seedling emergence in sodic conditions Plant Science 277:188-195
Dang YP, Christopher J and Dalal RC (2016). Genetic diversity in barley and wheat for tolerance to soil constraints, Agronomy Journal, 6(4):55
Dang Y, Dalal RC, Routley R, Schwenke GD and Daniel I (2006). Subsoil constraints to grain production in the cropping soils of the north eastern region of Australia: an overview, Australian Journal of Experimental Agriculture, vol. 46, no. 1, pp. 19-35.
Dang YP, Routley R, Mcdonald M, Dalal RC, Singh DK, Orange D and Mann M (1999). Subsoil constraints in Vertosols: crop water use, nutrient concentrations and grain yields of bread wheat, barley, chickpea and canola, Australian Journal of Agricultural Research, 57(9): 983-98
Nuttall JG, Armstrong R and Connor D (2003). Evaluating physicochemical constraints of Calcarosols on wheat yield in the Victorian southern Mallee, Australian Journal of Agricultural Research, vol. 54, no. 5, pp. 487-97.
Orton TG, Mallawaarachchi T, Pringle MJ, Menzies NW, Dalal RC, Kopittke PM, Searle R, Hochman Z and Dang YP (2018). Quantifying the economic impact of soil constraints on Australian agriculture: A case‐study of wheat, Land Degradation & Development, 29(11): 3866-75
Page KL, Dang YP, Dalal RC, Kopittke PM, and Menzies NW (2020). The impact, identification, and management of dispersive soils in rainfed cropping systems. European Journal of Soil Science 1-20.
Page KL, Dang YP, Martinez C, Dalal RC, Wehr JB, Kopittke PM, Orton TG and Menzies NW (2021) Review of crop-specific tolerance limits to acidity, salinity and sodicity for seventeen cereal, pulse, and oilseed crops common to rainfed subtropical cropping systems, Land Degradation and Development (under review)
Acknowledgements
The research undertaken as part of this project is made possible by the significant contributions of growers through both trial cooperation and the support of the GRDC, the author would like to thank them for their continued support.
The authors wish to acknowledge the support of the University of Queensland, School of Agriculture and Food Science (UQ-SAFS) also the University of Queensland Alliance for Agriculture and Food Innovation (UQ QAAFI) an alliance between the University of Queensland and the Department of Agriculture and Fisheries Queensland (DAF) as well as the excellent technical support of Scott Diefenbach and the DAF Leslie Research Facility, Farm Team.
Contact details
Dr Jack Christopher
UQ QAAFI, Centre for Crop Science.
Leslie Research Facility, PO Box 2282 (13 Holberton Street), Toowoomba
Ph: 07 4529 1314
Email: j.christopher@uq.edu.au
® Registered trademark
Varieties displaying this symbol beside them are protected under the Plant Breeders Rights Act 1994.
GRDC Project Code: UOQ1803-003RTX,
