Wheat 2030 - opportunities in a volatile world
Wheat 2030 - opportunities in a volatile world
Author: Ross Kingwell, AEGIC | Date: 04 Mar 2021
Take home message
Over the last 20 years Australian wheat export sales have pivoted away from Middle East markets towards a greater focus on SE Asian markets. Over the next 10 years wheat production in eastern Australia increasingly will continue to focus on markets in SE Asia and more especially within Australia. Limited growth in wheat production in eastern Australia is expected over the next decade, yet domestic demand, mostly in eastern Australia, will increase due to population growth and food preferences that increasingly draw on feed grains. The trend increase in wheat production in eastern Australia will need to solely go to the domestic market over the next decade. Bumper years, however, will cause marked increases in grain exports. In general, domestic market opportunities will be increasingly important for eastern Australian wheat producers.
The global outlook for wheat
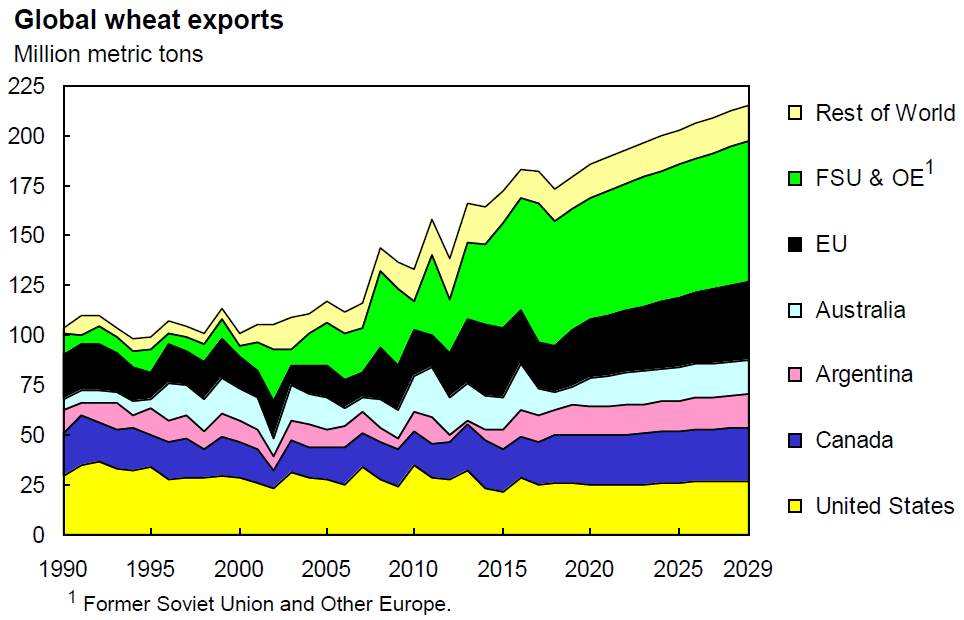
Towards 2030 the global outlook for wheat will be affected by major supply and demand influences. On the supply side, the Black Sea region (Russia, Ukraine, Kazakhstan) and eastern Europe, will sustain their emergence as major sources of competitive wheat exports (Figure 1). As a result, Australia, Canada and the USA will see their shares of global wheat exports being squeezed.
 Figure 1. Regional suppliers of wheat exports. Source: USDA (2020)
Wheat exports by Russia and Ukraine are expected to continue their recent pattern of strong export growth and are projected to climb further from 59.9 mmt in 2020/21 to 69.3 mmt in 2029/30. This increase accounts for 31 percent of the projected increase in world wheat exports. EU wheat exports are projected to reach 39 mmt by 2029/30, a 3.4 percent annual growth rate. Rising EU exports are due to higher wheat yields and a decline in the EU use of feed wheat. Argentina’s wheat area is expected to grow despite its government applying export taxes on its principal export grains. Argentina’s wheat exports are expected to rise to 16.8 mmt in 2029/30, with Brazil continuing to be its principal export destination, projected to import 8.1 mmt by 2029/30.
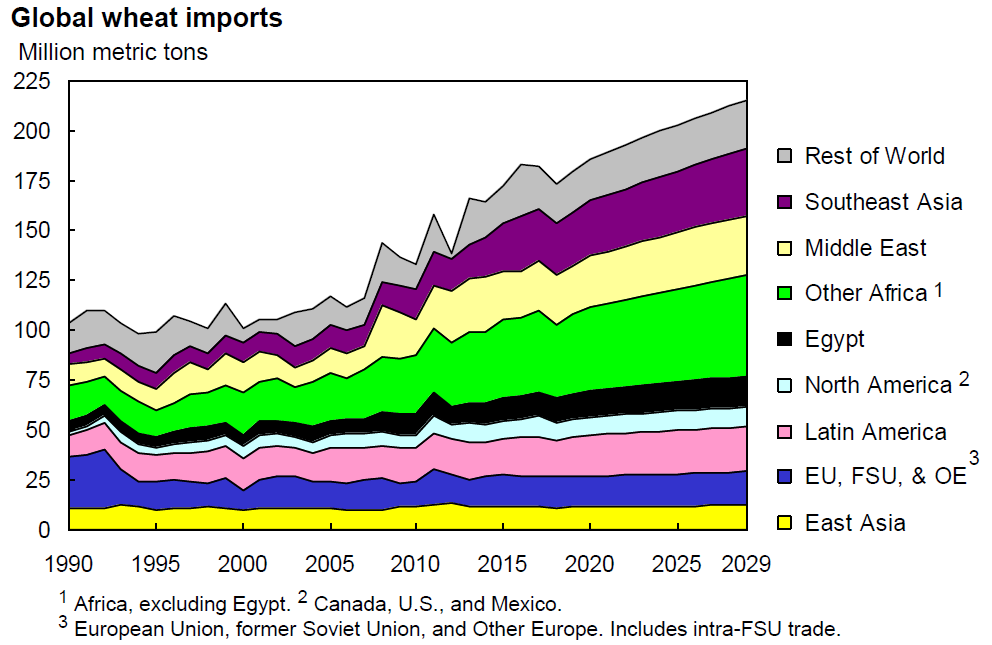
On the demand side, the global relative importance of wheat markets in SE Asia, the Middle East and Africa will increase (Figure 2). The increase in demand for wheat in these regions principally will be driven by population growth (Figure 3) and to a lesser extent by increases in per capita incomes that will increase the demand for wheat for food and feed purposes.
 Figure 2. Regional importers of wheat. Source: USDA (2020)
Although China and India together account for over 36 percent of the world’s population and might be expected to be major importers of wheat, in fact in most years they import relatively minor or modest amounts due to their large domestic production of wheat. Population growth in both countries is declining (more so in China) with India expected to overtake China as the world’s most populous country by 2027.
Figure 3. Regional increases in population. Source: Based on USDA (2020)
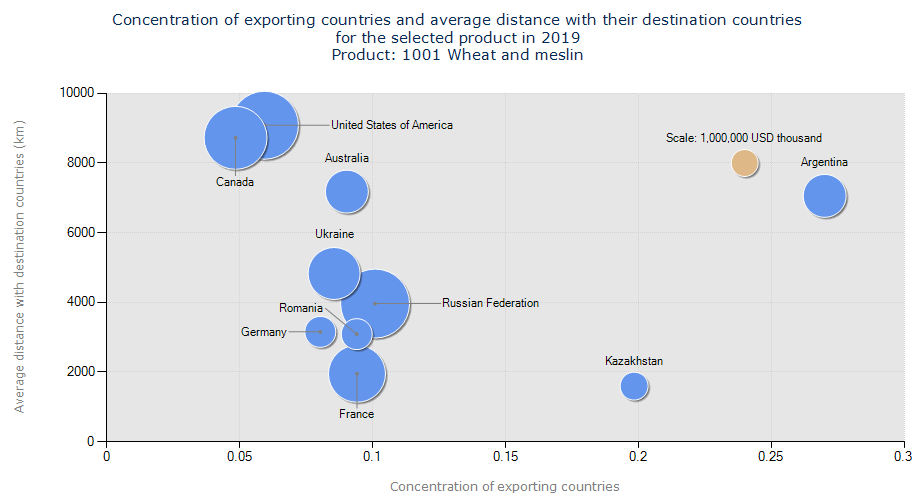
As shown in Figure 4, apart from Argentina that principally exports its wheat to Brazil, most wheat exporting nations deliver their wheat to a wide range of countries. Some low-cost wheat exporters, such as Russia, Ukraine and Romania, have the added advantage of being able to export to nearby countries such as Egypt, Turkey, Iran and Iraq that, in combination, are major global sources of wheat import demand. Middle East markets that once were key markets for Australian wheat exports are now mostly serviced by cheaper Black Sea country supplies; and so Australia has shifted its wheat export focus towards SE Asia, although the growth in demand for wheat is slowing in SE Asia.
 Figure 4. The geographical reach of wheat exported from various main wheat exporting nations. Source ITC (2020)
The domestic market for Australia’s wheat
Average wheat production in Australia from 2016 to 2020 was 23.3 mmt. Despite continuing climate volatility, further increases in wheat yields are expected due to improved plant genetics, better agronomic management, soil amelioration and machinery advancements. But the area sown to wheat is not likely to alter much as farmers maintain their crop diversity and rebuild sheep flocks and cattle herds. If the area sown to wheat is maintained at around 12 mha then an additional 2.3 mmt of wheat is likely to be produced in Australia by 2030. However, as shown in Figure 5, consumption of wheat for feed (e.g., poultry, eggs, cattle) is projected to increase, underpinned by a 4.2 million growth in Australia’s population. As a result, all of the additional production of wheat in eastern Australia towards 2030 will need to flow to the east coast domestic market, as that is where most of the increased demand for wheat will arise. Consequently, the domestic market will become increasingly important to eastern Australian wheat producers, especially in years when wheat production is constrained by seasonal conditions.

Transport infrastructure developments such as the inland rail, towards 2030, will facilitate the regional flow of wheat to serve domestic needs of rural industries and major population centres. In dry years when grain production is limited, supplementary grain feeding will increase, creating a spike in demand for feed grains and a reduction in wheat exports (Figure 5 – 2000s and 2018/19).
The importance of the domestic market for wheat, particularly in eastern Australia, is highlighted in Table 1. The likelihood towards 2030 is that growth in wheat exports from Australia’s eastern states will be constrained by their increased domestic demand for wheat for feed and food purposes. By contrast, due to their much smaller populations and more reliable grain producing environments, WA and SA will remain main sources of wheat exports. By contrast, due their combination of volatile production, growing domestic markets and a constrained outlook for additional wheat production, states like Qld and NSW will remain less reliable and more opportunistic in their export of wheat.
Table 1. Wheat production and exports from each Australian State (average of 2015 to 2019)
Wheat item | NSW | Qld | Vic | SA | WA |
|---|---|---|---|---|---|
Production (mmt) | 5.07 | 0.88 | 3.21 | 4.02 | 8.33 |
Exports (mmt) | 1.45 | 0.33 | 1.61 | 3.22 | 7.48 |
Percent exported (%) | 29 | 37 | 50 | 80 | 90 |
Coefficient of variation of exports (%) | 52 | 42 | 46 | 19 | 18 |
Source: ABS
For many wheat importing countries, especially in SE Asia, Australia’s small population, relative to its wheat production, combined with its political stability, allows Australia to be a nearby, often reliable, supplier of wheat. By contrast some other wheat exporting nations display political and economic instability that weakens those countries’ reliability as wheat exporters. The policy reactions of imposing wheat export taxes or restrictions on wheat exports, as observed in Argentina and Russia, ultimately work to Australia’s favour. Furthermore, Australia’s wide spread of wheat export markets makes Australian wheat producers, unlike its barley, lobster or wine producers, less exposed to the changeable import policies of any one market.
Contact details
Professor Ross Kingwell
Australian Export Grains Innovation Centre
Perth & Sydney
Ph: 08 6168 9920
Email: ross.kingwell@aegic.org.au

