Increasing reliability of lentil production on sandy soils
Increasing reliability of lentil production on sandy soils
Author: Sam Trengove, Stuart Sherriff and Jordan Bruce (Trengove Consulting) | Date: 13 Jul 2021
Take home messages
- Four key steps to improving lentil productivity on underperforming sandy soils are: soil amelioration, variety selection, herbicide choice and nutrient management.
- Ameliorating soil constraints increased lentil grain yields up to 347%, with an average 0.31t/ha (85%) yield response to deep ripping.
- The highest yielding varieties on loamy soil types may not be the highest yielding on underperforming sandy soils.
- Weed control methods on sandy soil types should be carefully planned to minimise yield loss due to the heightened risk of herbicide damage from soil residual herbicides.
- Nutrient requirements on sandy soil types can vary across locations and seasons. Application of molybdenum on acidic sands were shown to increase grain yields.
- Lentil growth and biomass, as measured by NDVI, was positively correlated with grain yield on sandy soils.
Background
Lentil production in South Australia has expanded significantly over the last 20 years. It is valued for its agronomic rotational benefits and its ability to generate high economic returns. The expansion in lentil area now sees the crop produced on a diverse range of soil types across the state. Observations of lentil growth and productivity has indicated that on some sandy soils’ performance has been sub optimal, with significant scope for improvement. This was particularly notable in the dune swale landscape of the northern Yorke Peninsula. Two SAGIT projects (TC116, TC119) have investigated opportunities for increasing lentil productivity on the sandy soil types of this region. These sands are typically red sandy dunes with low organic carbon (0.4-0.8%). Constraints on these sands can include compaction, non-wetting, pH (both acidic and alkaline), nutrition and low biological activity. The heavy reliance on herbicides with residual soil activity for broadleaf weed control in lentil also presents challenges on these soils. However, these sandy dune soil types are not typically constrained by the subsoil toxicities of sodicity, salinity or boron that limit production on many of the heavier textured soils in the region. Thus, significant production improvement in lentil is expected if these known constraints can be overcome. This paper details the results of SAGIT and GRDC funded amelioration, variety selection, herbicide choice and nutrition trials conducted on these sandy soils.
Methodology
General trial information
Yield data from specific treatments from a range of soil amelioration trials have been summarised for the purpose of this paper. For detailed methodology of each trial contact Trengove Consulting or refer to the relevant project listed.
Soil types – Trials occurred in 2015 and from 2017 to 2020 and were located on poor performing sandy soils across the upper northern Yorke Peninsula. Soils ranged from grey alkaline sands near Alford to red/orange sands around Bute and Port Broughton. Organic carbon level was typically low with 0.94% the highest, pH values ranged from acidic sites (0-10cm pH 5.3 CaCl2) to highly alkaline (0-10cm pH 8.6 CaCl2) and nutrition levels also varied with Colwell P values ranging from 26 – 44.
Trial sowing dates were typical for lentil crops in the region and were sown between May 11 and May 22. Standard seeding fertiliser was applied as MAP @ 60 – 80 kg/ha.
Herbicide treatments were applied using a 2m hand boom. Pre-emergent herbicides were applied pre seeding or split with 2/3 applied pre seeding and 1/3 post seeding pre-emergent. Plots were sown using knife points and press wheels on 250mm spacing and all plots were rolled using a steel roller, either pre-emergent or early post emergent. Early post emergent diflufenican herbicide treatments were applied (June 14 – July 28) approximately 10 days prior to Intercept® herbicide treatments (July 2 – August 8). Varieties for the herbicide tolerance and nutrition trials were either PBA Hurricane XT or PBA Hallmark XT.
All trials in these projects were randomized complete block designs with three replicates and plot dimensions were 1.5 * 10m.
Early growing season rainfall during the herbicide trial years was generally, with the exception being one day in June 2019 where 47mm was recorded at Bute (Figure 1).
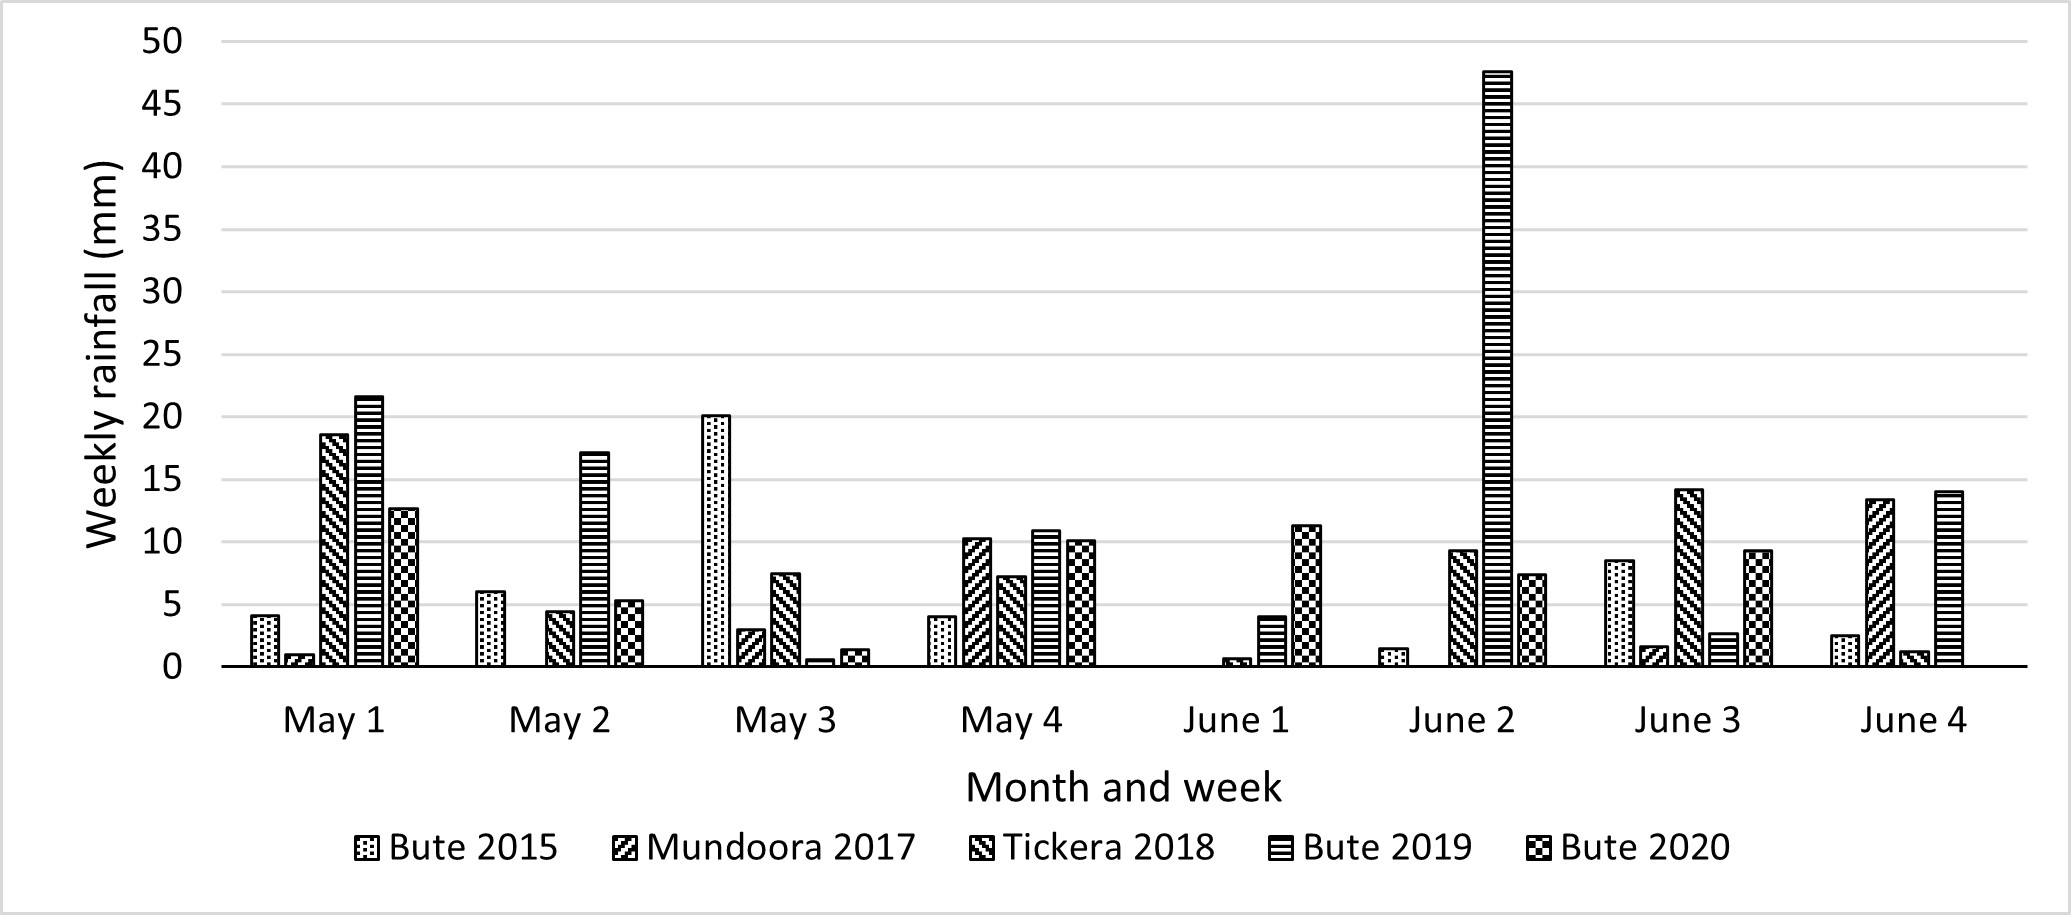
Figure 1. Weekly rainfall for the period leading up to seeding and early post emergent for all trials 2017 – 2020.
Results and Discussion
Amelioration
Compaction is a common physical constraint of crop growth on sandy soils in the northern YP region, it inhibits plant root exploration beyond compacted depths. Results from amelioration trials conducted in the northern YP and Mallee regions show an average lentil response to ripping of 0.31 t/ha, or 85% yield increase (Table 1). In some instances, the scale of response is much larger in lentil than for cereals at the same site. For example, a long-term trial site at Bute (Table 1, site 6) has averaged 0.51t/ha (109%) yield increase in lentil over two seasons, whereas cereal response has averaged 0.6t/ha (19%) over four seasons at the same site. The lentil responses, as measured by percent increase over the control treatment, are much greater than those measured in cereal due to the lower baseline yields in lentil. In this example the lentil response provides a much greater economic response when compared with cereals, due to their inherent higher grain price.
Penetrometer resistance measurements down the soil profile (data not shown) were characterised for sites five and six (Table 1). At site five soil resistance to a cone penetrometer never exceeded 2500kPa. However, at site six the untreated control exceeded 2500kPa from a depth of 17cm to the limit of measurement (at 60cm), with a peak of 4300kPa between 30-35cm. These differences help to explain the grain yield response to ripping at site six. It also highlights the need for diagnosing the presence of the constraint prior to undertaking soil amelioration works.
Other constraints identified include low fertility, low organic matter, and soil acidity. Four trials testing the response to chicken litter applied at rates of 5 or 7.5 t/ha as a once off application averaged 0.26 t/ha (41%) yield increase in lentil (Table 1). As found with the ripping response, at site six (Table 1) the application of 5 t/ha chicken litter has a greater effect in lentil than for cereals with the cereal yield increasing by an average 10.6% (0.32 t/ha) compared to 37% (0.18 t/ha) for lentil. Grain yield responses were measured six years after application in this trial. However, responses of this scale have not been observed in separate nutrition trials during the same period, where chicken litter has been included as a treatment at 5t/ha. The latter trials differ in that the chicken litter was applied to the surface immediately pre-seeding and incorporated by sowing, where in the amelioration trials the chicken litter was mostly incorporated in some way, either by ripping or offset disc, and was applied at least two years prior to lentils in three of the four trials. This method of incorporation and time period from application to lentil season may be important in explaining the differences in results observed. The findings suggest that earlier application and incorporation provided an improved environment for lentil plants to uptake mineralised nutrients from the chicken litter application than when applied and incorporated with the lentil crop.
Three trials assessing options for management of soil acidity on sandy soils in the Bute region were established recently in 2019. These trials were all lentil in 2020. Only small increases in grain yield were achieved in response to lime treatments averaging 0.08 t/ha, or 4% (Table2). Without the application of lime, soil acidity will continue to increase, and it is expected that these responses will increase over time. One trial included an elemental sulphur treatment applied to reduce soil pH to demonstrate effects of increased soil acidity. Plant biomass as measured by NDVI on September 15 was lowest in this treatment, with the best treatments (PenLime Plus and Spalding lime) having a 5% higher NDVI value (data not shown).
Table 1. Lentil grain yield response for a range of sandy soil amelioration trials.
Location | Project Code (GRDC or SAGIT) | Year trial established | Lentil crop year | Response to deep rip ~50cm | Response to spading ~30cm | Response to chicken litter in addition to district practice fertiliser |
|---|---|---|---|---|---|---|
1. SARDI pulse agronomy –Bute | DAV00168BA: southern pulse agronomy | 2019 | 2019 | 0.7t/ha (127%) | NA | 5t/ha app 2019 = 0.19t/ha (63%) Nil background fertiliser applied. |
2. Validation trial –Warnertown | CSP00203: southern region sandy soils | 2019 | 2020 | Rip: 0.06t/ha (7%) Rip + IP: 0.15t/ha (16%) | 0.35t/ha (38%) | NA |
3. Soil acidity lime incorporation trial –Bute | DAS 1905-011TRX: addressing soil acidity in SA | 2019 | 2020 | Rip: 0.53t/ha (29%) Rip + IP: 0.74t/ha (41%) | 0.63t/ha (35%) | NA |
4. Uni SA soil acidity fellowship trial – Bute | USA103-002RTX: mixing uniformity and crop response | 2019 | 2020 | 0.07t/ha (8%) | 2km/h (multi-pass): -0.09t/ha (-10%) 5km/h: 0.04t/ha (4%) 9km/h: -0.01t/ha (-2%) | NA |
5. CSIRO soil amelioration –Bute Boundary Rd | CSP00203: southern region sandy soil | 2018 | 2020 | -0.05t/ha (-3%) | NA | 7.5t/ha = 0.48t/ha (25%) |
6. Long term soil amelioration –Bute | TC116: Increasing lentil productivity on dune and swale soils | 2015 | 2017 | 0.58t/ha (149%) | NA | 5t/ha app = 0.18t/ha (47%) 20t/ha app = 0.293t/ha (75%) 5t/ha app + rip = 0.84t/ha (216%) |
6. Long term soil amelioration –Bute | CSP00203: southern region sandy soils | 2015 | 2020 | 0.44t/ha (69%) | NA | 5t/ha app = 0.17t/ha (27%) 20t/ha app = 0.22t/ha (35%) 5t/ha app + rip = 0.67t/ha (106%) |
7. Lameroo 2020 | SA MDBNRM | 2020 | 2020 | 0.69t/ha (179%) | 0.66t/ha (172%) | NA |
8. Lameroo 2019 | 2019 | 2019 | 0.19t/ha (171%) | NA | NA | |
9. Kooloonong 2020 | SPA (DAV00150) | 2020 | 2020 | 0.71t/ha (97%) | NA | NA |
10. Kooloonong 2019 | SPA (DAV00150) / CSP00203 | 2019 | 2019 | 0.38t/ha (337%) | NA | NA |
11. Carwarp | CSP00203: southern region sandy soil | 2018 | 2018 | -0.05t/ha (-12%) | NA | NA |
2018 | 2019 | 0.04t/ha (19%) | NA | NA | ||
2018 | 2020 | 0.09 (13%) | NA | NA |
Table 2. Lentil grain yield response to lime application in a range of acidic sandy soil amelioration trials.
Location | GRDC Project | Year trial established | Lentil crop year | Starting pHca by depth increments of- 5cm from 0-30cm | Grain yield response to lime |
|---|---|---|---|---|---|
Soil acidity lime product trial - Bute | DAS 1905-011TRX: addressing soil acidity in SA | 2019 | 2020 | 6.1, 5.0, 4.8, 5.2, 5.6, 6.0 | 0.1 t/ha (4%) |
Soil acidity lime incorporation trial - Bute | DAS 1905-011TRX: addressing soil acidity in SA | 2019 | 2020 | 6.1, 5.0, 4.8, 5.2, 5.6, 6.0 | 0.14 t/ha (6%) |
Uni SA soil acidity fellowship trial – Bute | USA103-002RTX: mixing uniformity and crop response | 2019 | 2020 | 5.5, 5.0, 4.4, 4.6, 5.0, 5.6 | 0.02 t/ha (2%) |
Varieties
Across a range of lentil agronomic trials, treatments that increased crop growth on sandy soils of the northern Yorke Peninsula also increased lentil grain yield. This finding was confirmed in variety trials, where varieties with higher NDVI values at the flowering growth stage produced higher grain yield (Figure 2A), even though no other site-specific constraints were addressed. This contrasts with results from trials conducted on more loamy soils (Figure 2B) where increasing biomass was not correlated with increased grain yield. This finding suggests that the highest yielding variety on a heavier textured flat may be different to the highest yielding variety on a sand hill in the same paddock. The Willamulka NVT site is considered one of the lighter textured soil types within the suite of SA NVT lentil trials, yet by district standards it is a medium textured sandy loam flat. A four-year relative comparison of yield results from lentil variety trials on sandy soils across the northern Yorke Peninsula, to those from the Willamulka NVT and Melton PBA (loamy clay) lentil trials found that the highest yielding variety varies between the two groups (Figure 3). The high biomass later maturing variety PBA Ace was the highest yielding line from the sandy soils cluster of trials, some 4% higher than PBA Jumbo2. Whereas in the loamy soil cluster, PBA Ace was 3% lower yielding than PBA Jumbo2.
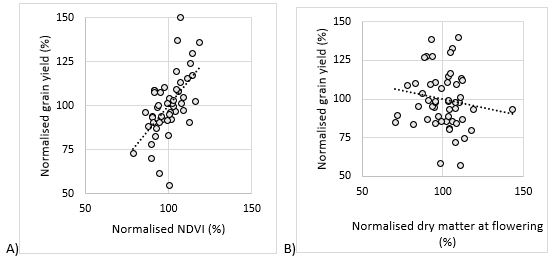
Figure 2. A) Normalised grain yield and NDVI at flowering data from lentil variety trials located on sandhills of the northern Yorke Peninsula from 2017-2020 (y = 1.1674x - 16.642, R² = 0.329). B) Normalised grain yield and biomass at flowering data from PBA breeding program located on loamy soils near Melton from 2012-2014 (source: PBA) (y = 0.2176x + 121.82, R² = 0.0143).
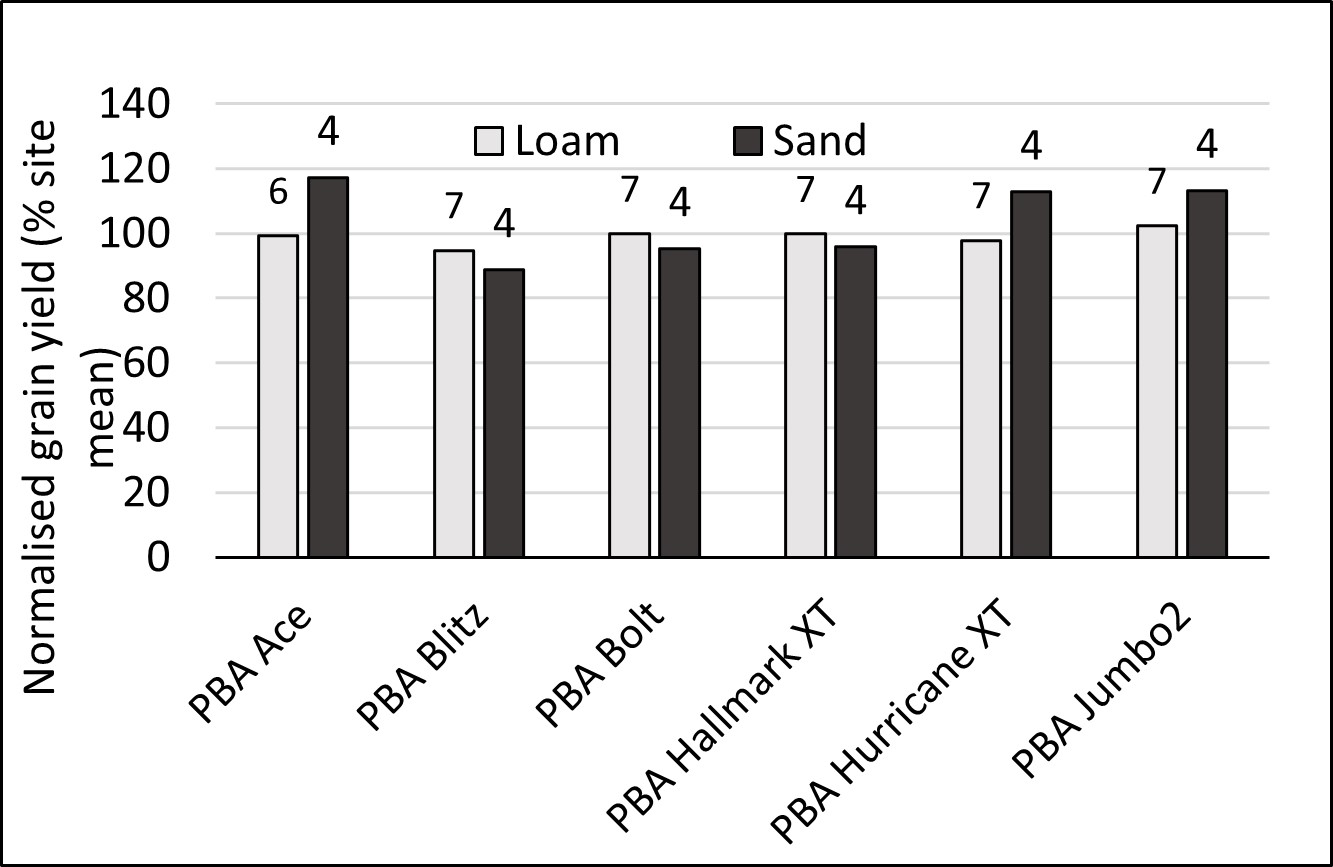
Figure 3. Average grain yield for selected commercial varieties as clustered by soil type for years 2017-2020 (Source: NVT Online, Willamulka NVT and Melton PBA yields used for loam cluster, sandy soil cluster yields from Trengove Consulting trials), number above bar shows number of trials variety is present.
Herbicides
Herbicide tolerance
Yield losses associated with herbicide damage in lentil trials on these sandy soil types have ranged from 0 – 58% for individual products and up to 75% for herbicide combinations over 8 trials conducted in 2015 and from 2017 to 2020. This has been measured in the absence of weeds, with any weeds surviving the herbicide applications controlled by hand weeding from mid-winter onwards.
The herbicide products used in these trials all have different chemical properties. However, the residual soil applied herbicides were particularly sensitive to rainfall patterns post application (Table 3). The solubility value of each herbicide affects the way it moves in the soil profile with low solubility herbicides such as diuron requiring higher amounts of rainfall to move them through the soil. However, highly soluble herbicides such as metribuzin move rapidly through the soil profile after relatively smaller rainfall events. The adsorption coefficient (how tightly the herbicide binds to organic matter) and the DT50 value (days of time for 50% of the herbicide to dissipate) also have impacts on how these herbicides respond in each season and soil type. The herbicide diuron has a high adsorption coefficient and relatively low solubility and was found to often be the safest group C herbicide at the rates applied (Table 4). The seasons in which these trials were conducted generally did not have large rainfall events post seeding and in different seasons results may vary.
The products and ranges of rates that were used in these trials were selected as they were found to be representative of use patterns on sandy soils in the region, and typically at the low end of the rate range recommended for group C herbicides on sands (Table 4). Despite the low use rates crop damage and yield loss was still observed at these sandy soil trial sites in some seasons. Various group C herbicides were trialled in combination with other group B and F herbicides across different trials (Figure 4, Table 6). To summarise the effect of these group C interactions, results have been bulked across group C products and referred to as Group C plus companion herbicide. Chlorsulfuron was applied at 5g/ha IBS to simulate residual carryover from the previous season (Note: the label rate is 15-25 g/ha for application to wheat, barley, oats, triticale, and cereal rye). However, it still caused significant yield loss in XT lentil varieties at these sites (Figure 4), therefore it is important for growers to recognise the heightened risk of SU residue effects on these soil types and avoid this use.
Herbicide products applied individually generally only showed low levels of crop damage and associated grain yield loss. In this series of trials, average yield loss for individually applied products was 9% compared to the untreated control (Figure 4). However, when multiple products were applied, greater levels of crop damage were observed. This is particularly the case with the soil residual herbicide chlorsulfuron where the application of group C herbicides in conjunction increased the yield loss to 50% on average. Similarly, the additional effect of Intercept where chlorsulfuron residues were present significantly increased damage with yield loss averaging 50%, whereas on its own at the rates applied Intercept® did not reduce grain yield (Figure 4).
Table 3. Pre-emergentherbicide properties for products used in the herbicide tolerance trials 2015 and 2017-2020. (Source: GRDC pre-emergent herbicide fact sheet).
Herbicide | Solubility (mg/L @ 20C) | Adsorption coefficient, Koc value | DT50 value (range in reported value) |
|---|---|---|---|
Diuron | 36 | 680 | 90 |
Terbuthylazine | 7 | 130 | 22 (6-149) |
Metribuzin | 1100 | 60 | 19 (14-28) |
Chlorsulfuron | 12500 | 40 | 36 (10-185) |
Table 4. Herbicide products used and rate ranges used in trials in 2015 and 2017-2020.
Product name | Herbicide active constituent | Herbicide group | Concentration | Rate range (mL or g/ha) | Application Timing |
|---|---|---|---|---|---|
Chlorsulfuron | Chlorsulfuron | B | 750g/kg | 51 | IBS 1 |
Intercept | Imazamox + imazapyr | B | 33g/L + 15g/L | 500 | Post-emergent |
Diuron | Diuron | C | 900g/kg | 550 - 825 | IBS or PSPE |
Metribuzin | Metribuzin | C | 750g/kg | 150 - 1802 | IBS or PSPE |
Terbyne | Terbuthylazine | C | 750g/kg | 500 – 7503 | IBS |
Brodal Options | Diflufenican | F | 500g/L | 150 | Post-emergent |
1Chlorsulfuron was applied IBS at 5g/ha to simulate residual carryover from application in the previous season (Note: the label rates is 15-25 g/ha for application to wheat, barley, oats, triticale, and cereal rye).
2 Note: the label rate for metribuzin is 180, 280 and 380 g/ha, dependent on soil type, and only applied as a post sowing – pre-emergent treatment.
3 Note: the label rate for Terbyne is 1000-1400 g/ha and is not recommended for use on light soils with less than 40% clay.
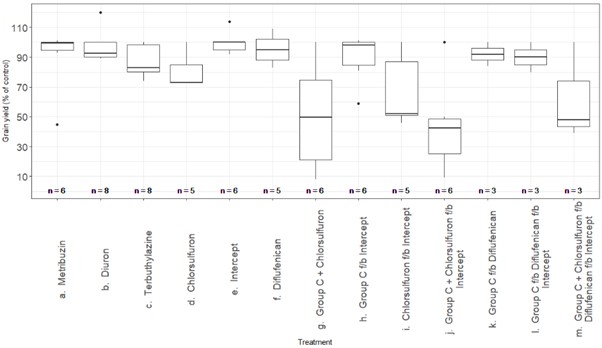
Figure 4. Grain yield presented as percent of control treatments for individual and product mixtures/sequences in the herbicide tolerance trials from 2015 and 2017-2020 on sandy soils.
Weed control
Individual herbicides
- Metribuzin at the range of rates applied produced the poorest weed control of the group C herbicides across all weeds assessed (Table 6).
- Control of Indian Hedge Mustard (IHM) with Intercept® was highly variable, and likely represents the presence of imidazolinone herbicide resistance in some IHM populations across the region. Despite imidazolinone resistance now reported in sow thistle in the district, average control of 79% was seen as a relatively good result.
- Diflufenican (DFF) provided good control of the brassica weeds IHM and wild turnip.
Herbicide combinations
- Combinations of herbicides improved weed control compared to the same herbicides applied alone.
- Group C herbicides followed by DFF gave 100% control of IHM and wild turnip and good control of medic (82%) and sow thistle (94%).
- Group C herbicides followed by Intercept® provided 85% or better weed control of all four weed species.
- Group C herbicides followed by DFF followed by Intercept® averaged greater than 94% control of all weeds.
Table 6. Weed control of Indian hedge mustard (Sisymbrium orientale), burr medic (Medicago polymorpha), common sow thistle (Sonchus oleraceus), and wild turnip (Brassica tournefortii) for different herbicide products and sequences in lentil herbicide trials on sandy soils across the northern Yorke Peninsula.
Herbicide product(s) | % weed control (# samples) range | |||||||||||
|---|---|---|---|---|---|---|---|---|---|---|---|---|
IHM | Medic | Sow thistle | Wild turnip | |||||||||
Metribuzin1 | 58 | (4) | 29-82 | 28 | (5) | 0-76 | 45 | (6) | 16-69 | 62 | (5) | 50-83 |
Diuron2 | 85 | (4) | 74-97 | 40 | (5) | 0-70 | 76 | (6) | 50-94 | 70 | (5) | 52-94 |
Terbuthylazine3 | 92 | (4) | 83-100 | 63 | (5) | 36-82 | 81 | (5) | 61-96 | 85 | (5) | 78-100 |
Intercept4 | 59 | (3) | 0-91 | 56* | (4) | 0-88 | 79 | (5) | 61-88 | 96 | (4) | 88-100 |
Diflufenican5 (DFF) | 97 | (2) | 95-100 | 56 | (2) | 34-78 | 59 | (3) | 0-94 | 80 | (2) | 63-97 |
Group C f/b Intercept | 85 | (3) | 62-97 | 86* | (4) | 71-94 | 92 | (5) | 63-100 | 87 | (4) | 74-100 |
Group C f/b DFF | 100 | (2) | 100-100 | 82 | (2) | 74-90 | 94 | (3) | 88-100 | 100 | (2) | 100-100 |
Group C f/b DFF f/b Intercept | 99 | (2) | 99-100 | 94* | (2) | 92-96 | 95 | (3) | 84-100 | 100 | (2) | 100-100 |
1 Note: metribuzin is not registered for medic control.
2 Note: diuron is not registered to control Indian hedge mustard, medic, or sow thistle.
3 Note: terbuthylazine is not registered to control Indian hedge mustard, medic, sow thistle or wild turnip.
4 Note: Intercept is not registered to control medic or sow thistle.
5 Note: diflufenican is not registered to control medic or sowthistle.
* In most cases surviving medic plants were severely stunted and not competitive.
Nutrition
Chicken litter increased yield in four amelioration trial years (Table 1), as discussed previously. Tissue testing at site six (Table 1) in 2017 revealed elevated levels of phosphorus (P), potassium (K), calcium (Ca), magnesium (Mg), sulphur (S), copper (Cu), manganese (Mn) and molybdenum (Mo), in lentil whole tops compared with the control treatment, indicating chicken litter was supplying a broad range of nutrients. A trial with matched application rates of the macronutrients N, P, K, S and micronutrients Zn, Cu & Mn as synthetic fertiliser sources also elevated tissue test levels of P, K, S, Cu, and Mn but did not increase yields. Due to the differences in Mo levels between chicken litter and synthetic fertiliser treatments it was hypothesised that this may have been a significant deficiency on the acidic sand at this site (0-10cm pH 5.2 CaCl2). Nutrition trials were run from 2017-2020 on both alkaline and acidic sands in the region. These trials included the addition and omission of a range of essential plant nutrients. While elevated levels of some nutrients were again measured in tissue tests, no unique nutrition constraints were identified that led to improved yield.
Molybdenum on acidic sands
In 2019 and 2020 post-emergent molybdenum trials on slightly acidic sands were conducted with pH of 5.8 CaCl2 and 5.9 CaCl2 0-10cm, respectively. Nine treatments ranging from 0 – 400 g/ha sodium molybdate, applied over two timings, early July and mid-August were evaluated. In both seasons strong visual plant growth responses were observed within two weeks of treatment and resulted in increased NDVI values. This also resulted in increased grain yields of 43% and 21% for 2019 and 2020, respectively. In both seasons there was no benefit from increasing the rate of sodium molybdate above 25 g/ha and timing had no impact (data not presented).
Biomass and yield
Across a suite of 24 trials on sandy soils of the northern Yorke Peninsula a consistent positive linear relationship between biomass at flowering (using Greenseeker NDVI as a biomass surrogate) and grain yield has been established. This is consistent with work by Lake and Sadras (2021) experimenting with 20 lentil lines varying in seed type and phenology in eight environments. They found yield correlated with biomass and crop growth rate in more stressful conditions, where yields were less than 1.07t/ha. However, they also found this relationship decoupled in more favourable conditions where yields exceeded 1.7t/ha. In these favourable conditions’ excessive vegetative growth can lead to self-shading, reduced pod and seed set, low harvest index and higher risk of disease and lodging (Lake and Sadras, 2021). The results presented in this update paper suggest the physical and chemical constrained sandy soils of the northern YP are also plant biomass constrained, where any treatment that overcomes some or all these constraints, increases both biomass and yield. However, it is also possible that this relationship decouples on the heavier textured soils within the same paddocks where biomass is not a constraint to yield.
Conclusion
There are four main steps and considerations when planning to increase the reliability of lentil production on sandy soils identified in this study. The first step is to identify and overcome any soil physical and chemical constraints that limit crop growth and biomass, through the use of soil amelioration techniques. The second step is selecting a suitable high biomass variety such as PBA Ace, PBA Hurricane XT or PBA Jumbo2. This decision needs to factor in the presence of any other soil types within the paddock. The third step is the selection of appropriate herbicides for the situation which should be based on the variety to be grown, soil types, soil moisture content and probable three day forecast at the time of application, the main weed targets and the level of escapes that are deemed acceptable as 100% control may come at a cost in yield reduction. The final step is correcting any nutritional deficiencies that may be present. Further gains on these soils are realistic through breeding improvements in varieties with higher plant biomass and improved Group C herbicide tolerance.
Acknowledgements
The research undertaken as part of this project is made possible by the significant contributions of growers through both trial cooperation and the support of the SAGIT (Projects TC116 and TC119) and GRDC, the author would like to thank them for their continued support. The authors also acknowledge the valuable input from Larn McMurray during these projects and data supplied by Frontier Farming Systems for Mallee specific trials.
References
Lake, L. and Sadras, V.O., (2021). Lentil yield and crop growth rate are coupled under stress but uncoupled under favourable conditions. GRDC project code 9176630.
Contact details
Sam Trengove
Trengove Consulting, Bute SA
Phone 0428262057
samtrenny34@hotmail.com
@TrengoveSam
Varieties displaying this symbol beside them are protected under the Plant Breeders Rights Act 1994
GRDC Project Code: DAV168BA, CSP1606-008RMX, DAS1905-011TRX, USA103-002RTX, DAV1706-003RMX,