A sub-paddock tool (Soil Water Nowcasting) to estimate PAW at depth across the paddock by incorporating different data layers
Author: Niranjan Wimalathunge, James Moloney and Tom Bishop (Precision Agriculture Laboratory, Sydney Institute of Agriculture, The University of Sydney) | Date: 24 Feb 2022
Take home message
- An approach for predicting soil water using a water balance model driven by nationally available geospatial data is presented
- Relative trends in soil water can be predicted at the within-paddock scale
- The absolute value of soil water in mm is less well predicted with the hypothesised reason being national-scale digital soil maps used to estimate the soil water bucket size are causing much of the errors
- The model can be calibrated with local soil moisture probes to improve predictions and overcome errors in the estimate of the soil water bucket size
- On-farm data whether moisture probes and/or spatial estimates of bucket size will improve the model predictions
Introduction
This project is funded by the GRDC and called ‘Soil water nowcasting for the grains industry’. It is led by the University of Sydney in a collaboration with CSIRO, University of Southern Queensland, Australian National University and the Bureau of Meteorology. It aims to deliver a scientific framework to estimate plant available water (PAW) in real time (nowcast) at the sub-paddock scale. The approach is based on remotely sensed digital data with use made of a range of current data sources and the capacity to make use of next generation data sources. The project will test, develop and refine data assimilation processes, mechanistic and data driven soil water balance modelling to predict PAW using the combined expertise of the five different research organisations and strong collaborations with grower networks and industry.
In this paper we present the underlying model that is deployable anywhere in Australia using freely available data. We present quality of the fit for the model and present options for calibration. We illustrate its use with 2 applications (i) on-farm 30 m spatial resolution estimates of soil water (ii) 500 m spatial resolution estimates of soil water for the Murray-Darling Basin.
The water balance model
To simulate the movement of water between soil layers, a modified version of a soil water balance model described in Wimalathunge and Bishop (2019) was used which can be represented as:
∆S = R + I – ET – DD – RO;
where S = soil water, R = precipitation, I = irrigation, ET = evapo-transpiration, DD = deep drainage and RO = runoff, ∆ = Delta, change
The soil water bucket size determines the partitioning between RO, DD and soil water. In the approach implemented here, the bucket size is estimated from particle size fractions and organic carbon. The model represents the soil profile with five soil layers bounded by the standard depths from the Soil Landscape Grid Australia (SLGA) of 0-5, 5-15, 15-20, 30-60 and 60-100 cm. This can be modified depending on the underlying soil data. Table 1 shows examples of model inputs that are available nationally and are publicly available, and possible local or on-farm alternatives.
Table 1. Data inputs for model.
Input | National (publicly available) | Local (on-farm) |
|---|---|---|
Soil bucket size | Bureau of Meteorology (5km grid) | Farm soil maps |
Precipitation | Soil Landscape Grid of Australia (90m grid) | Weather station |
Evapo-transpiration | MODIS ET (MOD16) (500m raster) | Weather station |
The model operates on a daily timestep and can be deployed anywhere in Australia using the national data in Table 1. The model can be run with default parameters related to rooting depth and conductivity between soil layers or these can be calibrated based on local soil moisture data, typically from moisture probes.
Model quality
To test the model quality we have applied it to 6 sites from OzNet hydrological monitoring network which was established in 2001. The sites are located near Wagga Wagga under cropping and grazing systems. Across the sites the soil has a clay content of 15-30% in the topsoil and the 35-40% in the subsoil. The probes have been field calibrated allowing for testing of the model in terms of its accuracy in mm of soil water and its ability to estimate general trends which we assess with the correlation coefficient. In this paper we test the version of the model which uses national inputs as described in Table 1.
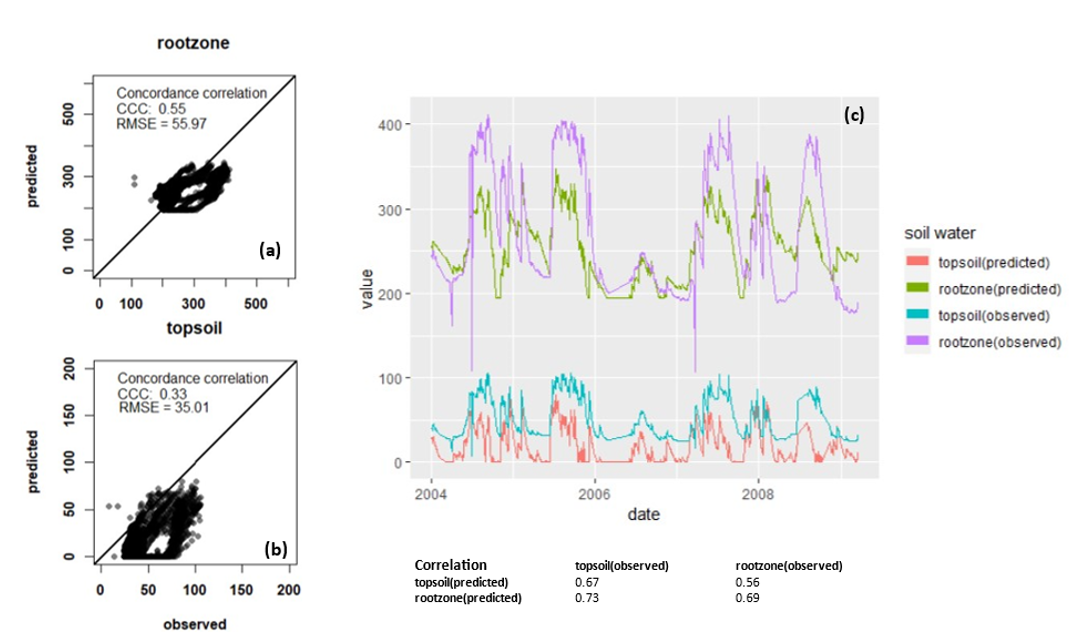
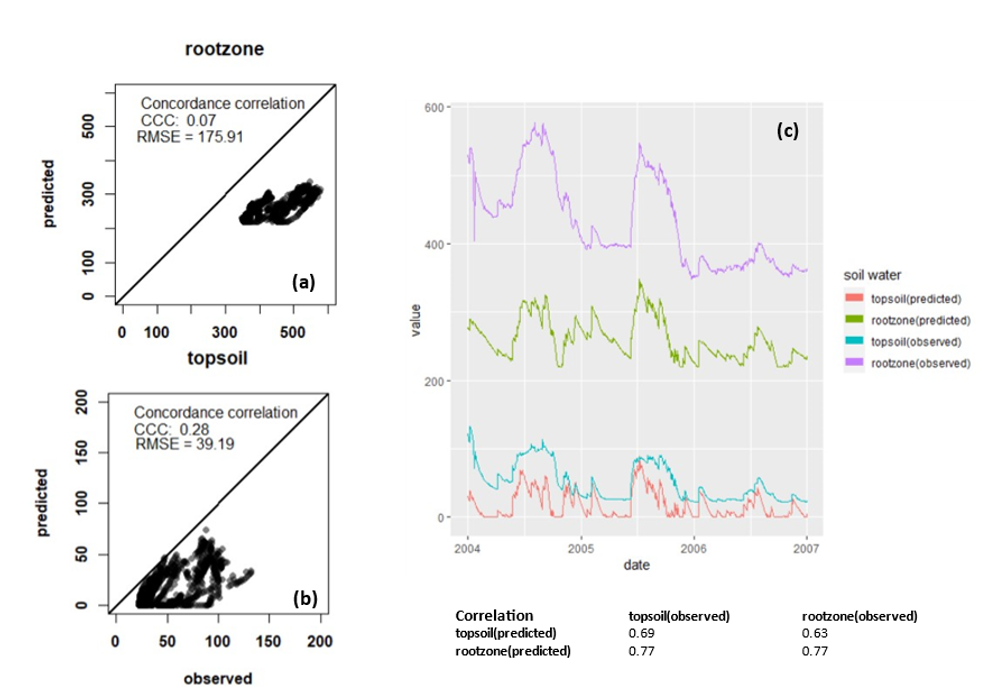
Across the 6 sites the correlation between observed and predicted ranged from 0.57-0.67 (mean = 0.66) for the 0-30 cm layer and from 0.48-0.77 (mean = 0.68) for the whole profile which is from 0-100 cm. This means that the predictions are a reasonable representation of the general trends in the observed data. In terms of predicting soil water in mm the accuracy ranged from 22-58 mm (mean = 34 mm) for the 0-30 cm layer and from 33-176 mm (mean = 78 mm) for the whole profile (0-100 cm).
Figure 1 and 2 show examples of sites where both sites are predicted well in terms of the general trend as evidenced by the high and lows matching. This is also shown by the correlation values which are generally around 0.6. However, in terms of predicting actual soil water the performance is not as good with clear differences between the time series traces of predicted and observed soil water. This is most noticeable in Figure 2 with the hypothesised reason being that the estimate of the soil water bucket size is incorrect meaning there is bias in the predictions.
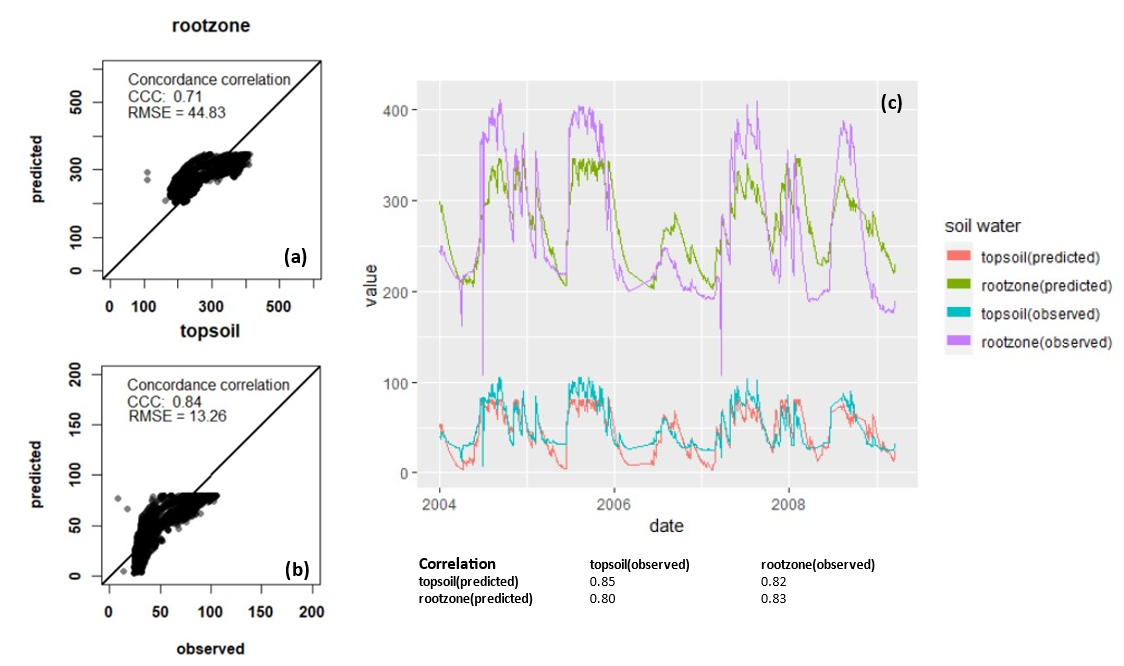
When we calibrate the model to the soil moisture probes we found that the correlations were similar and they ranged from 0.42-0.85 (mean = 0.72) for the 0-30 cm layer and from 0.26-0.83 (mean = 0.67) for the whole profile (0-100 cm). As expected the accuracy improved with calibration and ranged from 13-33 mm (mean = 22 mm) for the 0-30 cm layer and from 21-128 mm (mean = 55 mm) for the whole profile (0-100 cm).
Figure 3 and 4 presents results for when we calibrate the model and illustrate two important points. The first is that calibration improves the predictions in terms of their accuracy and correlation when the estimate of the bucket size is reasonable as shown in Figure 3. When the bucket size is too poorly predicted the model parameters cannot be changed enough to overcome this constraint as shown in Figure 4 where the model predictions reach a “ceiling’. While the parameters can be changed to make the model more accurate overall this results in prediction of a mean value for parts of the time series meaning the correlation is worse.
Applications
While we continue to work on the underlying the model and improve the inputs, an important outcome of the project is that the approach is scalable to the nation and modular in that users can provide their own data. Here we show 2 applications.
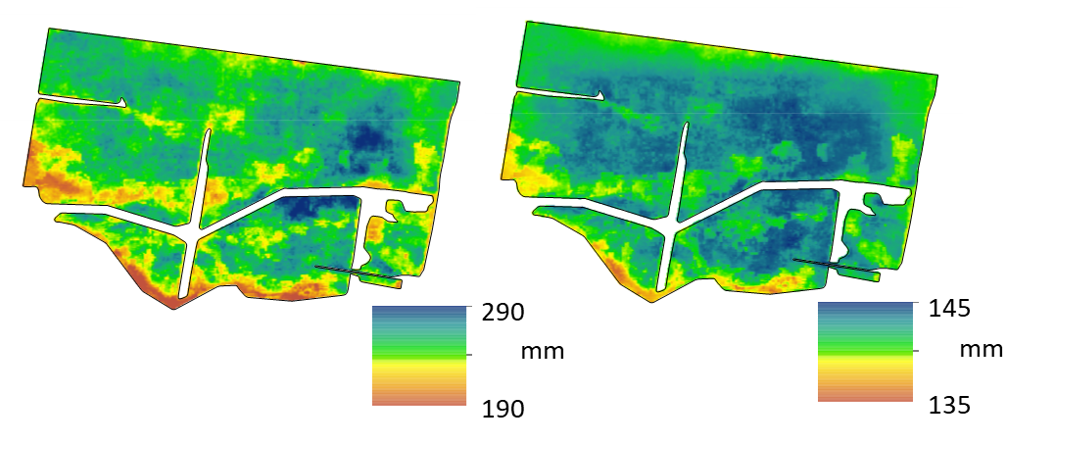
The first application is where we have applied the model to a 5000 hectare farm in northern NSW where the grower has invested in developing a digital soil map of their farm in terms of the bucket size. Here we show soil water and plant available water (PAW) where PAW is the amount of soil water between the crop lower limit and the drainage upper limit (Figure 5). This is estimated from a particle size and carbon soil samples using a pedo-transfer functions specific to Vertosols.
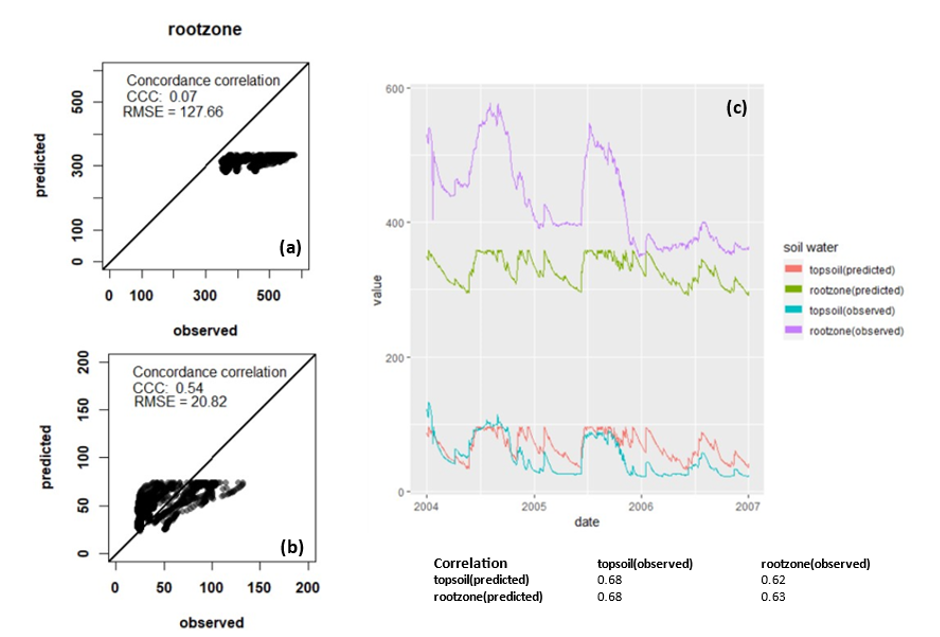
Figure 5 shows that much of the stored soil water across the farm is not accessible by the plants.
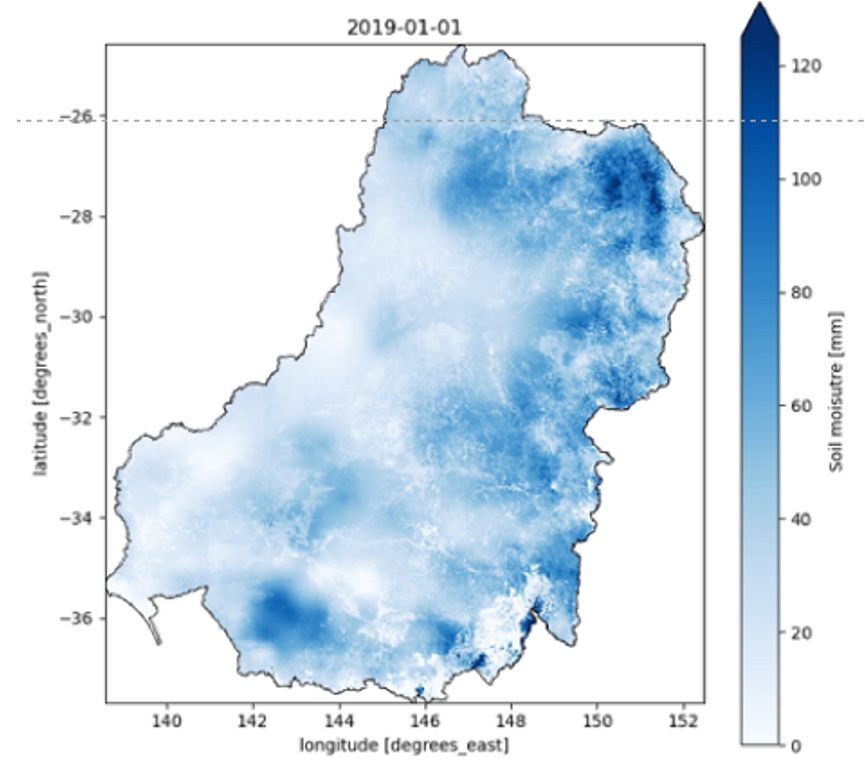
The second application is an estimate of plant available water for the Murray-Darling Basin for which we have created a prototype data product at 500 m on a daily time step for 2000-2020. Figure 6 shows a map of PAW for 0-100 cm for January 1st 2019 as an example. The model was deployed on Gadi, one of the high performance computers available to researchers as part of our national computational infrastructure (NCI). The deployment for the MDB was a test case to assess the feasibility of deploying the model over large regions in terms of the compute time and the actual cost of the processing power and data storage requirements. The initial results from this are pleasing in terms of their cost-efficiency and we are now looking to update the data product to be (i) more real-time (ii) include all cropping regions in Australia (iii) give predictions at a finer spatial resolution. We are also planning on releasing a web-based dashboard of the soil water predictions so growers can zoom into their farm to examine the model predictions in more detail.
Conclusions
Based on this work, the current water balance model can predict the relative patterns of soil moisture quite well but is more inconsistent when predicting absolute values in mm of soil water. This means that generally we can help growers determine highs and lows quite well but are not quite there for using the predictions of mm soil water for direct decision support, for example to estimate potential yield using water-use efficiency equations. The biggest source of errors seems to be from the underlying estimates of the bucket size, which carry through to the calibrated model. Further work is needed to confirm this. Concurrent work in this project undertaken by CSIRO is improving the bucket size estimates from the Soil-Landscape Grid of Australia (SLGA) for the cropping regions of Australia. It should also be noted that growers could invest in developing digital soil maps of their farms and not have to rely on national soil datasets such as the SLGA. This could be as farm-specific maps or ones developed by grower groups or consultants for small regions.
We now have the workflow developed to deploy the model across large regions at a moderate spatial resolution (500) and over farms at a high spatial resolution (30 m). We can do this with different combinations of national and on-farm equivalents as shown in Table 1. We are now interested in getting feedback on the model predictions from growers. As part of this process we will deploy the model on your farm at a 30-90 m spatial resolution and ask for feedback in the form of a short survey and/or comparison with other on-farm data such as crop yield maps, moisture probes etc.
If interested please contact the project lead, Tom Bishop whose contact details are below.
References
Wimalathunge N and Bishop T (2019) A space-time observation system for soil moisture in agricultural landscapes. Geoderma, 344, pp.1-13.
Acknowledgements
The research undertaken as part of this project is made possible by the significant contributions of growers through both trial cooperation and the support of the GRDC, the author would like to thank them for their continued support. We thank the researchers led by Professor Walker at Monash University who made the calibrate probe network used in this work openly available for researchers. Furthermore we thank Sergio Pintaldi at the Sydney Informatics Hub, The University of Sydney who optimised our mode code and deployed the model on HPC. Finally, we thank Precision Cropping Technologies and Viridis Ag for their on-going collaboration and access to the soil data used to create the soil water maps in Figure 5.
Contact details
Tom Bishop
Precision Agriculture Laboratory, Sydney Institute of Agriculture, The University of Sydney
Biomedical Building, Australian Technology Park, Eveleigh NSW 2015
Ph: 0405 023 457
Email: thomas.bishop@sydney.edu.au
GRDC Project Code: UOS2002-002RTX,
Was this page helpful?
YOUR FEEDBACK
