Advances in controlling brome and barley grass
Advances in controlling brome and barley grass
Author: Gurjeet Gill and Ben Fleet (University of Adelaide) | Date: 10 Feb 2022
Take home messages
- Our research has shown large differences in seed dormancy between brome and barley grass populations. High seed dormancy populations are more difficult to control with pre-sowing knockdown herbicides and delayed crop sowing.
- Brome grass seedbank tends to persist for three years and barley grass for two years. Therefore, single year management programs are unlikely to prevent rebound in populations of these weeds.
- Presence of resistance to group 1 (A) herbicides is still relatively low but in some regions resistant populations have been responsible for control failures.
- Integration of higher crop densities (seed rate) with effective herbicide options has been consistently successful in minimising crop yield loss and reducing weed seed set of brome grass.
Aims
- To identify weed traits responsible for increasing incidence of brome and barley grass in cereal crops in southern Australia.
- Quantify benefits of integrating non-chemical tactics such as sowing time and crop density with herbicides to improve weed control.
Introduction
Brome grass has climbed to be the fourth worst weed of grain crops in Australia in terms of the area infested, as well as yield and revenue loss (Llewellyn et al. 2016). Barley grass has also increased in importance to become one of the top 10 weeds of Australian cropping. In this survey, barley grass was ranked as the seventh most costly weed to control by the growers in SA and VIC Mallee and Mid-North, Lower Yorke and Eyre Peninsula. Given the increasing importance of these two grass weeds, it is important not only to understand why they have been increasing in grain crops but also to determine how they could be managed more effectively. Research on understanding biological factors responsible for increasing incidence of these weeds has focused on changes in seed dormancy in response to cropping intensity and persistence of their seedbank. Research is currently underway to determine how integration of non-chemical factors could be used to enhance weed control with herbicides.
Method
Seed dormancy
Barley grass populations from the low rainfall zones in New South Wales, Victoria, South Australia and Western Australia were collected during the summer of 2018. In this random survey, a total of 143 samples were collected from grower paddocks in this region. Seeds of barley grass samples were removed from panicles and sown by weight (2g per tray) into seedling trays filled with potting mix in the first week of April. Seedling trays were placed outdoors at Roseworthy (SA) to experience natural rainfall and temperature conditions. There were 2 replicates of each barley grass population. Weed seedlings were counted and removed throughout the growing season in order to determine seedling emergence pattern (that is, dormancy). Cumulative seedling emergence data were analysed in GraphPad Prism. An identical experimental approach was used to assess differences in seed dormancy between in-crop and non-crop populations of brome grass collected from growers’ fields in 2015.
Seedbank persistence
Seeds of barley grass and brome grass populations were placed in soil in micro-plots and seedling emergence was recorded regularly in subsequent seasons. Field sites for seedbank persistence were established at Karoonda (low rainfall), Roseworthy (medium rainfall) and Tarlee (high rainfall). Absence of new weed seedling emergence for the whole growing season was considered an indication of complete exhaustion of the weed seedbank.
Herbicide resistance
Barley grass populations (n=143) collected from the low rainfall zones in New South Wales, Victoria, South Australia and Western Australia in the summer of 2018 were tested for resistance to all major groups of herbicides used for selective and non-selective weed control. Herbicides were used at the recommended field rate. This included quizalofop and clethodim (group 1 (A)), imazamox + imazapyr (group 2 (B)), glyphosate (group 9 (M)) and paraquat (group 22 (L)). Plants that produced new growth after herbicide treatment were rated as resistant to that herbicide.
Brome grass management
Each year since 2018, three field trials have been undertaken to investigate the effect of crop sowing time, seed rate and herbicide treatments on brome grass control, weed seed set and crop yield. In this paper, we have presented results of two field trials were undertaken in SA in 2019 to investigate brome grass management in Razor CL Plus Clearfield® wheat (Table 1).
Table 1: Management information for brome grass trials undertaken in 2019.
Detail | Mallala | Riverton |
|---|---|---|
Crop (variety) | Wheat (Razor CL Plus) | Wheat (Razor CL Plus) |
Sowing date | TOS 1: 16 May 2019 TOS 2: 31 May 2019 | TOS 1: 16 May 2019 TOS 2: 31 May 2019 |
Crop seed rate | 100, 150 or 200 seeds/m2 | 100, 150 or 200 seeds/m2 |
Herbicides | 1. TriflurX® 2L/ha + Avadex® Xtra 2L/ha 2. Sakura® 118g/ha + Avadex Xtra 2L/ha IBS 3. TriflurX 2L/ha + Avadex Xtra 2L/ha fb Intervix® 750mL/ha post | 1. TriflurX 2L/ha + Avadex Xtra 2L/ha 2. Sakura 118g/ha + Avadex Xtra 2L/ha IBS 3. TriflurX 2L/ha + Avadex Xtra 2L/ha fb Intervix 750mL/ha GS14 |
Growing season rainfall (mm) | 229 | 267 |
Active ingredients: Sakura = 850g/kg pyroxasulfone; Avadex Xtra = 500g/L triallate; TriflurX = 480g/L trifluralin; Intervix = 33g/L imazamox + 15g/L imazapyr time of sowing (TOS); incorporated by sowing (IBS); growth stage (GS); followed by (fb)
Results
Seed dormancy
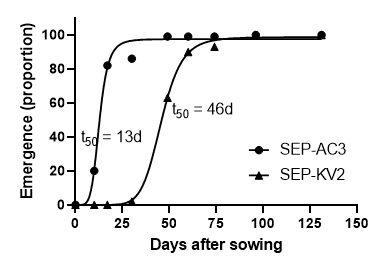
Based on extensive research over the last 10 years, it is clear that higher cropping intensities select for greater seed dormancy. Initial evidence for this trend emerged in brome grass collected from fence lines and adjacent cropping fields at Warner Town in SA. Since then, further research has confirmed similar trends in many other brome grass and barley grass populations. Essentially, all weed populations possess individuals with different levels of seed dormancy (that is, genetic variation). Management systems (for example, cropping) that effectively kill early germinating weeds (low dormancy) tend to increase seed dormancy in weed populations. Conversely, systems that allow all individuals to survive and set seed (for example, pastures or fence lines) maintain lower levels of seed dormancy. Results from one of our recent studies can be used to highlight this principle. Recently, we identified two barley grass populations with contrasting seed dormancy from Upper Eyre Peninsula. Population SEP-AC3 came from a paddock with low cropping frequency whereas SEP-KV2 was from a paddock with high cropping frequency (Figure 1). These populations showed more than three-fold difference in time required for 50% seed germination (13 days vs 46 days). These results clearly show how management practices within a region can have a large influence on seed dormancy of weed populations. From a practical viewpoint, populations with high seed dormancy will have a slow and staggered weed establishment, which will reduce effectiveness of pre-sowing knockdown herbicides and possibly of some pre-emergent herbicides as well.
Figure 1. An example of contrasting seed dormancy in two barley grass populations collected from the Eyre Peninsula of SA in 2018. Time taken to 50% seedling emergence (t50) was 13d in SEP-AC3 and 46d in SEP-KV2. Large differences in seed dormancy within the same region are likely to be related to differences in weed management practices between the two paddocks.
As a group, populations from the southern plains of New South Wales (NSP) were the quickest to germinate and emerge due to low seed dormancy (t50 = 8.9 ± 1.08d). This is in contrast to barley grass populations from the Upper Eyre Peninsula in SA (SEP), which had the highest t50 (32.6 ± 3.17d). The average t50 for the other regions ranged from 13.2d for the central plains of New South Wales (NCP) to 18.5d for the populations from the Victorian and SA Mallee. The average t50 for WA populations ranged from 13.8 to 17.7d. Within most of the regions, there were sizable differences between the least and the most dormant populations. Therefore, management practices used in the paddocks where these samples were collected also appears to have influenced the seed dormancy status of barley grass.
Seedbank persistence
Brome grass
Field studies at three different locations in SA showed that the brome grass seedbank can persist for three years even though most of the seedling establishment occurs within the first year after seed dispersal. Karoonda SA, with sandier soils and a lower rainfall, showed greater persistence of the initial seedbank into the second and third year than sites with greater rainfall and heavier textured soils (Roseworthy and Tarlee SA). Similar pattern of seedbank persistence was observed at Wongan Hills WA. These results are consistent with previous studies which showed that a 3-year effective management program can deplete field populations of this weed species.
Barley grass
Seedbank persistence of barley grass was investigated in SA at three field sites (Karoonda, Roseworthy and Tarlee). At the site with the highest rainfall (Tarlee), barley grass emergence only occurred in year one, which indicates that remaining seed had decayed by the second growing season. At Roseworthy (medium rainfall), there was only 0.2% emergence from the initial seedbank in year two and no emergence was observed in year three and four. Karoonda, which has the lowest rainfall out of the three SA sites, showed much greater seedling emergence in year two (12%) than the other two sites. Even at Karoonda, there were no barley grass plants observed in year three and four of this study. Therefore, the barley grass seedbank in SA appears to be completely exhausted after two years. These results are consistent with the results from WA, where most of the seedlings at these sites emerged in year one. However, there was some barley grass establishment observed in WA trials even after three to four years. These results again highlight the difficulty in completely exhausting weed seedbanks in a single year and the need for a two-year management program incorporating rotations and herbicides.
Herbicide resistance
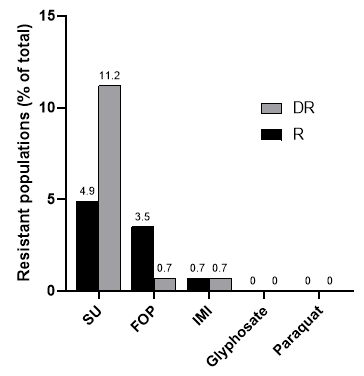
All populations of barley grass collected in NSW and Victoria were susceptible to the four herbicide groups used in the resistance screening (Figure 2). However, some samples from SA and WA showed resistance to group 1 (A) and 2 (B) herbicides. Resistance to the SU herbicide Atlantis® OD was identified in 16.1% of the populations tested. The presence of resistance to the imidazolinone herbicide Intervix was relatively low (1.4%). Resistance to the FOP herbicide quizalofop (Leopard®) was detected in 4.2% of the barley populations tested. Four of these populations came from the Upper Eyre Peninsula in SA and two from WA. Survivors of this herbicide were vigorous and showed no inhibition in growth. There is no doubt that presence of resistance to group 1 (A) and 2 (B) herbicides in the southern and western region will complicate management of barley grass in break crops and pastures. There was no resistance detected to glyphosate or paraquat in barley grass samples in this survey. However, a subsequent survey in 2021 has identified populations with resistance to paraquat and glyphosate.
Figure 2. Detection of resistance to different herbicide groups in a random survey of barley grass (n=143). SU = Atlantis OD (group 2 (B)); IMI = Intervix (group 2 (B)); FOP = quizalofop (Leopard, group 1 (A)); Glyphosate = Weedmaster® DST® (group 9 (M)); Paraquat = Para-Ken (group 22 (L)). R = resistant (>20% survival) and DR = developing resistance (6-19% survival).
Based on resistance testing of barley grass over the last three years, it can be stated that the overall level of herbicide resistance is still low but there are some regions such as Upper Eyre Peninsula where resistance levels are higher than other regions. However, herbicide resistant populations were also detected in WA and VIC. Similarly, herbicide resistance in brome grass remains at a much lower level than in annual ryegrass. However, some populations with resistance to group 1 (A), 2 (B) and 9 (M) have already been identified. Therefore, growers facing unexpected herbicide failures should send their seed samples to commercial laboratories for resistance testing.
Brome grass management
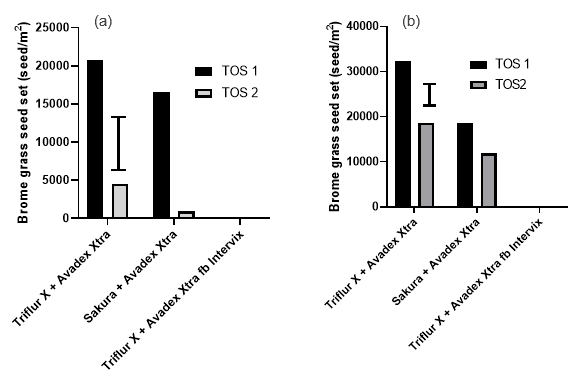
A two-week delay in sowing reduced brome grass density by 82% at Riverton as compared to a 38% reduction at Mallala. As both sites received very similar rainfall during the month of May, the differences in effectiveness of delayed sowing in controlling brome grass are likely to be associated with seed dormancy in these two populations. At Riverton, delay in crop sowing by two weeks reduced brome grass seed set by 76% for TriflurX + Avadex Xtra and 93% for Sakura + Avadex Xtra treatments. TriflurX + Avadex Xtra fb Intervix completely prevented brome grass seed set in both times of sowing (Figure 3a). Similar effects of delayed sowing on herbicide efficacy on brome seed set were also observed at Mallala (P=0.026) (Figure 3b). Considering the current low levels of resistance in brome grass to imidazolinone herbicides (P. Boutsalis, pers. comm.), Clearfield® systems are an attractive option for brome grass management, especially in cereal crops in Australia, and should be carefully integrated into the management plan.
Figure 3. The effect of crop sowing time and herbicide treatments on in-crop brome grass seed production at Riverton (a) and Mallala (b). TOS 1 = 16 May and TOS 2 = 31 May. The error bars represent Lsd (P=0.05).
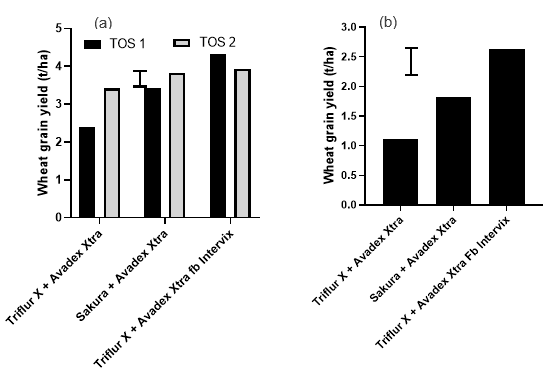
In TOS 1 at Riverton, when Intervix (POST) was applied after TriflurX +Avadex Xtra IBS (2.39t/ha), wheat grain yield increased by 45% to 4.32t/ha (Figure 4a). The comparison of the same treatments in TOS 2 showed only 15% increase in wheat grain yield from 3.42t/ha to 3.93t/ha. The large difference in brome grass plant density in the TriflurX +Avadex Xtra IBS treatment between TOS 1 and TOS 2 (Figure 3) is the most likely reason for these yield responses. As brome grass was almost completely controlled in TriflurX + Avadex Xtra fb Intervix (Figure 2), comparison of TOS 1 and TOS 2 for this treatment provides an indication of the yield penalty from delayed sowing. Wheat yield for this herbicide treatment was 4.32t/ha for TOS 1 as compared to 3.93t/ha for TOS 2, which equates to 9% yield penalty (Figure 4) or 130kg/ha/week.
Figure 4. The effect of crop sowing time and herbicide treatments on wheat grain yield at Riverton (a) and effect of herbicide treatments on wheat yield at Mallala (b). As there was no interaction between herbicides and sowing time, average yield of the two sowing times is presented for Mallala. TOS 1 = 16 May and TOS 2 = 31 May. The error bars represent LSD (P=0.05).
Herbicide treatments also had a significant effect on wheat grain yield at Mallala (Figure 4b). The treatment of TriflurX + Avadex Xtra produced a wheat yield of only 1.11t/ha, which was significantly lower than the wheat yield in herbicide mixture of Sakura + Avadex Xtra (1.81t/ha). However, when Intervix post-emergence herbicide was used, wheat yield increased further to 2.63t/ha. In this trial, integration of Clearfield® technology with pre-emergent herbicides not only prevented brome grass seed set (Figure 3), but it also produced the highest grain yields (Figure 4b).
Conclusion
Our research has shown large differences in seed dormancy between brome and barley grass populations, which can have a large effect on the performance of pre-sowing weed control and success of delayed crop sowing for weed control. Growers are often unaware of seed dormancy status of their weed populations but careful observation of paddocks for weed emergence after the opening rains can be helpful in ranking paddocks for seed dormancy. Other factors that can influence success of weed management include seedbank persistence and herbicide resistance status. A brome grass seedbank tends to persist for three years and barley grass for two years. Therefore, single year management programs are unlikely to prevent rebound in populations of these weeds. Integration of higher crop densities (seed rate) with effective herbicide options has been consistently successful in minimising crop yield loss and reducing weed seed set of brome grass.
Acknowledgements
The research undertaken as part of this project is made possible by the significant contributions of growers through both trial cooperation and the support of the GRDC, the author would like to thank them for their continued support.
References
Llewellyn RS, Ronning D, Ouzman J, Walker S, Mayfield A and Clarke M (2016) Impact of Weeds on Australian Grain Production: the cost of weeds to Australian grain growers and the adoption of weed management and tillage practices Report for GRDC. CSIRO, Australia.
Contact details
Ben Fleet
The University of Adelaide
Roseworthy Campus, Roseworthy SA 5371
08 8313 7950
benjamin.fleet@adelaide.edu.au
GRDC Project Code: UOA1711-005RTX, UOA1505-001RTX, UOA1904-004SAX,


