Better targeted, more precise fertiliser decisions as a counter to rising fertiliser prices – focusing on 3 of the 6 Rs
Better targeted, more precise fertiliser decisions as a counter to rising fertiliser prices – focusing on 3 of the 6 Rs
Author: André Colaço, Rob Bramley (CSIRO. Waite Campus) Brett Whelan (Precision Agriculture Laboratory, University of Sydney) and the Future Farm project team | Date: 24 Feb 2022
Take home messages
- In the past decades, digital and precision agriculture technologies have been developed with the main goal of allowing traditional agronomic decision tools to be implemented at the site-specific scale in an automated fashion.
- Traditional N fertiliser recommendation frameworks have not been designed for the accuracy expected for precision nutrient management, leading to limited value of digital approaches underpinned by them.
- Novel, data-driven decision support systems based on non-mechanistic frameworks, abundant multivariate data, and on-farm experimentation can improve the accuracy and profitability of N application.
- The Future Farm team worked with top-performing growers across the country who, through comparative analyses, are proven to be very good at N-decision making. Even then, a data-driven N model developed in Future Farm resulted in a ~$50/ha improvement in partial profit over the current practices used by these growers.
Growers will be acutely aware of recent increases in fertiliser prices, largely on the back of constraints to the supply of raw materials, especially in the EU; the price of urea, for example, doubled in the period between May and October 2021 and the ratio of the grain price to urea price is well over 2.5t wheat/t urea. One way to counter this very substantial increase in the costs of production is to optimise the efficiency with which fertiliser is used –putting the right amount of the right product in the right place at the right time (the traditional ‘4 Rs’) using the right equipment and, with the decision as to the right amount, underpinned by the right data (the ‘6 Rs’).
The Future Farm project3 was established to re-examine and improve the way in which digital data are used to inform decisions about input management. Its intent is to provide a way of automating the process from data acquisition, through analysis, to the formulation and implementation of decision options. The focus for the project is improvement in the efficiency and profitability of applied nitrogen (N) use and increased grower confidence in N decision making. In effect, Future Farm seeks to provide growers with the tools which, amongst other things, could help them address the current difficulties with fertiliser price increases. In terms of the 6 Rs, we are especially focussed on the right amount in the right place using the right data.
3. Future Farm is a co-funded collaborative project involving CSIRO, The University of Sydney, The University of Southern Queensland, Queensland University of Technology, Agriculture Victoria and the GRDC.
Agronomic advice and digital technologies
The conventional approach to the provision of advice, such as fertiliser recommendations, has been to use mechanistic agronomic knowledge of crop production to identify important crop and soil parameters and integrate understanding of these to underpin a recommendation or decision. In the case of fertilisation, recommendation charts based on nutrient balances or generalised response curves are examples of such an approach, even though in most instances, they translate agronomic knowledge into simplistic ‘rules of thumb’. More advanced decision support systems (DSS) based on crop models, such as Yield Prophet™ and its ‘parent model’ APSIM, are also similarly reliant on mechanistic agronomic knowledge (for example, Figure 1a). Unfortunately, such models can be very ‘data hungry’ and/or reliant on things which can be difficult and expensive to measure, and which may be highly spatially variable, for example, soil water availability and soil N status. One consequence of this is that such DSS are often used with a ‘best guess’ set of input parameters, for example, using soil properties from a ‘nearby’ soil profile, which might be some distance (several km) from the paddock of interest. Another is that, presumably for reasons of trust, the 26% of growers who make use of a DSS tend, on average, to use more than two of them (Bramley and Ouzman 2018).
a. 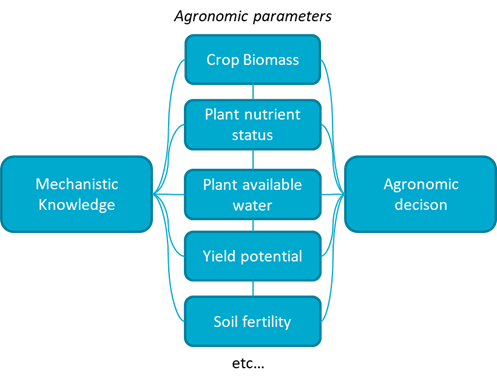
b. 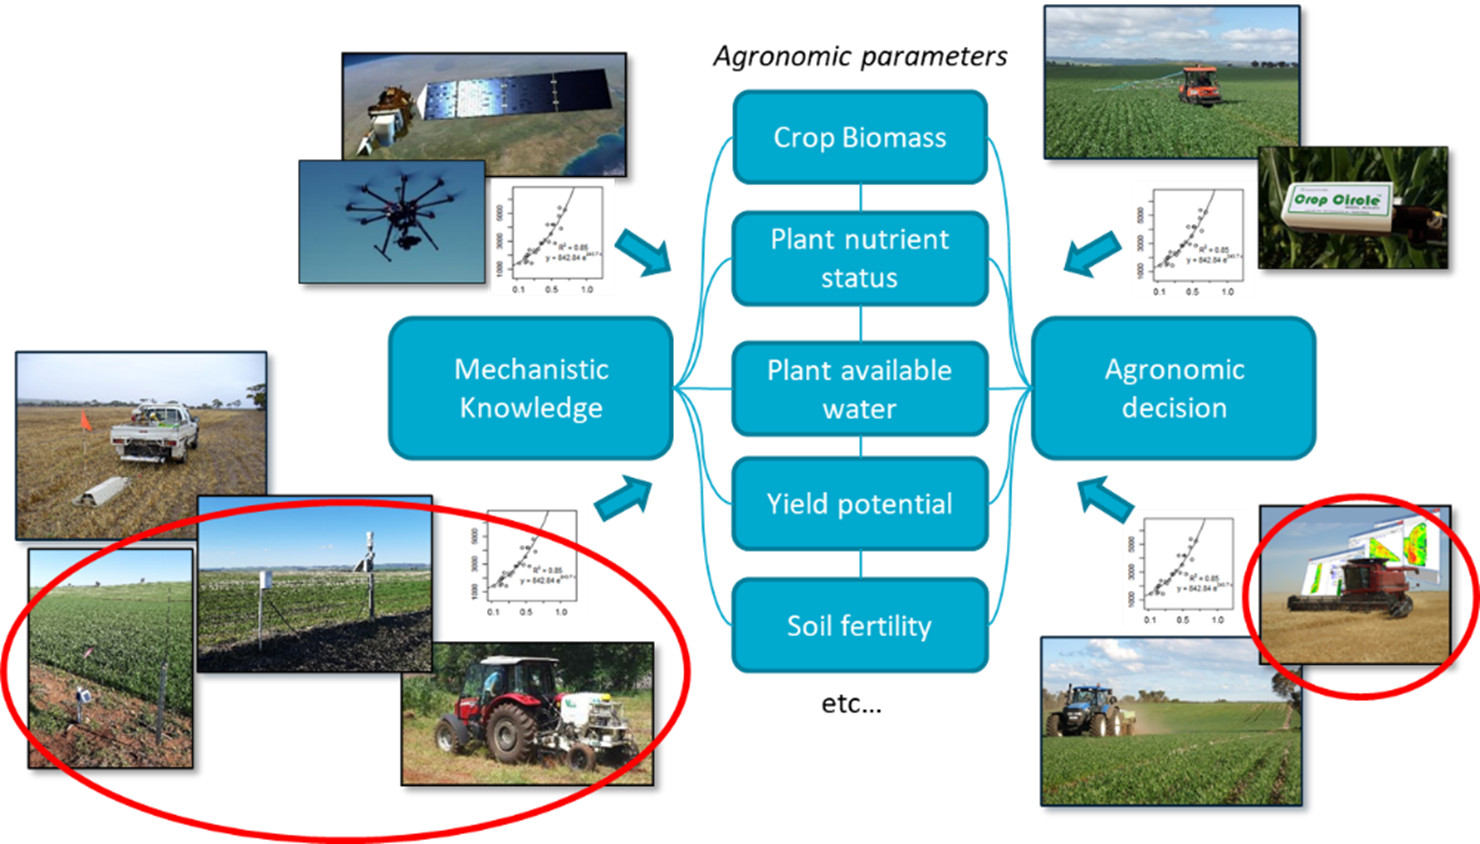
c. 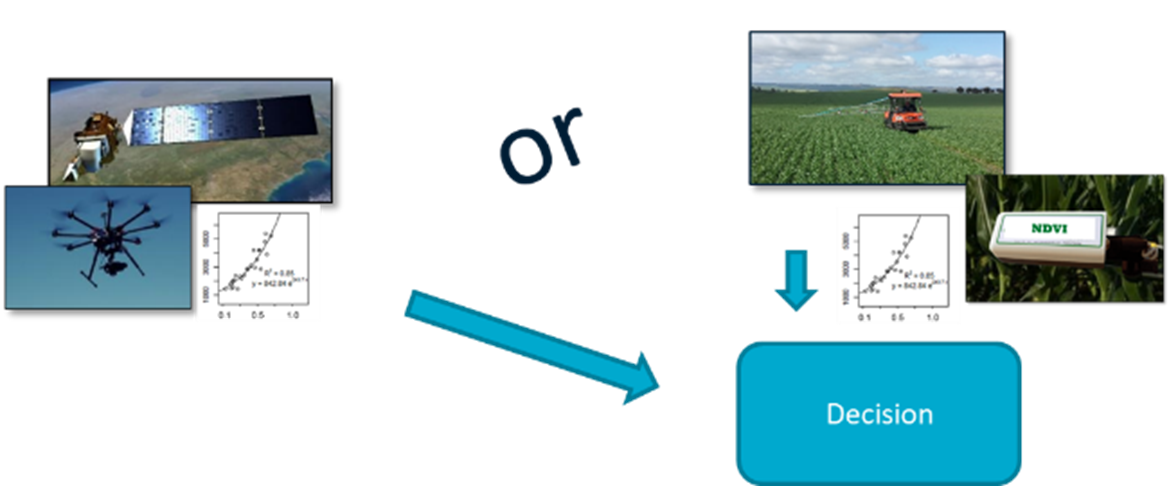
d. 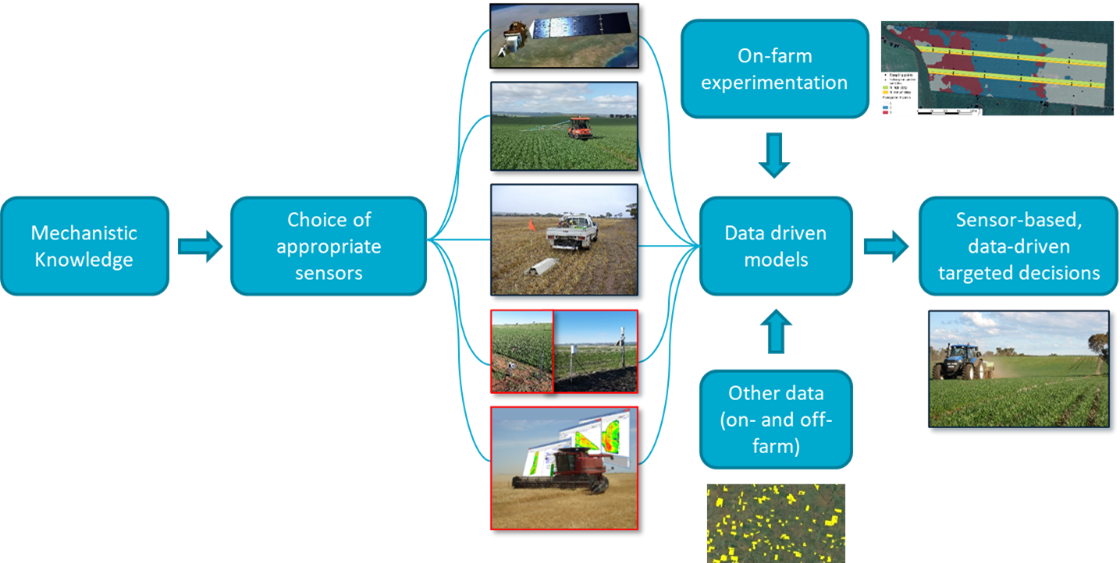
Figure 1. Pathways to a digital decision: (a) the classical approach to agronomic decision support; (b) digital tools and their typical interaction with existing agronomic decision support; (c) the simplistic univariate approach commonly used in some commercial offerings; and (d) the framework hat underpins Future Farm’s data-driven approach to decision making. In (b) and (d), the circled pictures indicate that these sensors are relatively easy to calibrate. Those not circled are used for prediction of crop and soil attributes rather than absolute measurement.
The advent of digital technologies, such as remote and proximal sensing, has led to a lot of effort going into sensor calibration so that some of the agronomic parameters of interest can be sensed, thereby allowing the deployment of existing decision frameworks locally and in an automated fashion (Figure 1b). However, whilst some of these sensing technologies (for example yield monitors, soil pH sensors) are straightforward to calibrate, others (for example multispectral remote or proximally sensed imagery) are not, which is no doubt why, to date and to the knowledge of the Future Farm project team, none of the traditional DSS such as Yield Prophet take sensor data as input. One reason such calibrations are difficult is the fact that many of the sensors make surrogate (as opposed to direct) measurements and so should more accurately be described as tools for prediction of attributes of interest rather than tools which can be calibrated. For example, the commonly used normalised difference vegetation index (NDVI), which can be obtained through remote and proximal multispectral crop sensing, is a surrogate measure of photosynthetically active biomass, which relates closely to the size and health of the crop canopy. Despite what you might see in the media or in advertisements from agronomic service providers, NDVI is not a measure of plant N status, although under some circumstances, it might be correlated with it and so can be used to predict it. So, much of the effort put into the integration of sensors into agronomic decision making has relied on the development of prediction models based on crop sensor data – for example, to provide estimates of yield potential. Fertiliser recommendations can then be based on mass balance (that is, the N rate to apply is equivalent to the difference between nutrient demand (given by the yield potential) and nutrient supply). Of course, such predictions are subject to error. It is also clear that relationships between sensed and target variables (for example NDVI vs yield potential) may be highly subject to site and seasonal variation (Colaço and Bramley 2019).
A final key issue is that, by necessity, traditional N recommendation frameworks simplify complex agronomic interactions, so that they can be easily implemented at the level of the field or farm. As such, most common fertiliser recommendation approaches have not been designed for the accuracy expected for precision nutrient management using variable rate application (VRA). Consequently, even if digitally based predictions of yield potential can be made, the resulting N recommendation may not provide much improvement (if any) if the information is implemented via simplistic mechanistic frameworks (Colaço et al. 2021). Accordingly, the common univariate approach (Figure 1c) based on a single sensor input as a surrogate estimate of N requirement should be treated with caution, and in a recent review study, evidence of this approach providing benefit over farmer practice has been equivocal (Colaço and Bramley 2018). Clearly, most agronomic decision making is not a univariate issue. Decisions as to whether to apply N mid-season, and how much to apply, are greatly affected by soil moisture (Colaço and Bramley 2019, Lawes et al. 2019) in addition to many other factors including yield and protein targets, expectations of future weather, grain prices, grower attitudes to risk, and of course, the cost of fertiliser.
A new way forward with on-farm experimentation
An alternative to the approaches described in Figure 1a-c is to use the same mechanistic understanding of crop production to identify sensors which are likely to provide useful information of relevance to agronomic problems (Figure 1d). Instead of focussing on sensor-based prediction of single crop or soil attributes, use the data the sensors provide as input to data-driven models on the basis that their digital signal is providing data of potentially useful predictive value in guiding decisions in different locations. It is implicit in Figure 1d that, in adopting this approach, the multivariate nature of the agronomic decision is recognised. Figure 1d also recognises that on-farm experimentation (OFE, for example use of N-rich and N-minus strips) is a valuable tool to aid targeting of the decision to the location where it is to be implemented. It also highlights the potential value of off-farm and publicly available data (for example, data for adjacent areas including historic yield, electromagnetic (EM) maps, imagery; and weather data) as inputs to the decision (Fajardo and Whelan 2021).
The Future Farm team recognise diversity, both in the preferences amongst growers and advisors for mechanistic versus data-driven methods, and in the data available to underpin N fertiliser decision making across the grainbelt. Accordingly, we have tackled the task of improving grower confidence in estimating N requirements for cereal growth by purposely evaluating a diverse range of methods, including the data-driven approach, for predicting N requirement (Table 1) and developing comparisons between these. It is also evident that adoption of data-driven methods cannot occur until sufficient data have been collected. Therefore, in the meantime, growers who have been less active as data gatherers may need to rely on other N recommendation methods that are less dependent on large agricultural datasets, which nonetheless can still provide benefit over traditional methods that are based on simplistic rules of thumb.
A key element of Future Farm is OFE, in this case ‘N strips’, designed to test the yield and protein response to applied N. We think that this is an essential component of optimising decision making for the simple reason that every farm and field is different. All the Future Farm OFE included three application rates: a zero N rate, a farm decision N rate (that is, the grower’s best estimate of requirement) and a high N rate that ensures N should be non-limiting. The N rate treatments are placed adjacent to each other in strips (Figure 2) and are applied to run through zones of predetermined potential management classes in each field. In addition to providing key input to the various methods used to develop an N recommendation (Table 1), our OFE was also used as the basis for calculating partial profit (harvest income minus expenditure on fertiliser) response functions using the applied N rates, yield and protein data gathered using harvester-mounted yield and protein monitors along the trials, combined with financial information reflecting average grain grade sale prices and average urea fertiliser costs.
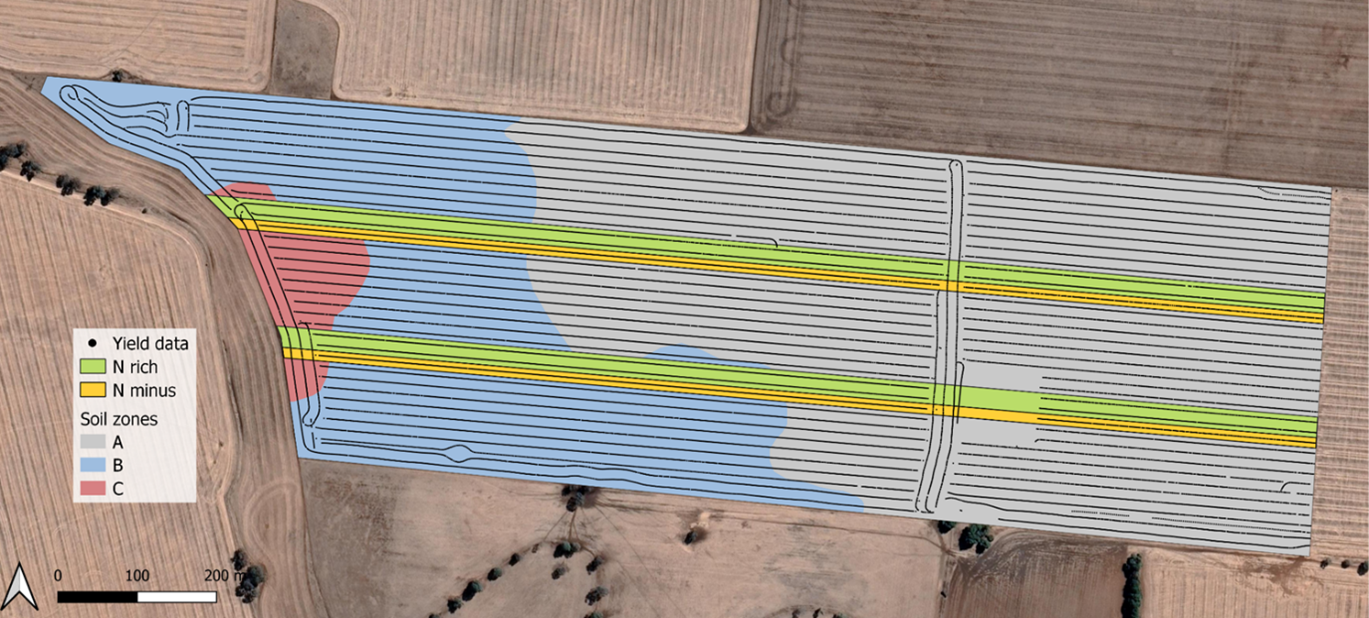
Figure 2. An example of a Future Farm strip trial, in this case, in a 64ha paddock near Tarlee, SA.
Table 1: Methods included for in-season prediction of nitrogen requirement.
Label | Description |
|---|---|
Grower | Grower decision for application rate (that is, the host grower’s chosen rate). |
EONR | Observed rate that maximised partial profit (Economic Optimal N rate). |
Max yield | Observed rate that maximised grain yield. |
Max N removal | Observed rate that maximised grain N removal. |
NDVI CC | Inspired by the Crop Circle approach, the N rate that maximised the Crop Circle NDVI mid-season on the assumption that this maximises end-of-season yield. Note that Crop Circle is a proximal sensor that works in a similar way to the Greenseeker, TopCon CropSpec and similar sensors. |
NDRE CC | As per NDVI CC but using NDRE instead of NDVI. |
NDVI Sent | As per NDVI CC but instead using NDVI sourced from the Sentinel2 satellite. |
NDRE Sent | As per NDVI Sent but using NDRE instead of NDVI. |
DD (data abundance) | Data driven model in which a range of data sources are calibrated against economic optimal N rates (EONR) using random forest regression (Figure 3). In essence, this empirical approach provides a recommendation by assessing current site and season characteristics and relating those to past conditions for which optimal N rates are known. In this data abundance scenario, the site and season conditions at which the model is validated are well represented in the data used to build the model. |
DD (data limited) | As above, but in a scenario of limited data; the site and season conditions at which the model is validated are not well represented in the data used to build the model which comes primarily from other fields. |
N Suff CC | N sufficiency approach based on Crop Circle sensor data. This method is based on the N dilution curve which describes the relationship between plant biomass and plant %N. A target plant %N for fertilisation is set based on estimated crop biomass and an established N dilution model. |
N Suff Sentinel | As above but using Sentinel2 satellite data. |
MV (yield) | A machine vision approach based on prediction of optimal N rates for yield maximisation. This uses a tractor-mounted RGB camera coupled with detailed image analytics. |
MV (grain N removal) | As above but optimised against grain N removal. |
Yield Resp Model | A simplified model of the yield and protein response of APSIM developed by using remote and proximally sensed data, and used to predict the EONR |
Simplified mass balance | Simple mass balance calculation targeting local water-limited yield potential (Gobbett et al., 2017) and protein. Three variants are used: (a) deducts initial soil N from total N demand based on soil sampling; (b) assumes an arbitrary amount of starting soil; (c) does not account for any starting soil N. |
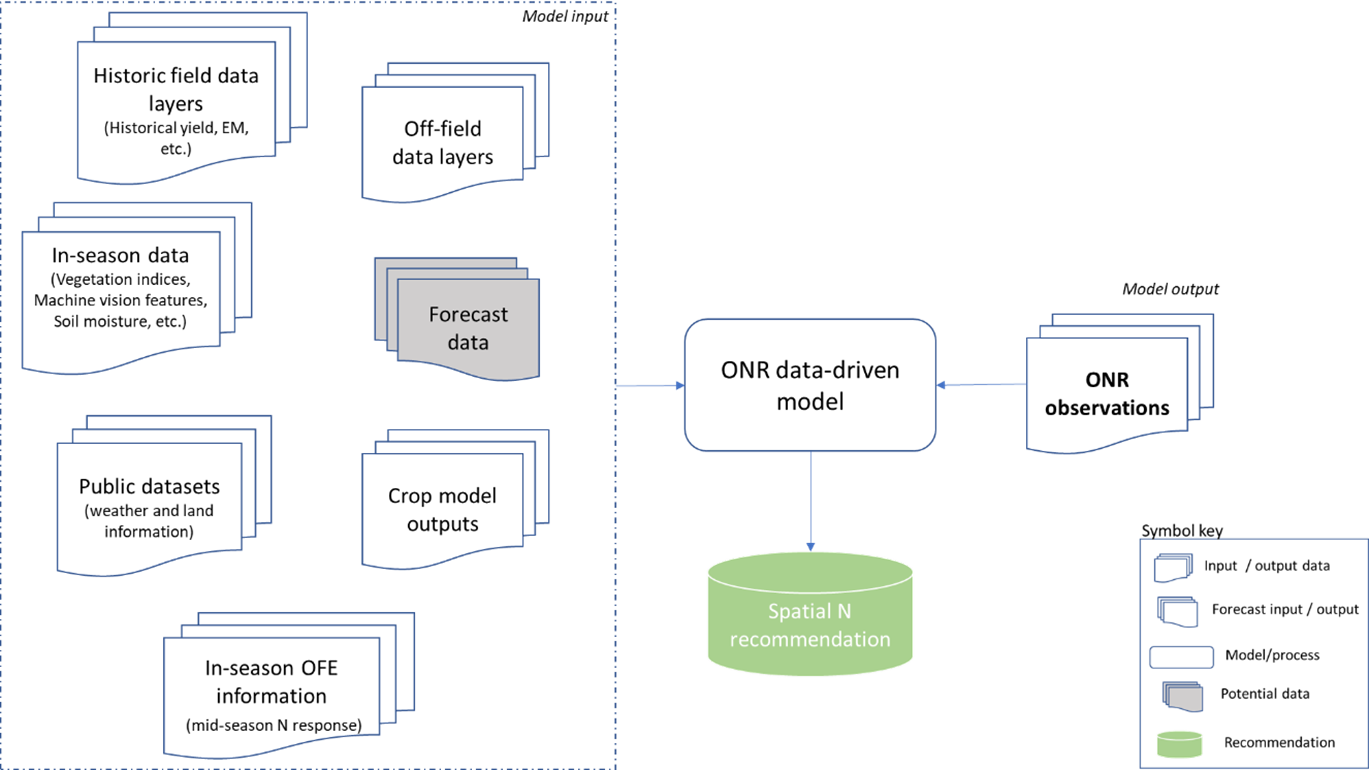
Figure 3. Workflow for an N recommendation approach based on the optimal N rate prediction by a data-driven empirical model.
Comparing approaches for N recommendations
The partial profit response functions were calculated at a fine scale using a moving window regression analysis along the trial strips. This provided site-specific functions at a 10m scale for each site which could then be aggregated up to an average response function for each potential management class, or to an average single response function for the whole paddock. Such an approach enables comparison of the N recommendation methods at three scales – site, management class and whole field. We did such an analysis across nine large scale trials across SA (2018-20), WA (2019-20), Vic (2018-20) and NSW (2020), generating over 1500 observations of crop response to N application. From these functions, the N rate that maximises partial profit, the economic optimum N rate (EONR), can be identified at the three different management scales. The EONR is regarded here as the ultimate N application rate against which all the recommendation methods were compared.
As seen in Table 1, in addition to the methods developed by Future Farm for deriving N recommendations based on Figure 1d, several simple methods using NDVI and NDRE indices calculated from proximal Crop Circle sensors (CC) and satellite remote sensing (Sentinel) were also included. These provide an evaluation of a digital, single sensor approach to N estimation (Figure 1c). The preliminary results (to be updated as data from more Future Farm trial sites become available) of the comparison of the various approaches are shown in Figure 4, where each method is plotted based on the average root mean square error (RMSE, that is the prediction error) and a normalised average partial profit (NPP) at each management level across all sites analysed. The partial profit has been normalised because not all the methods were applied across all Future Farm site-years. Nonetheless, costs and prices appropriate to each season (2018-20) were used to generate the results.
The right data and higher spatial resolution lead to profitable N use
In Figure 4 the EONR calculated from the site-specific analysis is set as the ‘gold standard’ with a zero RMSE and a normalised partial profit equal to 1. The outcome of each proposed method is compared relative to this ultimate benchmark. One way to interpret Figure 4 is to multiply the y-axis by $1000 so that the EONR delivers a NPP of $1000/ha. Thus, for example, a recommendation derived for the whole paddock from an NDRE measurement using the Crop Circle sensor would deliver an NPP of just under $900/ha.
The analysis shows that as accuracy in prediction increases (decreasing RMSE), partial profit increases, but the rate of increase diminishes as the methods become more accurate. Such analysis could be used to assess the worth of a new technique or technology that seeks to improve accuracy compared with its cost. Note that Figure 4 includes results from three options of the ‘Simplified mass balance’ approach, similar to the common ‘rules of thumb’ decision-making processes that many growers and agronomists undertake and that this standard method had similar results to the grower practice. Results also indicate that the mass balance calculation loses performance when the accuracy of soil N information decreases (from (a) to (b) to (c)).
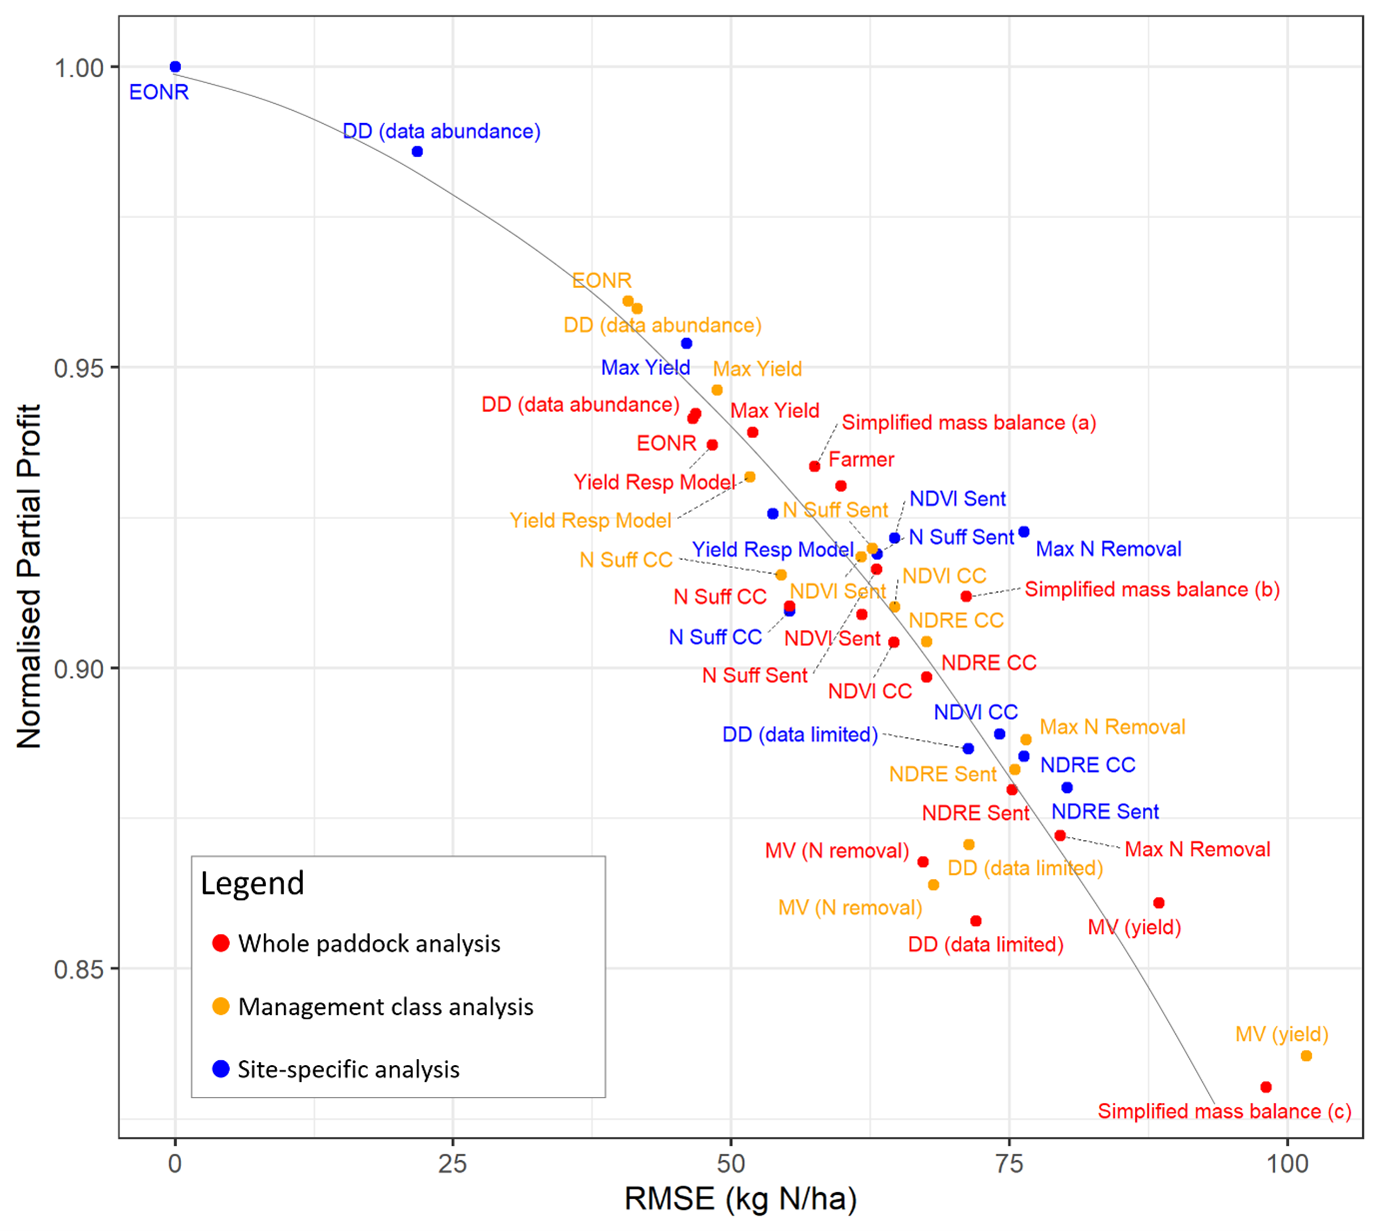
Figure 4. Profitability versus accuracy of in-season methods for N recommendations averaged across trial sites at different management scales. Method labels are defined in Table 1.
The grower decision approach is on average 7% lower in NPP than the optimal recommendation (EONR) at the site-specific level and only about 1% lower than the EONR at whole paddock level. This result confirms that the growers collaborating in Future Farm, who already utilise aspects of the PA philosophy, are very good at optimising their fertiliser use. In this connection, we point out that the simplified mass balance approach which gives a result very similar to that of the grower, assumes that the target yield is the water-limited yield potential. In other words, these growers have very little ‘yield gap’ and they should already have confidence in their N decision making. A key message from Figure 4 therefore, is that for these growers to make improvements to NPP, their N decisions need to be made at higher spatial resolution; in other words, using VRA, rather than uniform paddock management. The extent to which Future Farm might lead to increased confidence amongst other growers is unclear. However, it is of note that the decisions of our collaborating growers outperform all of the single sensor approaches (Figure 1c).
The best Future Farm method is the data-driven model with a full dataset (DD data abundance) at the site-specific level and it displays an increase of 5% over the management of our collaborating growers at paddock scale. Its use at paddock scale leads to a 1% improvement compared to the grower practice. The site-specific DD data abundance method loses slightly to EONR at the site-specific management level, but essentially matches the EONR at the management class and whole paddock resolution.
As a simple example to facilitate interpretation, a 5% improvement can reasonably translate into a $50/ha increase (using a $1000 base line for maximum NPP) which, over a 2000 ha cropping program, would mean a $100 000 gain annually. This can be regarded as a conservative number given that it is based on the high performing growers we’ve collaborated with in the project.
These results point toward relatively low value in a single sensor approach (for example NDVI or NDRE alone). Many of the methods that rated higher in terms of RMSE and partial profit did, however, use NDVI and/or NDRE in a more thorough analytical approach, so they do have value when combined with other data to give a multivariate input to the decision. A data-driven approach based only on limited external data is also shown here to be a low value option for predicting N requirements. This emphasises the fact that the data-driven approach has significant value only when sufficient on-farm data to support it have been acquired. This is also why there is justification during the lead-in to adopting this for using one of the more mechanistic approaches. On the other hand, most common mechanistic approaches may seek to optimise grain yield which, as seen in the graph, can offer only limited improvement over the grower practice (approximately 2%). Of course, whilst grain yield is an important component of profitability, frameworks aimed at yield maximisation do not fully accommodate other important economic considerations.
A profitable future based on OFE and the 6 Rs
Overall, from this multi-site, multi-method assessment process, it appears that the only way to improve the accuracy and profitability of our good performing growers is by increasing the spatial resolution of their management from the whole paddock scale – in other words, through the use of management zones or, better still, continuous variable rate. We make this conclusion with the caveat that this move to higher resolution is accompanied by the use of an effective N decision framework such as the DD method. The data-driven approach relies on data availability to ensure the method performs at its optimum as is evident from the comparison of the DD ‘abundant’ and ‘limited’ results. Nonetheless, we are certain that a key element for acquiring such large datasets, and indeed improving N decision making generally, is the use of automated OFE such as the strip trials used here. There is no impediment to these being scaled out across the country and seamlessly implemented by growers every season forthwith. There is also scope to build the required datasets at field or farm scale, amongst groups of neighbours, in local regions and wider to train data- driven decision methods, such as the one proposed here. Its success at all management scales in this assessment provides an important pointer towards a future where farm businesses that collect, maintain, and even share, relevant production response and resource data will be able to push closer towards season- and site-specific economically optimal operation. Against the background of high and rising fertiliser prices, this would be a good thing. Given also the broader push toward sustainability and reduced emissions from N fertiliser usage, it is arguably also necessary.
Acknowledgements
The research undertaken as part of this project is made possible by the significant contributions of growers through both trial cooperation and the support of the GRDC, the author would like to thank them for their continued support. In addition to the authors, the Future Farm team comprises Jonathan Richetti, Damian Mowat and Roger Lawes (CSIRO), Mario Fajardo and Asher Bender (University of Sydney), Alison McCarthy, Anand Pothula and Craig Baillie (University of Southern Queensland), Eileen Perry, Alex Clancy and Glenn Fitzgerald (Agriculture Victoria) and Stephen Leo, Daniele De Rosa and Peter Grace (Queensland University of Technology); their valued input is gratefully acknowledged. We are also most grateful to the various growers who have provided us with fields in which to develop and test our methods – Ashley Wakefield, Ben Pratt, Bob Nixon, Ed Hunt, Jessica and Joe Koch, Mark and Sam Branson, Mark Swaffer, Rob Cole, Robin Schaeffer, Stuart Modra, Kieran Shepard and Peter Bell. Note that in addition to the GRDC Updates being held in February 2022, this article has also been prepared as input to the Precision Ag News of the Society of Precision Agriculture Australia (SPAA).
References
Bramley RGV, Ouzman J (2018) Farmer attitudes to the use of sensors and automation in fertilizer decision-making: Nitrogen fertilization in the Australian grains sector. Precision Agriculture 20, 157-175.
Colaço AF, Bramley RGV (2018) Do crop sensors promote improved nitrogen management in grain crops? Field Crops Research 218, 126-140.
Colaço AF, Bramley RGV (2019) Site-year characteristics have a critical impact on crop sensor calibrations for nitrogen recommendations. Agronomy Journal 111(4), 2047-2059.
Colaço AF, Richetti J, Bramley RGV, Lawes RA (2021) How will the next-generation of sensor-based decision systems look in the context of intelligent agriculture? A case-study. Field Crops Research 270, 108205.
Fajardo M, Whelan BM (2021) Within-farm wheat yield forecasting incorporating off-farm information. Precision Agriculture 22, 569–585.
Gobbett DL, Hochman Z, Horan H, Navarro Garcia J, Grassini P, Cassman KG (2017) Yield gap analysis of rainfed wheat demonstrates local to global relevance. The Journal of Agricultural Science 155(2), 282-299.
Lawes RA, Oliver YM, Huth NI (2019) Optimal nitrogen rate can be predicted using average yield and estimates of soil water and leaf nitrogen with infield experimentation. Agronomy Journal 111(3), 1155-1164.
Contact details
Andre Colaco
andre.colaco@csiro.au
GRDC Project Code: CSP1803-020RMX,
