New insights into nitrogen and water interactions with Fusarium crown rot
Author: Mitch Buster (NSW Department of Primary Industries, Tamworth & University of New England, Armidale), Richard Flavel (University of New England), Steven Simpfendorfer (NSW DPI), Chris Guppy (UNE), Mike Sissons (NSW DPI) | Date: 02 Mar 2022
Take home messages
- Deep banded nitrogen can have a significant effect on grain protein under low in-crop rainfall conditions
- Fusarium crown rot had no significant effect on grain protein levels
- Soil nitrogen availability appears to be a driver of Fusarium crown rot (FCR) severity in-crop
- Durum variety DBA Lillaroi suffered a significant yield penalty (25%) in the presence of additional FCR inoculum in a wet finish and 36% in a dry finish
- Test to ensure your paddock is clean of FCR inoculum before considering durum as an option
- LRPB Lancer had improved tolerance to FCR with 8% yield loss in a wet finish and 9% in a dry finish and could be considered in moderate risk paddocks to limit disease impacts.
Introduction
Fusarium crown rot (FCR), caused by the stubble-borne fungus Fusarium pseudograminearum (Fp), produces significant yield penalties over much of northern NSW and southern Qld. This is primarily due to the fungus’ ability to restrict the plants vascular system. When coupled with typical low in-crop rainfall during grain filling, the resulting moisture stress exacerbates the impact of FCR on grain yield.
Historically, nitrogen (N) interactions with the FCR fungus have not been well studied or understood. With current record high N fertiliser costs, it is imperative to ensure that financial returns are maximised through well-informed N fertiliser decisions. This controlled study explored interactions between spatially available soil N, FCR and available soil moisture during flowering and grain filling in a high protein bread and durum wheat variety.
Methods
Soil, tube design and FCR treatments
Polyvinyl chloride (PVC) soil tubes 150 mm diameter x 1200 mm length were used to simulate a field soil profile. The soil used was a grey Dermosol with a PAWC of 202 mm/m and starting N of 36.4 mg nitrate N/kg and 3.8 mg ammonium N/kg soil. The upper topsoil (top 350 mm) was compacted to a bulk density of 1.2 g cm-3 and the lower subsoil (bottom 780 mm) was packed to a bulk density of 1.3 g cm-3. Two FCR treatments were used, background and background plus Fp inoculation. The background plus inoculation treatment contained a band of 20 mm of inoculated soil. This was prepared by adding ground Fp infected seed (0.5 - 2 mm fraction) evenly mixed throughout soil at rates of 1 g inoculum / 100 g of soil (Forknall et al., 2019). The background treatment had 20 mm of soil mixed with sterilised grain in a similar manner. A further 10 mm of soil was then added to both treatments to minimise colonisation of the fungus across the soil surface during the experiment.
Plant materials and growing conditions
One bread wheat, LPRB Lancer and one durum, DBA Lillaroi were grown over a six-month period. Seed was treated with Vibrance® and Emerge® at rates of 360 mL/100 kg and 240 mL/100 kg, respectively for standard bunt and smut control and early protection against aphids. Six seeds of each cultivar were sown below the inoculum layer approximately 3 cm below soil surface and thinned to four plants per pot upon establishment. There were five replicates of each cultivar and treatment. The experiment was conducted in an air-conditioned polyhouse complex at Tamworth Agricultural Institute (TAI) with a 25°C day and external ambient night temperature regime.
Fertiliser
At planting, soil tubes were treated with KNO3 equivalent to 50 kg K/ha, which was evenly mixed in the top 350 mm of soil to rectify K deficiency. The banded treatment received urea in solution equivalent to 80 kg N/ha at 350 mm below the surface. The surface treatment received the same solution at 50 mm below the surface.
Watering
Soil tubes were individually weighed and watered to field capacity each week until flowering. Post flowering, the dry finish treatments were managed to 40% of field capacity (-100 kPa matric potential), whilst the wet finish treatment maintained the original field capacity watering regime. Water was administered through a 25mm PVC pipe located in the soil column which had three watering points vertically throughout the profile at 35 cm, 55 cm and 75 cm below the soil surface. This method sought to mimic dryland growing conditions in northern NSW with minimal in-crop rainfall during grain filling with crops growing predominantly on stored soil moisture.
In crop measurements
Plants were visually scored for the severity of FCR infection based on a 0-3 scale at GS31 and at harvest. This determined whether all the FCR inoculated treatments physically displayed signs of infection and the severity of disease at these growth stages. Scores were averaged across plants within each growth tube prior to conversion to a 0-100 FCR index (Forknall et al. 2019). Immediately prior to harvest, counts were taken of plants, tillers and heads. Heads on main stems from each plant were removed, followed by the stems that were first measured for height and then cut 5 mm above the soil surface. The remainder of the heads and stems were then collected. Both heads and stems were dried at 40°C for 72 hrs prior to threshing and weighing. Grain was threshed from the collected heads from the four main stems of plants in each soil tube. Grain weights and counts for mainstems and other heads were recorded separately. NIR spectroscopy was then conducted on all samples to determine grain protein levels. The main stem was cut at 5 cm intervals starting at the base. The lower 1 cm of these pieces was kept for laboratory FCR testing of vertical Fp recovery and the upper 4 cm for nutritional analysis. The 4 cm nutritional analysis sections were grouped by tube, then trimmed to 5 mm lengths and scanned using NIR for N tissue estimations. A calibration curve was constructed using LECO on a sub-set of tissue samples to correlate estimated tissue N for the remaining samples.
Results
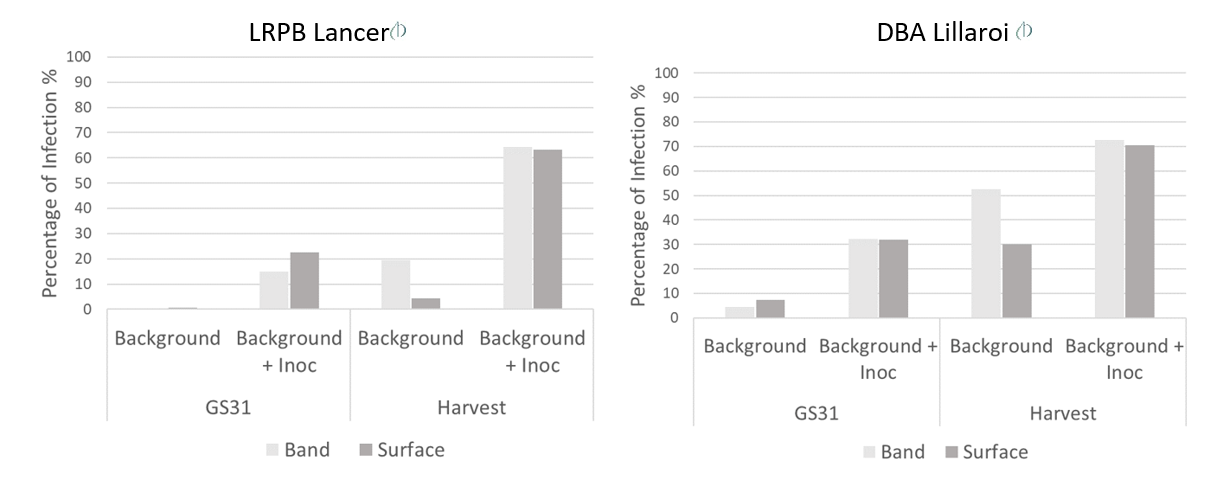
Deep banding of N decreased FCR severity scores early in season at GS31 compared to surface applied N in both the background plus inoculation treatments of LRPB Lancer and in the background treatment of DBA Lillaroi (Figure 1). However, deep banding of N increased FCR severity scores at harvest in the background treatment in both cultivars (Figure 1). These results demonstrate that FCR severity potentially has a relationship with the relative availability of N to the crop.
Figure 1. Effect of banded (35 cm) and surface (5 cm) nitrogen application on FCR severity (FCR index 0-100) conducted at GS31 and harvest of LRPB Lancer (left) and DBA Lillaroi (right) in the presence of background or background plus inoculation infection by Fp. Data averaged across water treatments.
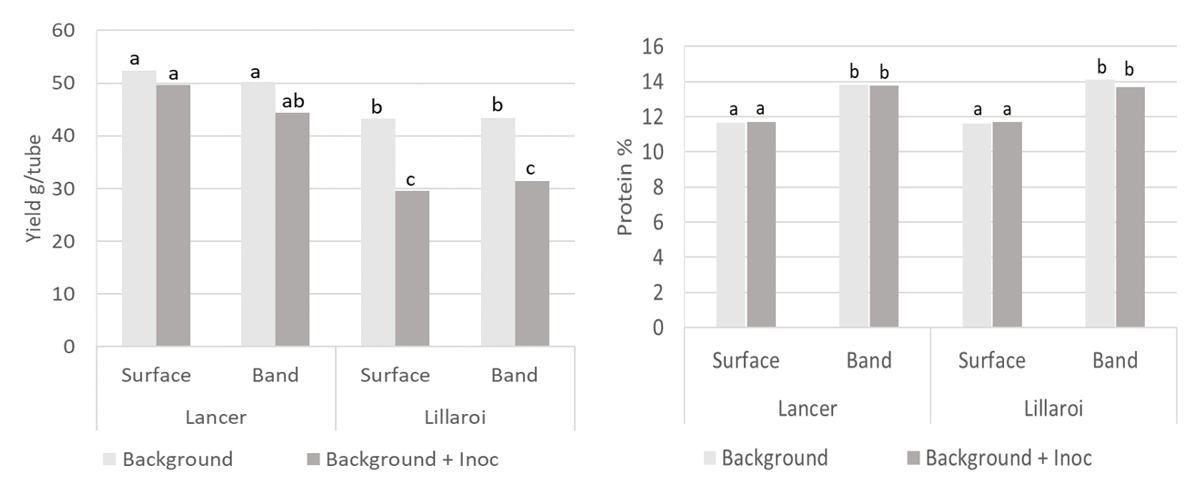
Nitrogen placement had no significant effect on yield (Figure 2, left). Banding of N resulted in a significant increase in grain protein compared to surface application of N in both durum and bread wheat (Figure 2, right). Increased levels of FCR infection had no significant effect on grain protein (Figure 2) and tiller count (data not shown).
Figure 2. Average yield (left) and protein responses (right) of LPRB Lancer and DBA Lillaroi under banded and surface applications of urea with background and background plus inoculation FCR treatments. Significance letters indicate 95% confidence (p>0.05).
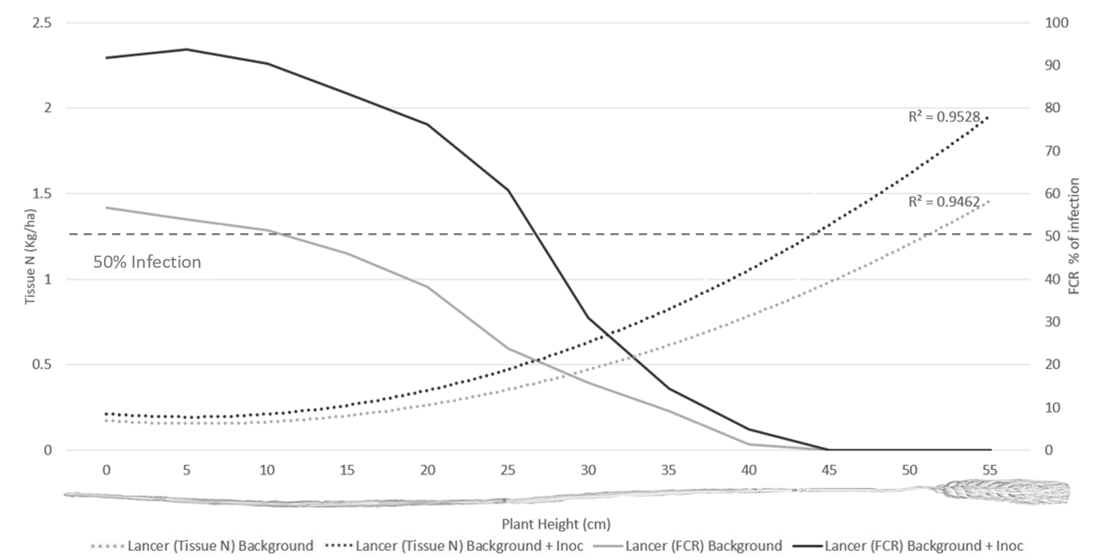
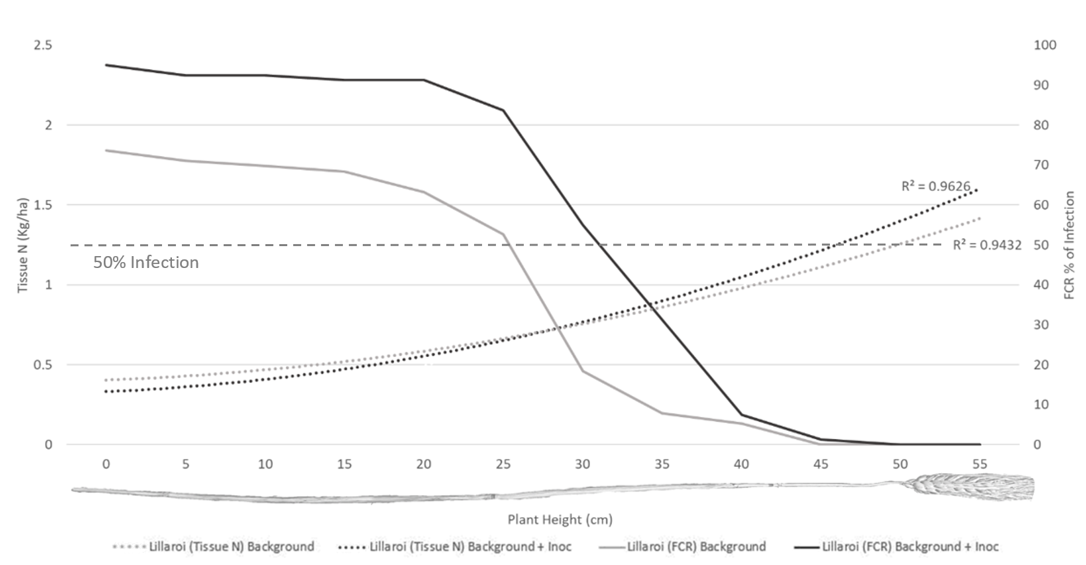
Infection levels of Fp recovered from laboratory plating demonstrated a significant increase in vertical colonisation of main stems in both cultivars with the background plus inoculum treatment compared to background only (Figures 3 & 4). The vertical height intercept where 50% of tillers were colonised for LRPB Lancer was a height of 27.5 cm in the background plus inoculation treatment, but only 10 cm in the background only treatment (Figure 3). Whilst for DBA Lillaroi the 50% vertical colonisation was 33 cm in background plus inoculation and 27 cm in background (Figure 4). Recovered tissue N post-harvest was significantly higher in the background plus inoculation FCR treatment compared to background alone with LPRB Lancer (Figure 3) but was not significantly different with DBA Lillaroi (Figure 4). This is likely due to the increased susceptibility of
DBA Lillaroi to FCR resulting in a smaller separation between FCR treatments which limited ability to detect differences in N tissue recovery. The increase in tissue N relative to FCR severity indicates that fungus is increasing the plants demand for N (Figure 3, 4) but not transferring into protein (Figure 2), suggesting a decrease in nitrogen use efficiency (NUE).
Figure 3. Tissue N (Kg/ha) and percentage of FCR infection as sampled vertically up the main stem of LRPB Lancer. Data averaged across nitrogen and water treatments.
Figure 4. Tissue N (Kg/ha) and percentage of FCR infection as sampled vertically up the main stem of DBA Lillaroi. Data averaged across nitrogen and water treatments.
Increased levels of FCR infection (inoculated treatment) decreased yield in DBA Lillaroi by 25% under wet finish conditions and 36% under dry finish conditions relative to the background levels of inoculum (Figure 5). There was a trend towards LPRB Lancer being 8% lower yielding under wet finish conditions and 9% lower under dry finish conditions due to increased FCR infection but these differences were only significant at the 90% level as opposed to the 95% level shown in Figure 5 below.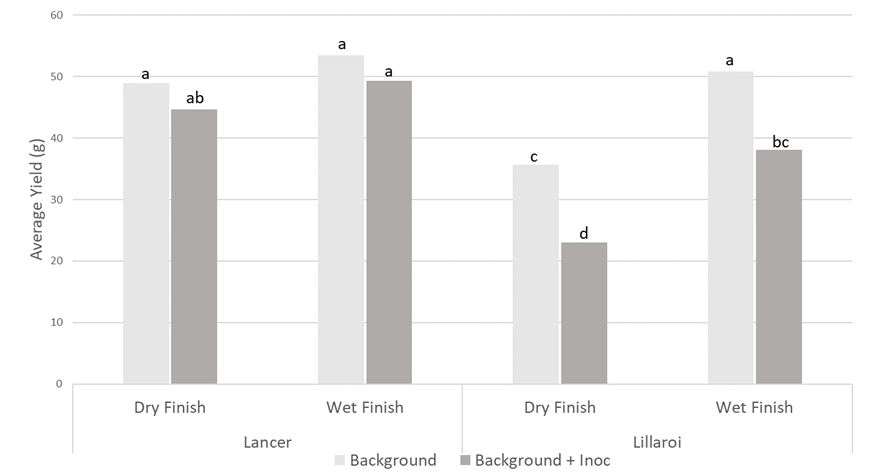
Figure 5. Average yield response of LPRB Lancer and DBA Lillaroi under dry and wet finishes to the growing period post flowering with varying levels of FCR infection. Significance letters indicate 95% confidence (p>0.05)
Summary
Nitrogen availability was demonstrated as a likely driver for FCR severity in-crop with surface N applications resulting in an increase in FCR severity (compared to banded N) under certain treatments at the early GS31 assessment. However, as the season progressed under low simulated in-crop rainfall, the topsoil dried and hence crop access to surface applied N decreased. At harvest, banded N treatments resulted in the highest severity of FCR but produced higher grain protein levels compared to surface N applications. Logistically banding fertiliser at 35 cm is not easily achieved, however practices such as applying N early in the fallow and allowing it to move down the profile with rainfall events may achieve a similar N location outcome.
Residual tissue N concentrations within stems at harvest increased with greater severity of FCR infection. This N was not translocated to the grain, and it is suspected that an increased demand for N is placed on the plant by the fungus, potentially mining more N out of the soil profile and decreasing NUE. At the time of writing of this paper soil N analysis was not complete but these results will confirm the fate of N in the presence of varying levels of FCR infection. Even so, N availability in wheat stems did not appear to be a driver of FCR colonisation.
Fusarium crown rot did not influence grain protein, however yield penalties were significant especially in the durum variety. This was not a result of decreased tiller number but a combination of reduced grain size and whitehead expression (data not presented). Yield penalties in the durum variety were exacerbated under a dry finish, which frequently occurs in northern NSW and southern QLD cropping systems. The prevalence of FCR in these regions combined with historically dry/hot seasonal finishes has made durum production inherently higher risk than growing bread wheat varieties, such as LRPB Lancer, which has improved tolerance to this disease. To manage this risk, growers should consider PREDICTA®B or NSW DPI stubble testing of paddocks planned for durum production in 2022 prior to sowing.
Acknowledgements
The research undertaken as part of this project is made possible by the significant contributions of growers through both trial cooperation and the support of the GRDC and the NSW DPI. This work was undertaken as part of project DAN00213: Grains Agronomy & Pathology Partnership-A strategic partnership between GRDC and NSW DPI. The PhD study is enrolled through the University of New England with the support of supervisors Dr. Richard Flavel (UNE), Dr. Steven Simpfendorfer (NSW DPI) Dr. Christopher Guppy (UNE) and Dr. Mike Sissons (NSW DPI). The author would like to thank them for their continued support.
References
Forknall, C R, Simpfendorfer, S and Kelly, AM (2019). Using yield response curves to measure variation in the tolerance and resistance of wheat cultivars to Fusarium crown rot. Phytopathology, 109: 932-941. doi:10.1094/phyto-09-18-0354-r
Contact details
Mitch Buster
NSW Department of Primary Industries
4 Marsden Park Rd, Tamworth 2340
Ph: 0428 306 914
Email: mitch.buster@dpi.nsw.gov.au
® Registered trademark
TM Trademark
Varieties displaying this symbol beside them are protected under the Plant Breeders Rights Act 1994.
GRDC Project Code: DAN00213,
Was this page helpful?
YOUR FEEDBACK

