Variability in wheat grain protein estimated from airborne hyperspectral and thermal remote sensing imagery
Variability in wheat grain protein estimated from airborne hyperspectral and thermal remote sensing imagery
Take-home messages
- Hyperspectral remote sensing offers powerful new tools in agriculture.
- Machine learning/AI are key to unlocking actionable information from data.
- New methods can estimate aspects of crop performance including grain protein content.
Background
Bread and durum wheat are major staple foods and receive large amounts of nitrogen (N) fertiliser, a large and risky expense for growers. Grain protein content (GPC) drives both the economic and dietary value of grain and is influenced by weather, soil and agronomic factors, but drought and/or heat can depress photosynthesis during grain filling, leading to higher GPC (Gooding et al. 2007). Header-mounted GPC monitors are becoming popular and provide large data streams, an opportunity for scientific analysis with potential benefits to growers. Early knowledge of the spatial patterns of GPC within and between paddocks could allow growers to harvest strategically for grain segregation or blending, or to adjust fertiliser applications to achieve quality benchmarks and optimise profit (Apan et al. 2006).
Because of its high spectral resolution, hyperspectral remote sensing (RS) offers vastly more information about plant condition than broadband indices. Retrieval of plant physiological traits, and stress detection, are hence vastly improved. As GPC is linked to stress, there is a sound theoretical basis to GPC estimation by hyperspectral methods. These include many reflectance indices, as well as physical modelling methods. Machine learning (ML) algorithms permit complex relationships between multiple explanatory and response variables to be modelled, and for the relative contribution of each input to model accuracy to be assessed. Because of the many parameters that can be retrieved from hyperspectral data, this is highly applicable to GPC estimation. However there appears to have been no previous study predicting GPC from airborne remote sensing at commercial scale, over consecutive years and utilising header-generated data, although smaller studies have been conducted (Rodrigues et al. 2018) We applied a ML algorithm that has not previously been applied to GPC and seldom to hyperspectral or other RS data streams.
Methods
Nitrogen (N) fertiliser treatment trials at Birchip (35.97° S, 142.82° E) and Yarrawonga (36.05° S, 145.98° E) were planted to a common wheat cultivar in 2019. Seventeen commercial paddocks (approx. 2000ha) around Kaniva (36.37° S, 141.24° E) were sown to various bread and durum cultivars in 2019 and/or 2020. At Kaniva in each of 2019 and 2020, crops were sown in May and early June and 1—3 fertiliser applications were made each year, usually as urea. Hyperspectral and thermal data were collected by sensors flown on a light aircraft over Birchip (3 March 2019), Yarrawonga (9 October 2019), and Kaniva (22 October 2019, 28 October 2020). Hyperspectral data were collected in the visible and near infrared (VNIR) domains with a Micro-Hyperspec VNIR E-Series sensor (VNIR; Headwall Photonics, Fitchburg, MA, USA), capturing 371 bands from 400—1001nm. Thermal infrared radiation (7.5—14µm) was recorded with an A655c (FLIR systems, Wilsonville, Oregon, USA). Flights at 350—400m over the plot sites gave hyperspectral pixel resolutions of 0.15—0.2m, while passes at 7000feet gave pixels of 1.0m (hyperspectral) and 1.7m (thermal) at Kaniva. Instrument calibrations were done before flights and irradiance and meteorological data were collected at ground level during airborne data capture. On the ground, leaf-clip spectroscopic measurements were taken during flights. Per-plot GPC was assessed by benchtop near infrared (NIR) spectroscopy (Crop Scan 3000B Grain Analyser, Next Instruments, Sydney Australia). Similar combine-mounted spectrometers (CropScan 3000/3300H, Next Instruments) collected GPC during harvest, with location for each record from GPS.
Regions of interest (ROI), 100m2, were established around each of the ~50,000 GPC made available by the grower, though those intersecting paddock perimeters, dams, trees and cloud shadow were excluded. The ROI became the base experimental unit for the commercial sites. Mean radiance and reflectance spectra, and canopy temperature values were calculated from image pixels in each plot or ROI. Narrow-band reflectance indices, solar-induced fluorescence (SIF) and crop water stress index (CWSI) were retrieved from airborne data for all plots and ROIs (Table 1). Indices were also calculated from leaf clip spectra at plot scale. In addition, the leaf pigments carotenoids (Car), chlorophyll a + b (Ca+b) and anthocyanins (Anth) and the canopy structural traits leaf area index (LAI) and leaf inclination (LIDFa) were estimated by inverting leaf- and canopy radiative transfer models, linked as PRO4SAIL. Details of the inversion are found in Poblete et al. (2021).
A gradient boosted machine ML algorithm was used to estimate, through supervised learning, relationships between leaf and canopy traits retrieved from airborne data: indices, inverted parameters, CWSI and SIF (Table 1), and the target variable GPC. Input features were passed to a linear function to assess their contribution to GPC estimation (Chen and Guestrin 2016) and to train the model to estimate GPC. Data from each year/cultivar at Kaniva were randomly split 70:30 into training and test sets. From the training dataset, the ML algorithm learns relationships between input and response variables, then uses these to predict GPC in a test set, unseen during training. The ML algorithm was run 80 times for each combination of year and wheat type, with random splitting each iteration; this ensures the model is robust while also causing some variability in results.
Table 1: Selected canopy trait quantities calculated from spectra observed with leaf clip instruments in plots at Birchip and Yarrawonga and from airborne hyperspectral and thermal imagery captured in flights over those plots and commercial wheat near Kaniva. *S = structural, P = physiological. For CWSI, VPD = vapour pressure difference. VI = vegetation index. NDVI is shown for reference.
Quantity | Abbreviation | Type* | Data source | Retrieval method | Formula / description / units | Reference |
|---|---|---|---|---|---|---|
Crop Water Stress Index | CWSI | CWSI | thermal | - | CWSI = (Tc-Ta)-(Tc-Ta)LL / (Tc - Ta)UL – (Tc – Ta)LL where (Tc – Ta)LL = −3.25·VPD + 3.38 | Idso (1982) |
Enhanced VI (NIR) | EVI | S | airborne / leaf clip refl | VI | EVI = 2.5*(R800-R670)/(R800+6*R670-7.5*R800) | Longmire et al. (submitted) |
Normalized Difference VI | NDVI | S | NDVI = (𝑅840−𝑅670)/(𝑅840+𝑅670) | Rouse et al. (1974) | ||
Photochem. Reflectance Index | PRI | P | PRI = (𝑅531−𝑅570)/(𝑅531+𝑅570) | Gamon et al. (1992) | ||
Solar-induced fluorescence | SIF | P | radiance | Fraunhofer line depth (FLD) | FLD2 = d-R*b, where R = (c-d)/(a-b), a = E750, b = E762, c = L750 and d = L762 (mW/m2/nm/sr) | Plascyk and Gabriel (1975) |
Chlorophyll a + b content | Ca+b | P | airborne refl | model inversion | μg/cm2 | Féret et al. (2017) |
Carotenoid content | Cx+c | P | ||||
Anthocyanin content | Anth | P | ||||
Leaf area index | LAI | S | m2/m2 | Verhoef et al. (2007) | ||
Leaf Inclination Dist. Function | LIDFa | S | ° |
Results and discussion
Plot studies
Our results from plot studies showed close associations between physiological indicators, whether calculated from reflectance or inverted, and GPC, along the induced N gradient. Relationships between physiological parameters, including Ca+b, Anth and PRI, and GPC, were consistently stronger than those of the structural indicators such as EVI, LAI and NDVI (not shown). This reflects work showing physiological traits’ association with stress and lowered photosynthesis, as well as the lack of any physiological connection between NDVI and stress (Gamon et al. 1992; Magney et al. 2016; Suárez et al. 2008).
Commercial crops
Low rainfall in 2019 (280mm; Kaniva) compared to 2020 (443mm), affected commercial paddocks, and the 2019 conditions affected both plot sites. Accumulated rainfall from harvest 2018 to 2019 sowing was also very low (87mm) compared to the next year (164mm; Bureau of Meteorology 2021). Such conditions, especially the contrast in soil moisture, can have large effects on grain protein and were seen in the current work. Significance and effect size of GPC differences between years and wheat types were assessed by a Wilcoxon test for non-normal distributions (Bauer 1972) and in every case, Wilcoxon’s p <0.0001. By these tests, bread wheat had significantly higher mean GPC in 2019 than 2020 (effect size r = 0.489) but durum had higher GPC in 2020 (r = 0.360, Figure 1). Durum GPC was higher than bread GPC in each year also, with a larger effect size in the more climatically benign 2020 (2019: r = 0.112; 2020: r = 0.564). These results suggest that GPC in durum was less affected by adverse conditions than in bread wheat and confirm higher GPC in durum.
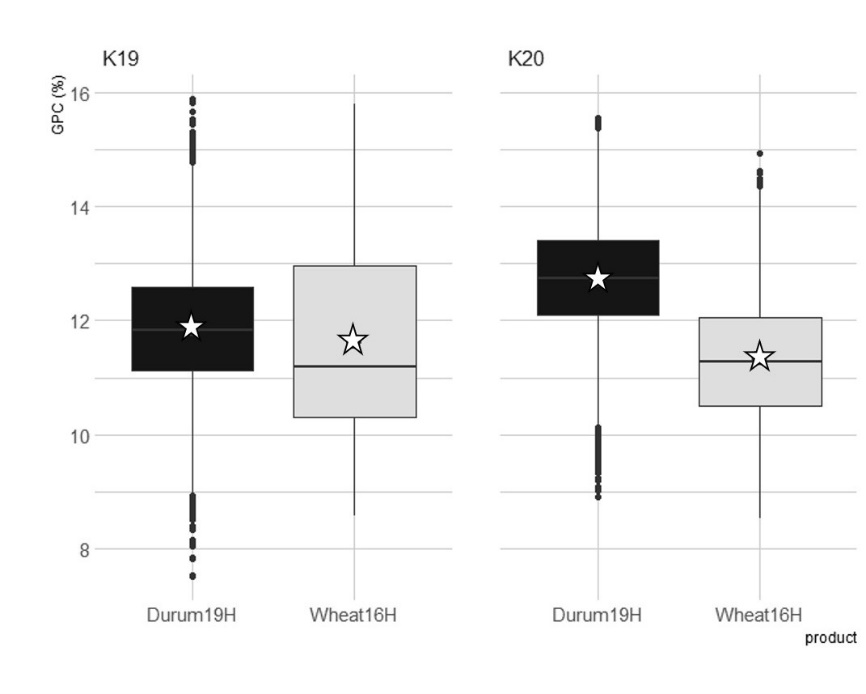
Figure 1. Grain protein content (GPC; %) by wheat type and year in commercial crops at Kaniva, Victoria in 2019 (K19) and 2020 (K20). Stars show mean GPC; all comparisons between year and wheat type means are significant (Wilcoxon’s p <0.0001).
Model predictive skill was assessed by coefficient of determination (R2) and relative root mean square error (rRMSE; GPC (%)). For each combination of year and product, GPC prediction in the unseen test data was best when the algorithm was fed with all sources of canopy trait information: models with CWSI, physiological and structural layers outperformed those lacking CWSI, structural measures or both. The best GPC predictions were seen in the severely droughted Kaniva 2019 bread wheat crop (R2 = 0.80, rRMSE = 0.62; Figure 2), when CWSI contributed 69% of total predictive power. This year/crop combination also had the best skill when based on only physiological or physiological + structural inputs. Under lower drought stress, CWSI provided relatively less information to the model and predictive power was more moderate. This showed that physiological quantities were important indicators of GPC and that thermal data, despite its importance, could be excluded in such conditions without a large penalty to predictive skill. When added to physiological quantities, canopy structural measures LAI, LIDFa leaf angle and EVI strongly increased model skill, despite the low importance of each component alone. Under severe stress, physiological model inputs retained some power to indicate GPC, but under moderate and low stress were of prime importance because they show lowered photosynthesis (Poblete et al. 2021; Suárez et al. 2008; Zarco-Tejada et al. 2018). These findings have identified key physiological indicators for GPC prediction and has important ramifications for the development of our methods toward practical application. This includes GPC estimation from data collected with instruments of lower spectral resolution and without thermal data, often absent from relevant satellite platforms.
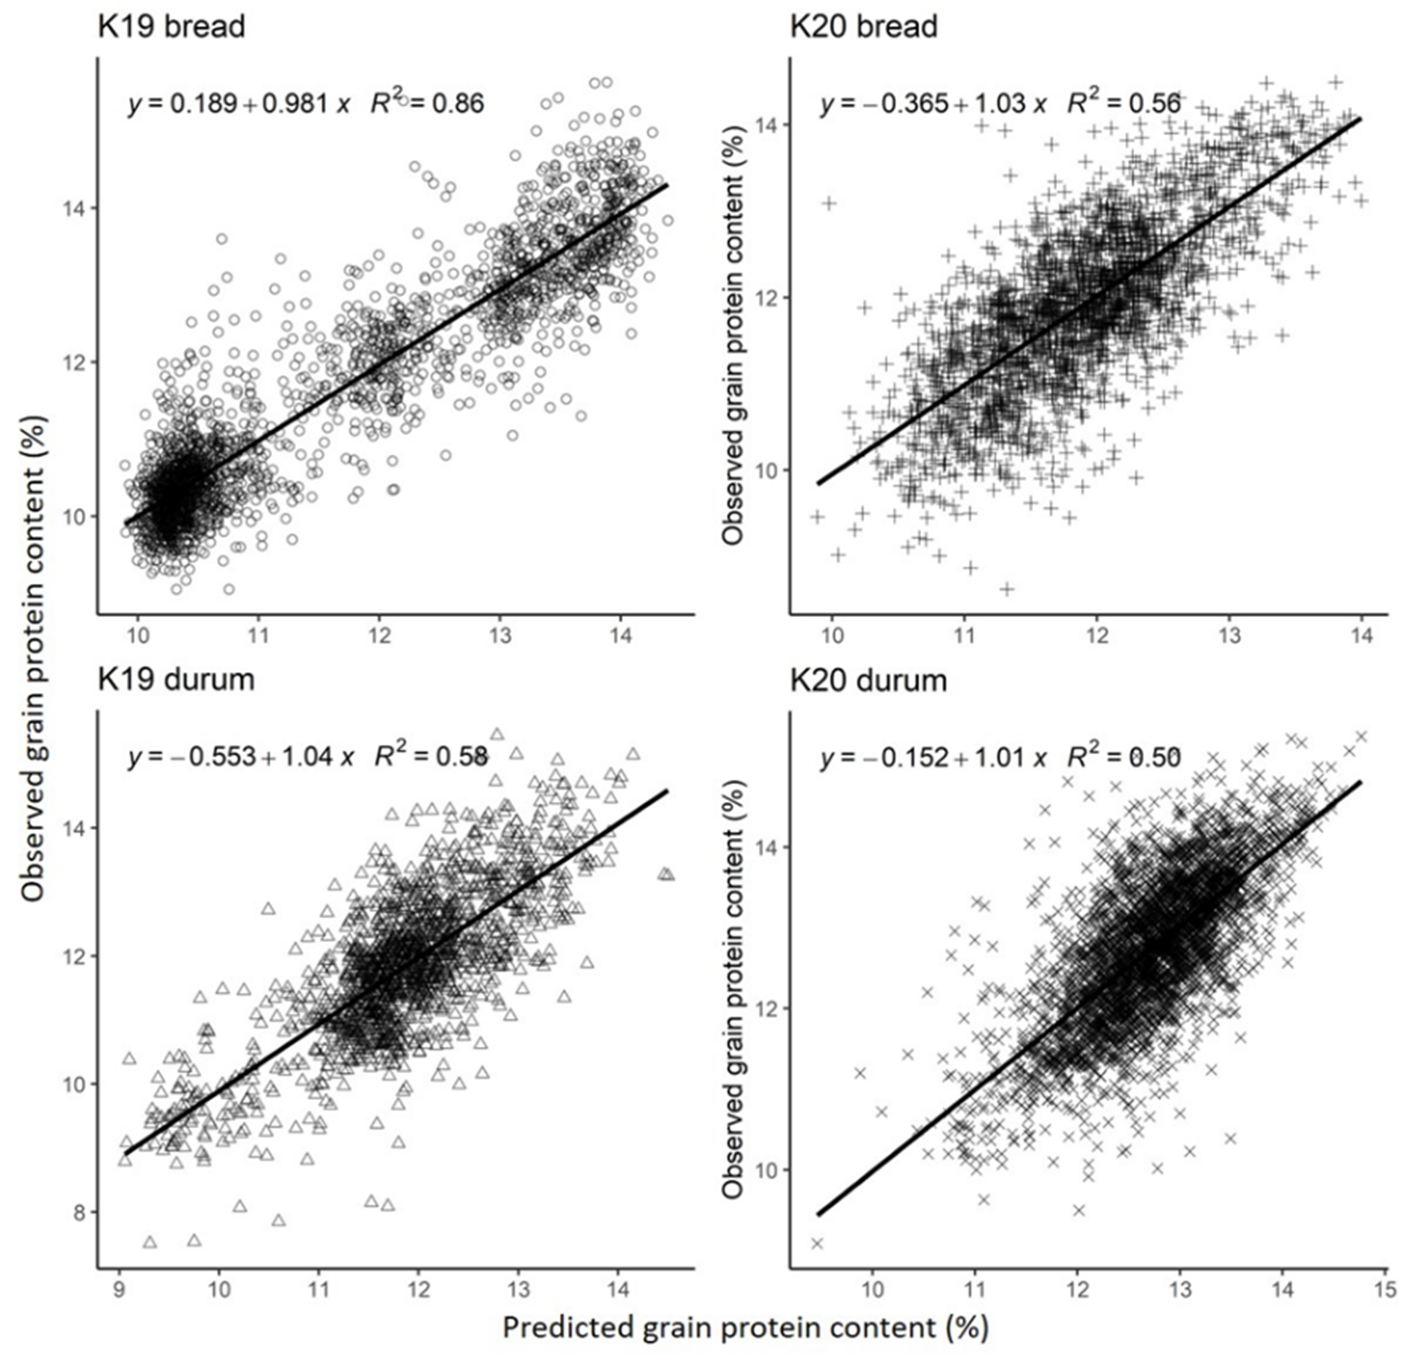
Figure 2. Observed grain protein content (GPC; %) as a function of predicted GPC in commercial bread and durum wheat crops at Kaniva, Victoria in 2019 and 2020. Discrepancies in R2 between figures and text arise because those in the text represent the mean of many model runs, while the figures are from random single runs within crop type and year.
Our predictive skill was similar to some previous studies of wheat GPC (Li et al. 2020; Øvergaard et al. 2013; Zhou et al. 2021), though with more robust methods, while other studies have been based entirely in experimental contexts.
Conclusion
We used machine learning to estimate GPC in commercial wheat crops and achieved best mean accuracy of R2 = 0.80 between predicted and observed GPC of an unseen dataset, using a model built with thermal, physiological and structural variables. CWSI was important when crops were water stressed, but physiological measures were important in more benign conditions, and structural indicators such as LAI and NDVI were less important.
Acknowledgements
The research undertaken as part of this project is made possible by the significant contributions of growers through both trial cooperation and the support of the GRDC, the author would like to thank them for their continued support. The authors also extend thanks to GRDC affiliates, the Birchip Cropping Group and Riverine Plains Incorporated, and the Foundation for Arable Research, and to Wimmera wheat grower Jonathan Dyer.
References
Apan A, Kelly R, Phinn S, Strong W, Lester D, Butler D, Robson A (2006) Predicting grain protein content in wheat using hyperspectral sensing of in-season crop canopies and partial least squares regression. International Journal of Geoinformatics 2(1), 93–108.
Bauer DF (1972) Constructing confidence sets using rank statistics. Journal of the American Statistical Association67(339), 687–690. https://doi.org/10.1080/01621459.1972.10481279
Bureau of Meteorology (2021). Climate Data Online.
Chen T, Guestrin C (2016) XGBoost: a scalable tree boosting system. In 'Proceedings of the 22nd ACM SIGKDD International Conference on Knowledge Discovery and Data Mining, KDD ’16'. Association for Computing Machinery, New York, NY, USA, pp. 785–794. https://doi.org/10.1145/2939672.2939785
Féret J-B, Gitelson AA, Noble SD, Jacquemoud S (2017) PROSPECT-D: towards modeling leaf optical properties through a complete lifecycle. Remote Sensing of Environment 193, 204–215. https://doi.org/10.1016/j.rse.2017.03.004
Gamon JA, Peñuelas J, Field CB (1992) A narrow-waveband spectral index that tracks diurnal changes in photosynthetic efficiency. Remote Sensing of Environment 41(1), 35–44. https://doi.org/10.1016/0034-4257(92)90059-S
Gooding MJ, Gregory PJ, Ford KE, Ruske RE (2007) Recovery of nitrogen from different sources following applications to winter wheat at and after anthesis. Field Crops Research 100(2-3), 143–154. https://doi.org/10.1016/j.fcr.2006.06.002
Idso SB (1982) Non-water-stressed baselines: a key to measuring and interpreting plant water stress. Agricultural Meteorology 27(1-2), 59–70. https://doi.org/10.1016/0002-1571(82)90020-6
Li Z, Taylor J, Yang H, Casa R, Jin X, Li Z, Song X, Yang G (2020) A hierarchical interannual wheat yield and grain protein prediction model using spectral vegetative indices and meteorological data. Field Crops Research 248, 107711. https://doi.org/10.1016/j.fcr.2019.107711
Magney TS, Vierling LA, Eitel JUH, Huggins DR, Garrity SR (2016) Response of high frequency photochemical reflectance index (PRI) measurements to environmental conditions in wheat. Remote Sensing of Environment 173, 84–97. https://doi.org/10.1016/j.rse.2015.11.013
Øvergaard SI, Isaksson T, Korsaeth A (2013) Prediction of wheat yield and protein using remote sensors on plots—part I: assessing near infrared model robustness for year and site variations. Journal of Near Infrared Spectroscopy 21(2), 117–131. https://doi.org/10.1255/jnirs.1042
Plascyk JA, Gabriel FC (1975) The Fraunhofer Line Discriminator MKII— an airborne instrument for precise and standardized ecological luminescence measurement. IEEE Transactions on Instrumentation and Measurement 24, 306–313. https://doi.org/10.1109/TIM.1975.4314448
Poblete T, Navas-Cortes JA, Camino C, Calderon R, Hornero A, Gonzalez-Dugo V, Landa BB, Zarco-Tejada PJ (2021) Discriminating Xylella fastidiosa from Verticillium dahliae infections in olive trees using thermal- and hyperspectral-based plant traits. ISPRS Journal of Photogrammetry and Remote Sensing 179, 133–144. https://doi.org/10.1016/j.isprsjprs.2021.07.014
Rodrigues FA, Blasch G, Defourny P, Ortiz-Monasterio JI, Schulthess U, Zarco-Tejada PJ, Taylor JA, Gérard B (2018) Multi-temporal and spectral analysis of high-resolution hyperspectral airborne imagery for precision agriculture: assessment of wheat grain yield and grain protein content. Remote Sensing (Basel) 10(6), 930. https://doi.org/10.3390/rs10060930
Rouse JW, Haas RH, Schell JA, Deering DW (1974) Monitoring vegetation systems in the Great Plains with ERTS. NASA Goddard Space Flight Center 3d ERTS-1 Symposium, Vol. 1, Sect. A, SP351, paper A20, 309-317.
Suárez L, Zarco-Tejada PJ, Sepulcre-Cantó G, Pérez-Priego O, Miller JR, Jiménez-Muñoz JC, Sobrino J (2008) Assessing canopy PRI for water stress detection with diurnal airborne imagery. Remote Sensing of Environment 112, 560–575. https://doi.org/10.1016/j.rse.2007.05.009
Verhoef W, Jia L, Xiao Q, Su Z (2007) Unified optical-thermal four-stream radiative transfer theory for homogeneous vegetation canopies. IEEE Transactions on Geoscience and Remote Sensing 45(6), 1808–1822. https://doi.org/10.1109/TGRS.2007.895844
Zarco-Tejada PJ, Camino C, Beck PSA, Calderon R, Hornero A, Hernández-Clemente R, Kattenborn T, Montes-Borrego M, Susca L, Morelli M, Gonzalez-Dugo V, North PRJ, Landa BB, Boscia D, Saponari M, Navas-Cortes JA (2018) Previsual symptoms of Xylella fastidiosa infection revealed in spectral plant-trait alterations. Nature Plants 4(7), 432-439. https://doi.org/10.1038/s41477-018-0189-7
Zhou X, Kono Y, Win A, Matsui T, Tanaka TST (2021) Predicting within-field variability in grain yield and protein content of winter wheat using UAV-based multispectral imagery and machine learning approaches. Plant Production Science 24(2), 137–151. https://doi.org/10.1080/1343943X.2020.1819165
Hyperspectral and thermal remote sensing laboratory (HyperSens)
HyperSens – Hyperspectral Remote Sensing & Precision Agriculture Laboratory
Contact details
Andrew Longmire
FVAS, University of Melbourne
0432 552 773
a.longmire@unimelb.edu.au
@MonkeyCousin
GRDC Project Code: UOM1903-001RSX,