Ameliorating sodicity; what did we learn about ameliorating sodicity constraints with a range of treatments? Yield responses to ripping, gypsum and OM placement in constrained soils
Ameliorating sodicity; what did we learn about ameliorating sodicity constraints with a range of treatments? Yield responses to ripping, gypsum and OM placement in constrained soils
Take home message
- In Qld, it appears a yield gap does exist for cereal grains with substantial positive yield increases generally from combinations of tillage and subsurface nutrient placements
- In the early phases of the experiment, there has been no yield difference between organic and inorganic nutrient application but the input rates are very high. These might diverge in future as Nitrogen supply from the organic treatment might provide a longer release pattern
- With generally high levels of growing season rainfall in crops grown since soil ameliorants were applied, there has not yet been the opportunity for the soil water benefits expected from amelioration of soil sodicity with gypsum to be fully expressed as yield increases.
Background
Model analyses suggest a yield gap between water-limited potential yield and currently achieved production exists across northern Australian grain regions (Hochman and Horan 2018). This yield gap is a function of physical, chemical, and biological factors in each soil, including the capacity of soil to store and release water for efficient plant use. Many regions where yield is constrained contain dispersive soil within the surface 50cm and deeper. Sodicity (a high exchangeable sodium percentage) is a major cause of aggregate dispersion and may compromise soil structure. Dispersive behaviour decreases both soil water availability and nutrient acquisition, increases risk of runoff and erosion, and impairs biological (soil microbial and plant root) activity. Acidity, salinity (presence AND absence) and compaction further constrain yield potentials. However this project focuses on sodicity as the major constraint with often related constraints considered as compounding and/or interacting factors.
Amelioration of subsoil constraints is an expensive process. The engineering challenges and energy requirements are significant. It is important to acknowledge that production benefits from subsoil amendment are more likely to be observed in poorer seasons. In good seasons, root function and activity, and soil moisture, will be able to sustain yield from surface activity and extraction where soils are often less constrained. However in poorer seasons, where subsoil moisture is required to finish a crop, subsoil amelioration may have a proportionately larger impact on yield. Hence a positive return from investments in subsoil amelioration are less likely to be seen in better growing seasons than in drier growing seasons.
A series of linked investments is assessing the economics of ameliorating constrained surface and sub-surface soils in the northern region. The program has four areas covering: (i) spatial soil constraint identification, (ii) amelioration and management of soil constraints, (iii) economics of adoption, and (iv) an overarching communications and extension program. The research into soil amelioration and management has two components led by University of Southern Queensland (USQ). First is a set of six small-plot core experiments exploring detailed amelioration research. There are three sites in northern and central New South Wales (NSW) managed by the University of New England (UNE) located at Forbes, Armatree and Spring Ridge, and three sites in southern Qld managed by the Department of Agriculture and Fisheries (DAF) at Talwood, Millmerran and Dulacca.
This paper briefly describes the treatments being studied and reports on the field trial grain yield results to-date.
Core sites characteristics
All sites were generally alkaline in the upper profile and have an exchangeable sodium percentage (ESP) well over the 6% nominal threshold for classification as sodic (Isbell and National Committee on Soil and Terrain 2021). Profile chloride (Cl) values were generally low, indicating that sodicity was likely to be the primary restriction. The soil chemical characteristics at the six core experiments are below:
Location: Armatree
Soil type: Brown Sodosol, not dispersive (0-10cm) to dispersive (10-20) surface, to strongly alkaline and dispersive at depth, compact surface layers
Depth | pH | pH | EC | Ca | Mg | Na | K | ECEC | ESP | Cl | P |
(cm) | (H2O) | (CaCl2) | (1:5) | (cmol/kg) | % | (mg/kg) | (mg/kg) | ||||
0-10 | 6.0 | 5.3 | 0.20 | 3.7 | 3.4 | 0.91 | 1.00 | 9.0 | 10 | 58 | |
10-20 | 7.8 | 6.8 | 0.20 | 8.5 | 7.9 | 2.63 | 0.83 | 19.9 | 13 | 7 | |
30-40 | 9.3 | 8.3 | 0.45 | 13.1 | 12.6 | 5.78 | 0.81 | 32.3 | 18 | 8 | |
60-70 | 9.4 | 8.4 | 0.58 | 12.3 | 13.4 | 6.35 | 0.96 | 33.0 | 19 | 6 | |
Location: Forbes
Soil type: Brown Vertosol, not dispersive (0-10cm) to dispersive (10-20) surface, to strongly alkaline and dispersive at depth
Depth | pH | pH | EC | Ca | Mg | Na | K | ECEC | ESP | Cl | P |
(cm) | (H2O) | (CaCl2) | (1:5) | (cmol/kg) | % | (mg/kg) | (mg/kg) | ||||
0-10 | 6.3 | 6.1 | 0.39 | 8.7 | 7.7 | 2.13 | 0.77 | 19.3 | 11 | 89 | |
10-20 | 7.9 | 6.9 | 0.30 | 15.4 | 10.2 | 4.76 | 0.55 | 30.9 | 15 | 12 | |
30-40 | 9.1 | 8.2 | 0.64 | 12.5 | 11.3 | 8.14 | 0.49 | 32.5 | 25 | 4 | |
60-70 | 9.1 | 8.3 | 0.85 | 11.3 | 10.4 | 9.57 | 0.56 | 31.9 | 30 | 1 | |
Location: Spring Ridge
Soil type: Black Vertosol, moderate ESP and salinity in surface, increasing to high ESP and salinity at depth, but both are non-dispersive due to the salinity
Depth | pH | pH | EC | Ca | Mg | Na | K | ECEC | ESP | Cl | P |
(cm) | (H2O) | (CaCl2) | (1:5) | (cmol/kg) | % | (mg/kg) | (mg/kg) | ||||
0-10 | 8.2 | 0.54 | 31.7 | 41.7 | 3.3 | 2.4 | 79.1 | 4 | 100 | ||
10-20 | 8.2 | 0.62 | 37.2 | 43.5 | 5.2 | 1.4 | 87.3 | 6 | |||
30-40 | 8.3 | 1.94 | 31.0 | 51.5 | 13.9 | 1.0 | 97.4 | 14 | |||
60-70 | 8.3 | 2.52 | 28.7 | 56.7 | 19.5 | 1.1 | 106 | 18 | |||
Location: Dulacca
Soil type: Grey/Brown Vertosol, surface soils not spontaneously dispersive but subsurface highly dispersive.
Depth | pH | pH | EC | Ca | Mg | Na | K | ECEC | ESP | Cl | P |
(cm) | (H2O) | (CaCl2) | (1:5) | (cmol/kg) | % | (mg/kg) | (mg/kg) | ||||
0-10 | 8.5 | 7.7 | 0.21 | 18.1 | 8.0 | 2.73 | 0.93 | 29.8 | 9 | 43 | 9 |
10-20 | 8.8 | 7.8 | 0.25 | 15.8 | 9.8 | 3.99 | 0.61 | 30.3 | 13 | 53 | 14 |
30-40 | 8.1 | 7.3 | 0.46 | 15.4 | 12.3 | 7.10 | 0.45 | 35.3 | 20 | 102 | 4 |
60-70 | 6.8 | 6.7 | 0.66 | 12.0 | 12.8 | 8.83 | 0.48 | 34.1 | 26 | 275 | 8 |
Location: Millmerran
Soil type: Grey/Brown Vertosol, surface and subsurface soils not spontaneously dispersive, very compact soil through the profile.
Depth | pH | pH | EC | Ca | Mg | Na | K | ECEC | ESP | Cl | P |
(cm) | (H2O) | (CaCl2) | (1:5) | (cmol/kg) | % | (mg/kg) | (mg/kg) | ||||
0-10 | 6.6 | 6.3 | 0.15 | 8.4 | 6.6 | 2.37 | 0.31 | 17.7 | 13 | 153 | 38 |
10-20 | 8.7 | 7.4 | 0.24 | 10.6 | 9.0 | 3.36 | 0.20 | 23.2 | 14 | 330 | 5 |
30-40 | 6.9 | 6.2 | 0.38 | 9.5 | 15. | 6.82 | 0.14 | 31.4 | 22 | 428 | 3 |
60-70 | 6.4 | 5.5 | 0.43 | 10.2 | 16.4 | 8.79 | 0.18 | 35.5 | 25 | 457 | 2 |
Location: Talwood
Soil type: Red/Brown Vertosol with surface soils not spontaneously dispersive, subsurface highly dispersive at 60-70cm.
Depth | pH | pH | EC | Ca | Mg | Na | K | ECEC | ESP | Cl | P |
(cm) | (H2O) | (CaCl2) | (1:5) | (cmol/kg) | % | (mg/kg) | (mg/kg) | ||||
0-10 | 8.3 | 7.6 | 0.17 | 27.5 | 4.7 | 1.8 | 1.3 | 35.5 | 11 | 22 | 18 |
10-20 | 8.7 | 7.9 | 0.23 | 27.8 | 7.0 | 3.8 | 0.7 | 39.3 | 10 | 26 | 3 |
30-40 | 8.9 | 7.8 | 0.36 | 22.5 | 9.4 | 7.0 | 0.4 | 39.4 | 18 | 73 | 2 |
60-70 | 9.2 | 7.9 | 0.44 | 20.3 | 9.9 | 9.9 | 0.5 | 40.7 | 24 | 163 | 2 |
Experiment treatments
This research focussed on eliminating sodium as a constraint for the upper 50 cm of a soil profile. It was ‘proof-of-concept’ research, intended to explore effects of different strategies on soil water storage and grain yields. Gypsum application rates were designed to remediate the ESP to ≤ 3% in either or both of the top 20 cm of soil and half (a quarter in NSW) of the soil volume in bands from 20 cm down to 50 cm depth.
Similar treatment structures are used in both NSW and Qld, with both physical and chemical ameliorants, a range of options exploring impacts and/or interactions between tillage (shallow and deep), deep placement of nutrients (as inorganic or organic forms), surface and subsurface applications of gypsum to reduce ESP to < 3%, incorporating organic amendments (lucerne pellets in NSW and composted feedlot manure in Qld), and applying elemental sulfur (ES) to decrease soil pH (Table 1). For subsoil amelioration, gypsum rates were compared against an organic amendment compost (Qld)/lucerne pellet (NSW), and ES to reduce pH and dissolve calcium carbonate to produce gypsum in-situ. Organic matter also acts to limit aggregate dispersion (as well as providing nutrients at depth) and, whilst not reducing ESP, may act to improve water holding capacity and pore stability.
Table 1. Treatment structure for core soil constraints sites in southern Queensland
Trt | Synopsis |
|---|---|
1 | Untreated control – typically managed as rest of field by the grower |
2 | Ripping to 20-25 cm |
3 | Ripping to 20-25 cm with application of 50 kg N/ha, 30 kg P/ha (50 kg K/ha) +Zn in bands |
4 | Surface spread gypsum, then ripping to 20-25 cm with application of NP(K)Zn in bands |
5 | Ripping to 20-25 cm with application of NP(K)Zn in bands, then re-rip to ≈35 cm |
6 | Ripping to 20-25 cm with application of NP(K)Zn and subsurface gypsum in bands |
7 | Surface spread gypsum, then ripping to 20-25 cm with application of NP(K)Zn and subsurface gypsum in bands |
8 | Surface spread gypsum, then ripping to 20-25 cm with application of NP(K)Zn in bands, then re-rip to ≈35 cm |
9 | Surface spread gypsum, then ripping to 20-25 cm with application of NP(K)Zn and subsurface elemental sulfur (ES) in bands |
10 | Ripping to 20-25 cm with application of high-rate 280N 100P (K) +Zn equivalent to N and P additional from organic matter (OM) treatment in bands, then re-rip to ≈35 cm |
11 | Ripping to 20-25 cm with application of OM in bands, then re-rip to ≈35 cm |
12 | Ripping to 20-25 cm with application of OM and ES in bands, then re-rip to ≈35 cm |
13 | Surface spread gypsum, ripping to 20-25 cm with application of OM and ES and subsurface gypsum in bands, then re-rip to ≈35 cm |
The applied gypsum rate for subsurface placement was 50% (25% in NSW) of the total needed for the whole 20 to 50 cm layer of soil: if a total of 20 t/ha of gypsum was theoretically needed to remediate the 20 to 50 cm layer in this initial application 10 t/ha was applied in Qld and 5 t/ha in NSW.
Agronomic timings of crop years are outlined in Table 2.
Table 2. Agronomic information for crops across Qld soil constraints core sites.
Site | Crop | Sown | DM | GSR | Harvest |
|---|---|---|---|---|---|
Millmerran | Sorghum 19-20 | 21-Jan-2020 | 05-May-2020 | 201 | 10-Jun-2020 |
Sorghum 20-21 | 01-Nov-2020 | 02-Feb-2021 | 236 | NR | |
Barley 2021 | 20-May-2021 | 21-Sep-2021 | 141 | 01-Nov-2021 | |
Dulacca | Wheat 2020 | 15-May-2020 | 16-Sep-2020 | 72 | 15-Oct-2020 |
Wheat 2021 | 05-Jul-2021 | 04-Nov-2021 | *245 | Hand harvest | |
Talwood | Sorghum 20-21 | 06-Jan-2021 | 08-Jun-2021 | 321 | 21-Jun-2021 |
Results and discussion
Queensland results
Three core sites in Qld have had six crops grown but only grain yield from five, with the 2020-21 sorghum crop at Millmerran unable to be harvested due to rain and mice damage. Growing season conditions for most crops have been very favourable from in-crop rainfall events. The first wheat crop at Dulacca had lowest in-crop rain with 72 mm received between sowing and dry matter maturity sampling.
Visual crop responses have been seen across several site years, e.g. Millmerran in April 2020 (Figure 1). Treatment effects can be observed but also some underlying site variability.
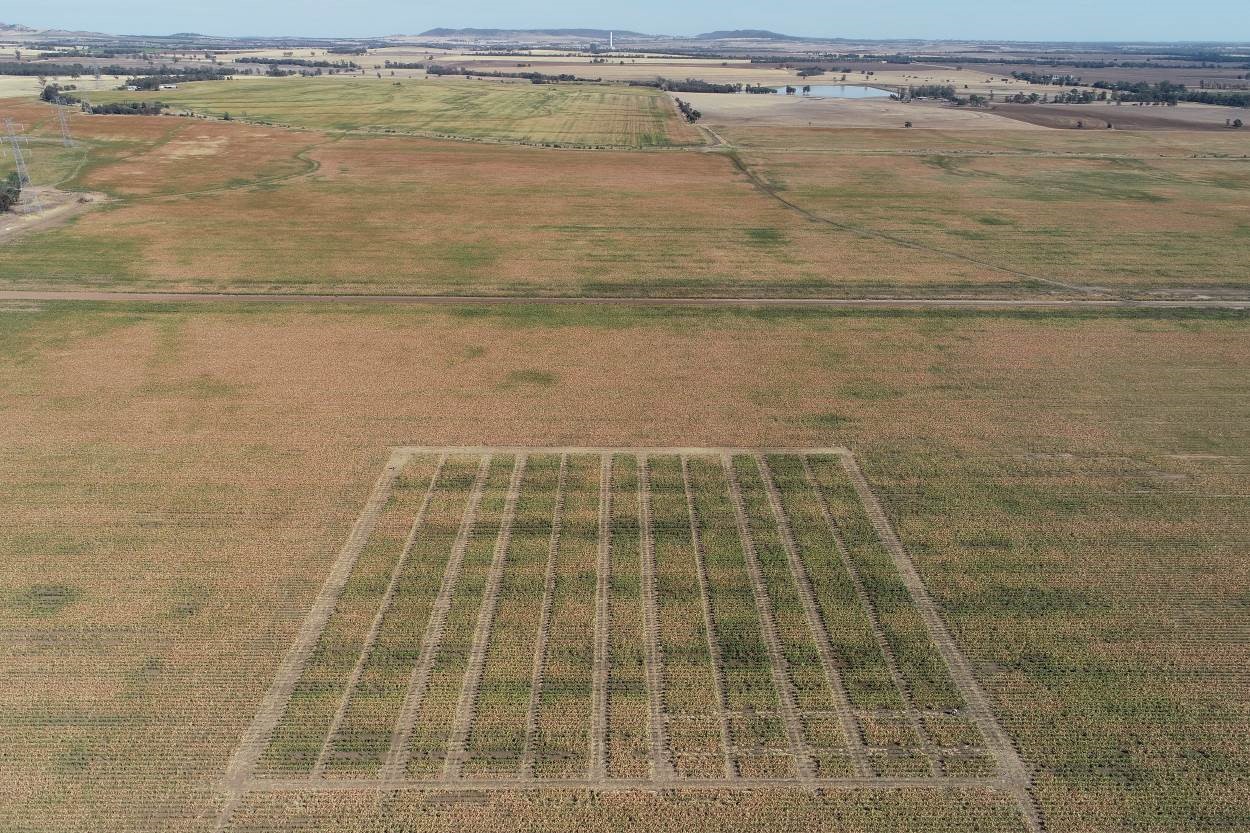
Figure 1. Image across the Millmerran core site looking west 27 April 2020
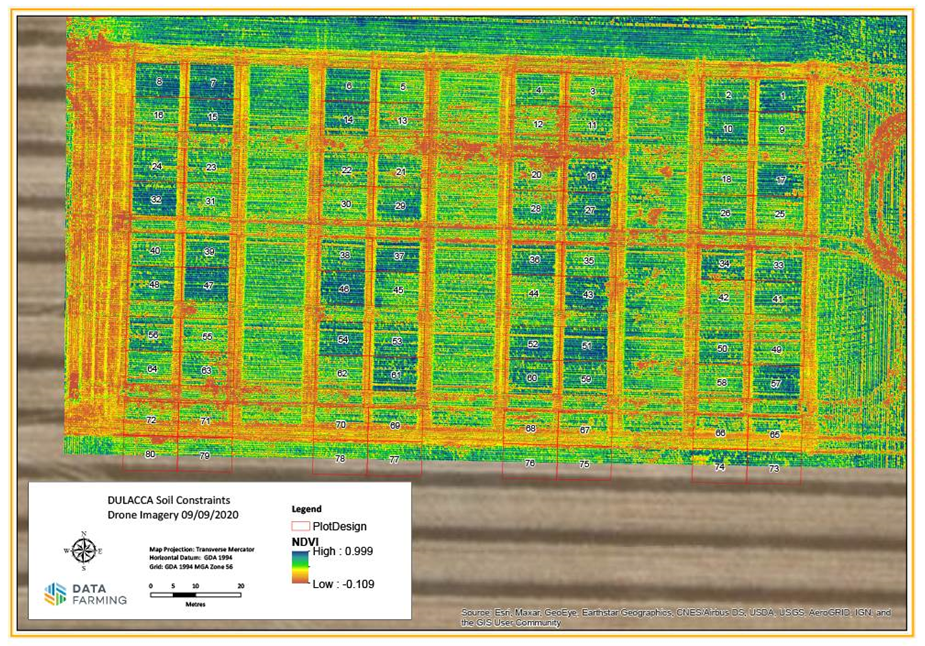
Generally NDVI measurements have been increased in plots with higher nutrition applications, typically Trts 10-13 (Table 1) e.g. Dulacca wheat in 2020 (Figure 2) the dark blue plots are those.
Figure 2. NDVI image of Dulacca site September 2020.
Apart from Talwood (Fig 3c) cumulative grain yields are generally increased through experimental treatments compared to current farmer practice.
Growing season rainfall at Talwood for the single-skip sorghum crop was >300 mm, so subsoil water was not really needed. Some soil water measures indicate the site was wetter after the sorghum crop than when it was planted (data not shown). The negative impact of the OM treatments (11-13) was related to crop phenology, those plots flowered 10-7 days in-front of the remainder of the experiment. Early flowering treatments received more damage from midge and other insects resulting in negative yield effects compared to later flowering treatments. Maturity dry matter measurements of those treatments were slightly less than the remainder of the trial, but the grain harvest index values highlight the grain yield impact (data not shown).
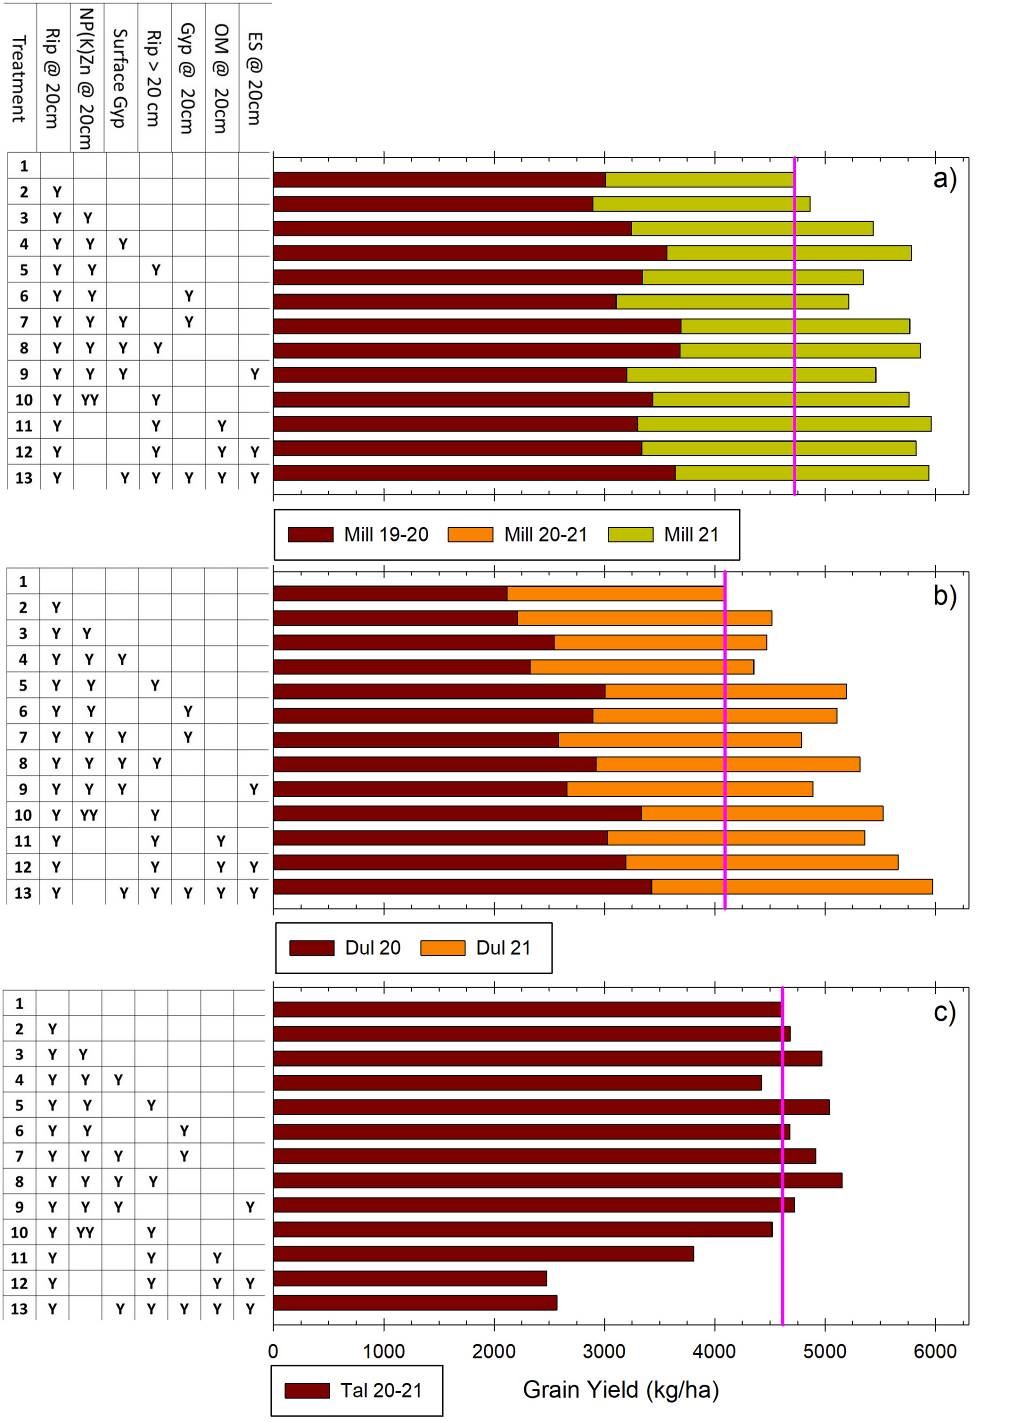
Figure 3. Cumulative grain yield vs treatment for a) Millmerran, b) Dulacca and c) Talwood experiments. Pink reference line equals the untreated control yield.
At Millmerran and Dulacca, the yield increases varied in scale but have some common features being a combination of tillage and nutrition. At Millmerran (Figure 4), treatments 3-13 all have tillage to at least 20-25 cm (some deeper) and a subsurface nutrient application of either inorganic or organic sources. The average yield increase across all those treatments is 945 kg/ha or a 20% gain in yield.
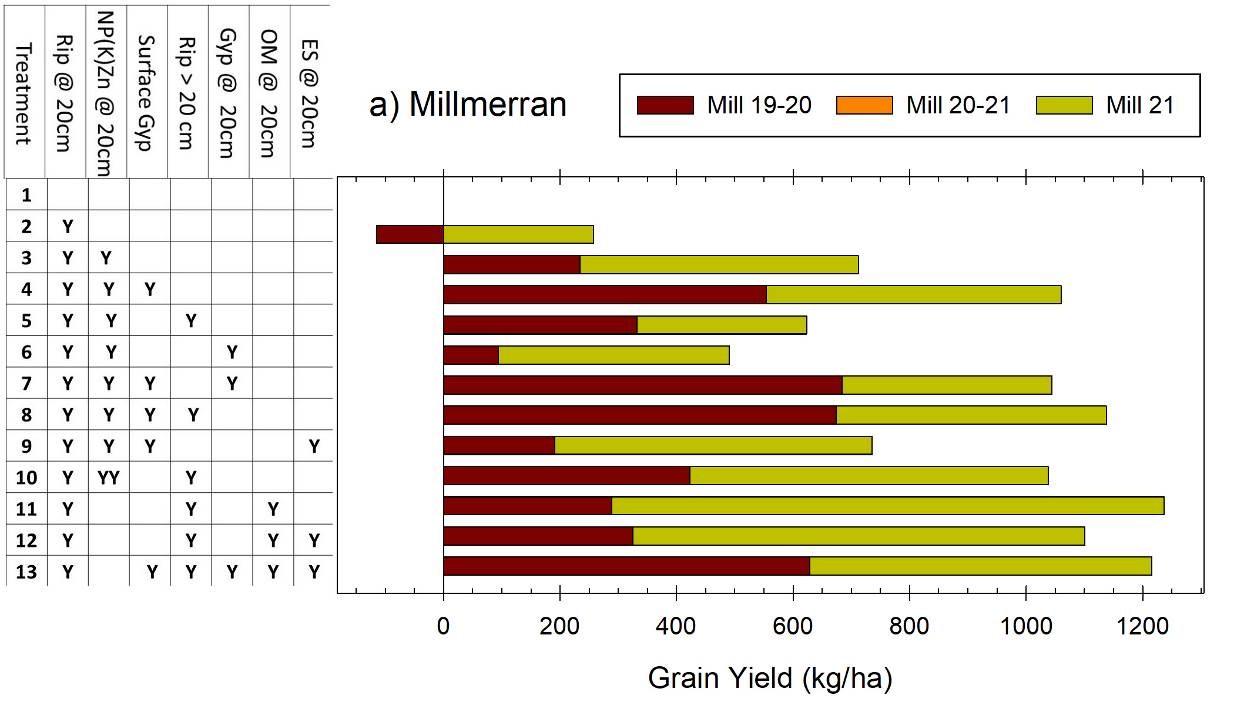
Figure 4. Change in grain yield vs untreated control at Millmerran for sorghum in 19-20 and barley in 2021
For Dulacca (Figure 5), the tillage treatments all appear to be contributing to increased yield particularly the deeper ripping (treatments 5, 8, 10-13). A nutrient response is also evident, more prominent with the high nutrient applications (treatment 10-13). Treatment 5 (ripping > 20 cm and subsurface nutrient) had cumulative yield gain of 1100 kg/ha (27%). Aggregating all the deep tillage treatments together (treatment 5, 8, 10-13) the increase is 1410 kg/ha (34%).
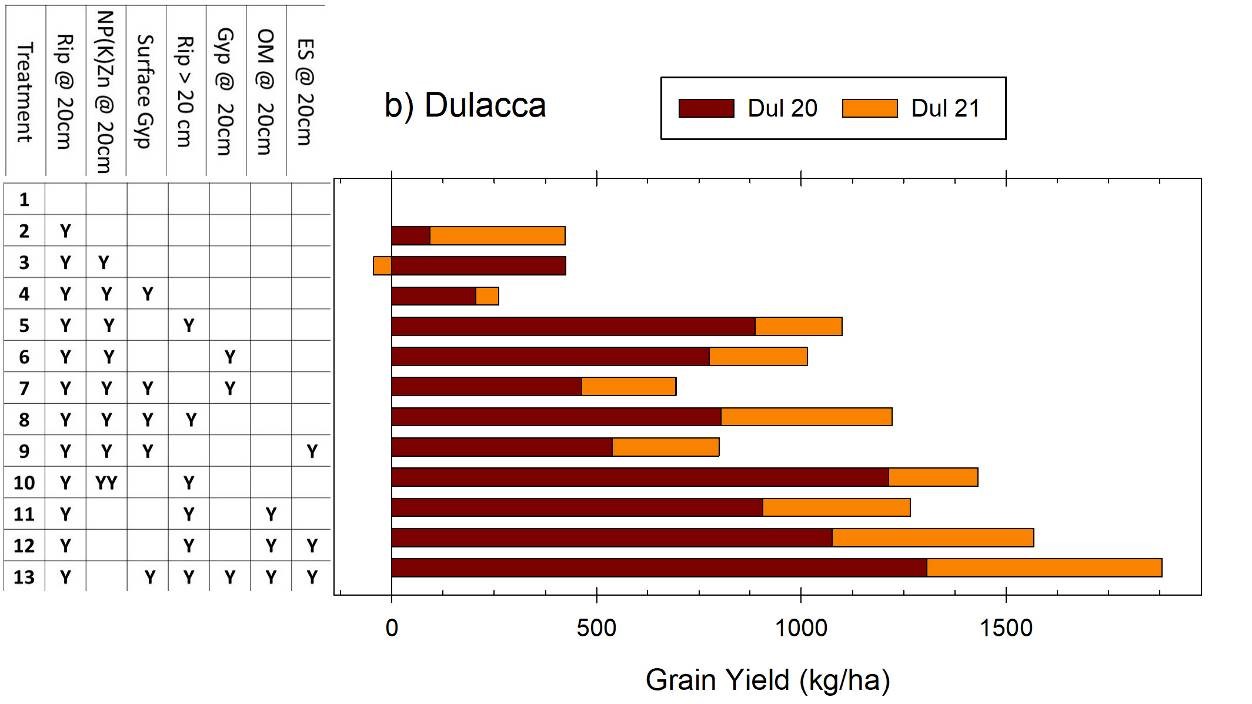
Figure 5. Change in grain yield vs untreated control at Dulacca for wheat in 2020 and 2021
While gypsum has been applied in significant quantities at the three experiments, contributions to increasing yield under the better seasonal conditions across the sites to-date are not evident at this stage of the experiment life.
NSW results
The NSW sites had one winter crop each in 2020, followed in 2021 by a winter crop at Forbes and Armatree, and a sorghum crop at Spring Ridge sown in October. All sites and crops have had wet to very wet fallows and growing seasons. In 2021, they used little of the available soil water during grain filling, but in 2020 Armatree and Spring Ridge used most of the profile, with roots and cracking to at least 1m depth.
Armatree: wheat then canola
In the 2020 wheat crop at this site, growing conditions were wet during winter and spring, but dried out as the crops were filling. The OM treatments had the highest biomass production at flowering, but ran out of moisture during grain fill and finished with yields similar to the controls. Otherwise, deep ripping treatments generally increased yield by ~20% compared to the controls.
2021 was a wet year, with the canola crop waterlogged in comparison to the large crops grown locally in the previous year. The highest yields came off the 3 treatments containing OM, and they outperformed the controls by ~0.7t/ha (30%), with the OM+ES being the most obvious visually between flowering and harvest. Deep ripping treatments (± gypsum) also gave an increase in yield (~0.15t/ha) compared to the control. The shallow rip treatments (treatment 2-4) had very little effect in the second year, producing similar yields to the control treatment, in comparison to 2020 where even shallow rips gave a yield increase.
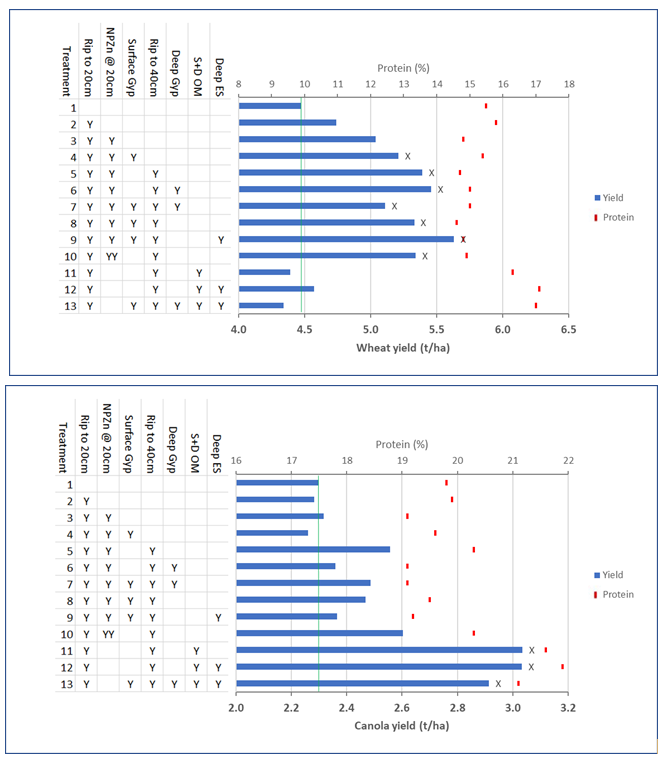
Figure 6. Armatree yield and protein data for wheat in 2020 and canola in 2021. Treatments topped with an X are significantly different to the control treatment.
Forbes: canola then barley
The site was waterlogged for most of winter 2020, and still had moisture in the profile at harvest, so provided little information on changes in soil structure and PAWC as a result of amendments. There was no significant difference in yield between treatments, partly due to a variable plant population and waterlogging, and partly to harvester losses in the higher biomass plots. The higher protein content in the OM treatments suggests that these plots did yield higher.
The site was even wetter in 2021, with water in the wheel tracks for most of the season and areas of the trial lost to waterlogging. Again, there was considerable moisture left in the profile when the barley reached maturity. The controls averaged ~4.5t/ha with 9% protein.
There was a large and significant increase in yield in most of the deep ripping treatments this year, with the increase averaging 1.9t/ha (42% increase) compared to the control. There was little difference between the amendments applied to the deep ripped plots, and even the deep ripped plots with no amendments added. However, we are expecting that the plots with gypsum, OM or elemental sulfur should have better structure for longer than the unamended deep ripped plots.
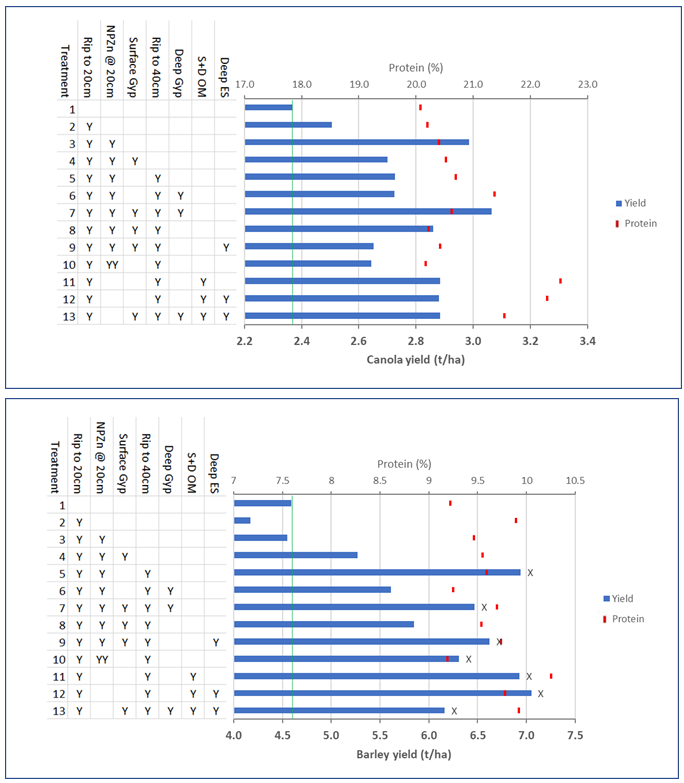
Figure 7. Forbes yield and protein data for canola in 2020 and barley in 2021. Treatments topped with an X are significantly different to the control treatment.
Spring Ridge
Yield outcomes from the current sorghum crop will be available later in the year. In 2020, the barley crop was very high yielding (over 6t/ha) across the whole site, but there were no differences between treatments. While the site is sodic and saline, the lack of difference and overall high yields suggests that the site is not as constrained as first thought, at least in a wet season.
Effect of amendments on soil structure
The Armatree site has also provided information on the effect of the treatments on soil structure two years after application. An RTK GPS used at sowing found that the height of the soil surface of the plots containing ES, and the treatment with both surface and deep gypsum, had the most elevated surface height, being 3-5cm higher than the unripped control.
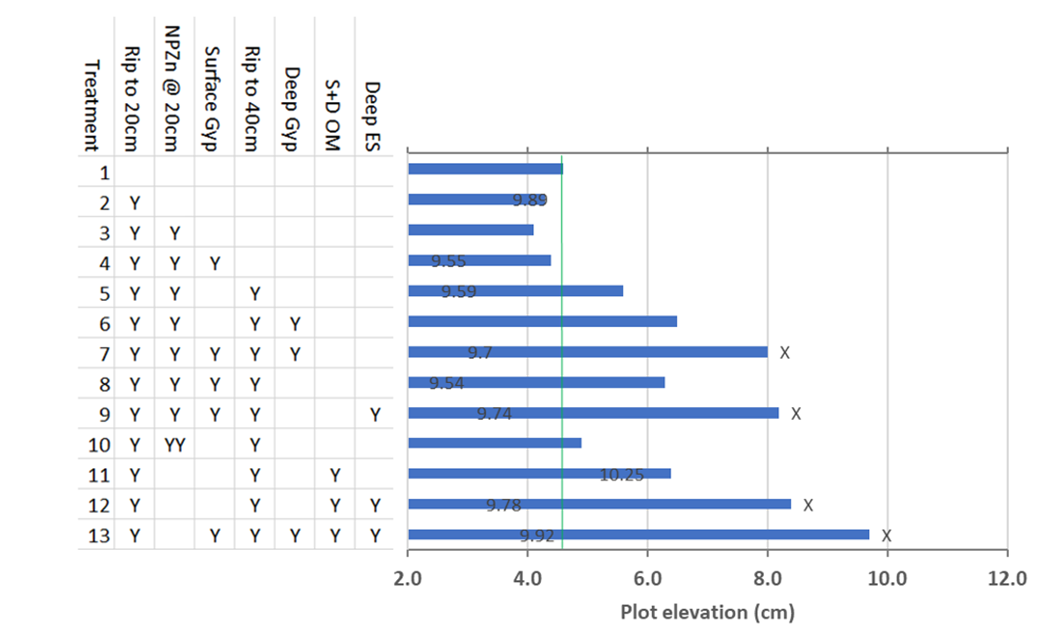
Figure 8. Elevation of treatment plots at Armatree.
Discussion
In the majority of sites tillage alone was beneficial in the first two seasons. Yield responses, even in good to wet seasons across eastern Australia, were still observed to ripping alone. These yield responses, in the order of 20-40%, were recorded in seasons where we considered responses were less likely to be observed as a result of generally high levels of growing season rainfall. These results interact with nutrition in a number of ways at each of the locations. We believe that in locations where deep ripping alone has yielded as much as tillage with nutrition, that at least part of that response may be associated with opening up root access to layers of soil that may have accumulated nutrition. In the seasons we have observed so far, the extra aeration and oxygen in the root system following tillage may have been reduced by waterlogging and hence not allowed the extra nutrition to fully express as yield in those treatments.
The differences in N source between NSW and Qld sites may also have interacted with the wetter seasons in NSW and resulted in interesting nitrogen use efficiency observations. The total N supplied in NSW (20t/ha as lucerne) amounted to nearly 800 kg N/ha or labile (low C:N) organic material. In Qld, the N source was applied at half the rate and as a ‘pre-mineralised’ product. Hence the magnitude of the responses to nutrition in NSW are commensurately greater and warrant further investigation. In good seasons where biomass production is not constrained by either water or nitrogen, and nitrogen release is high, conversion to both biomass and yield is efficient and root systems from season to season may redistribute this high ‘slug’ of organic N more evenly through the profile. Soil cores at the end of this season may identify if N redistribution and N loading of the profile, may occur in these circumstances.
Overall, wet conditions have meant that the full impact of amendments on improving soil structure and particularly increasing PAWC, were not observed. Where water is relatively non-limiting, benefits from gypsum improving structure and porosity with the impact of increasing plant available water are less likely to be observed. However, it should have allowed the gypsum, and possibly elemental sulfur, to spread through a larger volume of soil than would have occurred in dry years – soil cation results will confirm this later this year. Therefore, despite the absence of any significant gypsum effect in these two seasons at any site, (relative to the nutrition benefits), this does not preclude gypsum having improved soil structure and those benefits being observed in subsequent years. Evidence that gypsum has improved structure, if not yet yield, is found in the surface elevation observations at Armatree. Ripping effects are potentially declining after 15 months with above average rainfall. This is ‘as expected’ if ripping effects are not stabilised in some way. However, where gypsum was applied at both surface and depth and where it was supplied with OM and/or generated in situ with ES, then plots had not slumped back to their original levels.
One surprising aspect of the soil pits dug between the seasons was evidence that elemental S had oxidised. The window of time when the ES was present and oxygen and water were both available was quite small at most of these sites given the depth at which it was placed and the amount of water in the profiles. As ES usually has a lag period while the micro-organisms that use it as an energy source multiply up enough to oxidise the ES, it is fascinating that this occurred at all. This suggests that given the absence of ES in the profile, populations of S oxidising bacteria in the subsoil may be greater than expected.
Conclusions
Yield gaps exist in the Qld core sites with treatments at two sites delivering substantial increases in cereal grain yield. There have been no pulse crops in the Qld sites to-date.
Apart from the Talwood site which had an exceptional rainfall year, tillage and nutrition appear to be the consistent keys to yield increases in Qld sites. Possibly the removal of legacy compaction from farming practices prior to establishment of current controlled traffic, or just loosening of the soil volume to allow more water, air and root access are mechanisms. There are no substantial differences in the form of nutrient delivery, between inorganic or organic materials in Qld. This may evolve over time as N supply in OM treatments is likely to have a release pattern that persists over an extended period.
So far, the gypsum applications on the non-dispersive surface soils haven’t appeared to have any influence on yield. No additional measurement of structural changes on site has occurred yet. Subsurface gypsum applications potentially have been ameliorating the soil profile during the period since application, but seasonal conditions with high rainfall in-crop probably has not required any substantial use of additional subsoil water made available as a result of amelioration.
References
Hochman, Z, Horan, H (2018) Causes of wheat yield gaps and opportunities to advance the water-limited yield frontier in Australia. Field Crops Research 228, 20-30.
Isbell, RF, National Committee on Soil and Terrain (2021) 'The Australian Soil Classification, Third Edition.' (CSIRO Publishing)
Acknowledgements
The research undertaken as part of this project is made possible by the significant contributions of growers through both trial cooperation and the support of the GRDC, the authors would like to thank them for their continued support.
Contact details
David Lester
Department of Agriculture and Fisheries Queensland, Toowoomba
PO Box 2282, Toowoomba, Qld 4350
Ph: 07 4529 1386
Email: david.lester@daf.qld.edu.au
Chris Guppy
University of New England, Armidale
Agronomy and Soil Science
Ph: 02 6773 3567
Email: cguppy@une.edu.au
GRDC Project Code: USQ1803-002RTX,

