Carbon Neutral Grain Farming by 2050 – an example in calculating net emissions for a broadacre farm and strategies to reduce net emissions
Carbon Neutral Grain Farming by 2050 – an example in calculating net emissions for a broadacre farm and strategies to reduce net emissions
Author: Mandy Curnow, Department of Primary Industries and Regional Development | Date: 21 Feb 2022
Key messages
- Agricultural carbon emissions are largely due to methane emissions from ruminants but emissions from nitrogenous fertilisers and other inputs are important, particularly in a cropping enterprise.
- Carbon emissions are calculated for different reasons; state level reporting, industry level product emissions or on-farm emissions and intensities. Its important to understand what is included in the calculations.
- Undertake a carbon account on farm to understand total emissions and identify any ‘hotspots’ that can be reduced.
- Carefully consider why you are reducing emissions and how they contribute to your overall farm goals.
Introduction
Greenhouse Gas (GHG) accounting takes place at many levels: state and national, industry, product, and at the farm gate. Each has its own set of questions to be answered and value in providing a benchmark on progress (or otherwise) towards community and consumer expectations of lowering GHG emissions and global warming.
On-farm carbon accounts are valuable in providing a baseline of emissions within the farm business. They give total carbon emissions of the farm business, provide an estimate of the emissions intensity of a product and identify ‘emission hotspots’ within the farm business.
How do we measure GHG emissions?
There are many different greenhouse gases, but the most important ones are carbon dioxide (CO2), methane (CH4) and nitrous oxide (N2O), which make up 76%, 16% and 6% of the global GHGs. However, these gases have different global warming potentials (GWP) with N2O being the most warming of the naturally produced gases. To compare the gases and their GWP when undertaking carbon accounting, the International Panel on Climate Change (IPCC) regularly reviews research and provides a weighting to each and presents them in CO2 equivalents expressed as
CO2-e. Currently the weighting factors for GWP are:
1 tonne of CO2 = 1 tonne of CO2-e
1 tonne of CH4 = 28 tonnes of CO2-e
1 tonne of N2O = 265 tonnes of CO2-e
From this we can see that any emissions of N2O and CH4 have a large impact on the published carbon accounts.
There are three types of carbon accounts that you will find in any search on emissions in agriculture and they serve different purposes and will give different answers, so it is important to understand how they are calculated.
State and national carbon accounts
State and national GHG emission inventories are aligned to international reporting guidelines and are broken into Sectors, which account for all the direct emissions from that sector. The sectors include Energy, Industrial processes, Agriculture, Land use and land use change, Waste, and other sources.
Each of these sectors report different contribution categories, and for broadacre agriculture, the key categories are:
- Enteric Fermentation (ruminant methane)
- Manure Management
- Agricultural Soils
- Field Burning of Agricultural Residues
- Liming
- Urea Application
- Other Carbon-containing Fertilisers
Agriculture in WA contributed approximately 11% of the state’s emissions in 2020, primarily from enteric methane (ruminants such as cattle and sheep).
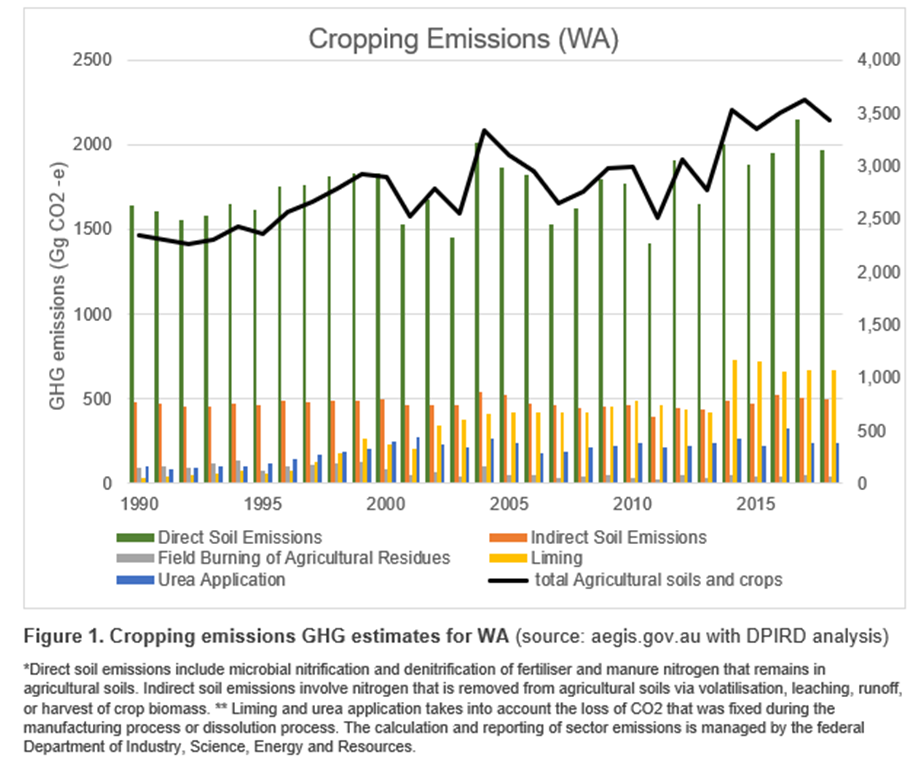
As emissions from crop production are not specifically calculated, they must be extrapolated from categories 3–7 above and by determining the proportion of soil emissions and fertiliser use attributable to crop rather than pasture. Figure 1 is a DPIRD analysis of the National Inventory database and shows that the greatest contributions to GHG emissions are direct soil emissions and a recent increase due to lime application.
Life Cycle Analysis (LCA)
Life Cycle Analyses are often described as ‘cradle to grave’ analyses and can include assessments, not just of carbon, but also of water, pollution and land use. LCAs are valuable for industry to understand the carbon intensity of a product and include all inputs pre-farm gate through to the sale of the product, including processing and transport. LCAs are sometime done up until export of a product or point of slaughter for an animal. An LCA is usually conducted by an approved LCA practitioner or research institution.
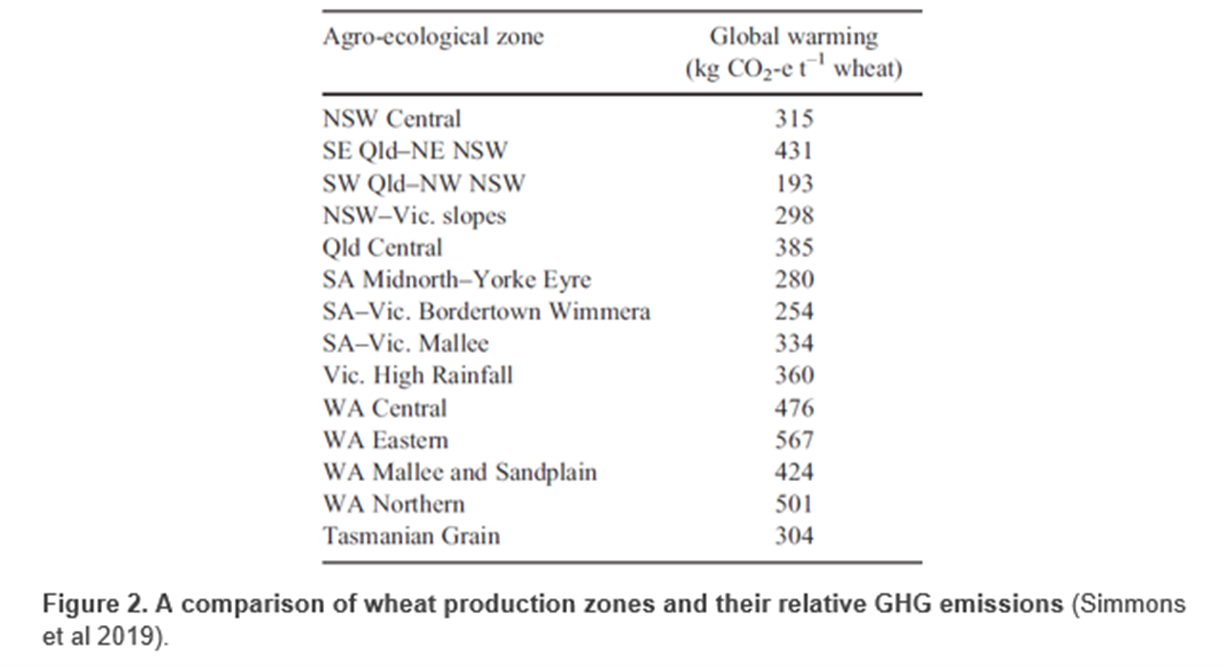
An example output from an LCA for the wheat industry shows the variation in emissions across GRDC zones (Figure 2).
Business/farm carbon accounts
Business/farm carbon accounts are valuable to producers and industry because they identify carbon contributions from inputs and outputs and provide a baseline or benchmark of emissions and subsequent changes in emissions when verifying the carbon status of the farm, product, or the generation of carbon credits. Benchmarking your carbon emissions allows management decisions to be made with real information — you can’t manage what you don’t measure!
A farm carbon account should include all levels of emissions to the point of export from the farmgate. The types of emissions are categorised as:
Scope 1 - emissions that occur on site e.g., enteric methane, CO2 from diesel
Scope 2 - electricity production emissions associated with use of electricity on site
Scope 3 – emissions associated with purchased inputs such as fertilisers, herbicides, supplementary feed.
Farm carbon accounts are expressed as total tonnes CO2-e per farm, per hectare or per animal and can also provide an on-farm (scope 1, 2 and 3) product intensity expressed as kg CO2-e per kilogram of product e.g., 0.70kg CO2-e/kg canola.
There are several on-line carbon calculators that can give producers a good indication of their GHG emissions by farm and product. This allows producers to understand their hotspots and where to focus efforts to reduce emissions for maximum impact. For example, many people assume that reducing electricity consumption or switching to renewables will significantly reduce their farm’s carbon footprint. In fact, on large wheatbelt farms, electricity use makes up no more than 1–2% of total emissions.
Each tool has its strengths and weakness and gives slightly different results due to its underlying assumptions. The tools that DPIRD recommends at this stage are those supported by the University of Melbourne’s Climate Change Çentre and are based on Australia’s National GHG Inventory (www.piccc.org.au/resources/Tools ). To read more about how available tools may vary, please see a report commissioned by DPIRD (www.agric.wa.gov.au/climate-change/how-calculate-carbon-emissions-your-own-farm-business ), authored by Richard Brake.
The generation of carbon credits requires a detailed carbon account, usually carried out by a consultant or carbon accumulator, however, it is important for producers to undertake their own carbon account exercise so that they understand their emissions before deciding on any action that may affect the productivity or profitability of their farm in the long term.
Example carbon accounts from WA cropping enterprises
Using the PICCC grains and livestock calculators, we calculated the carbon account for four representative farms in WA. These farm examples provide some ballpark emission figures and compositions for different farm enterprises and locations (Table 1). A detailed report can be found at agric.wa.gov.au/carbon-farming/carbon-calculators-%E2%80%93-western-australian-example-farms.
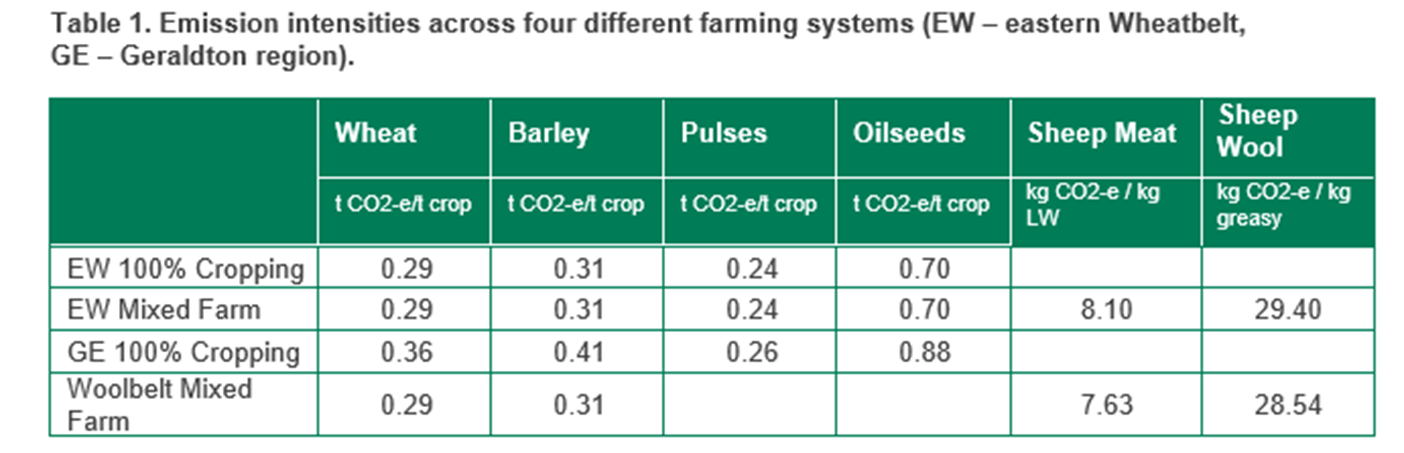
Emissions as well as the composition of these emissions, vary greatly across the different farms. While the Woolbelt mixed farm was the smallest in hectares, it had the largest number of livestock in the system, and the livestock contributed the largest emissions to the farm’s total emissions due to the enteric methane generated by rumen fermentation. The eastern Wheatbelt (EW) 100% cropping farm had the lowest total emissions, as it was the farm with the lowest intensity of fertiliser and had no livestock.
Emissions profile of a 100% grain production enterprise
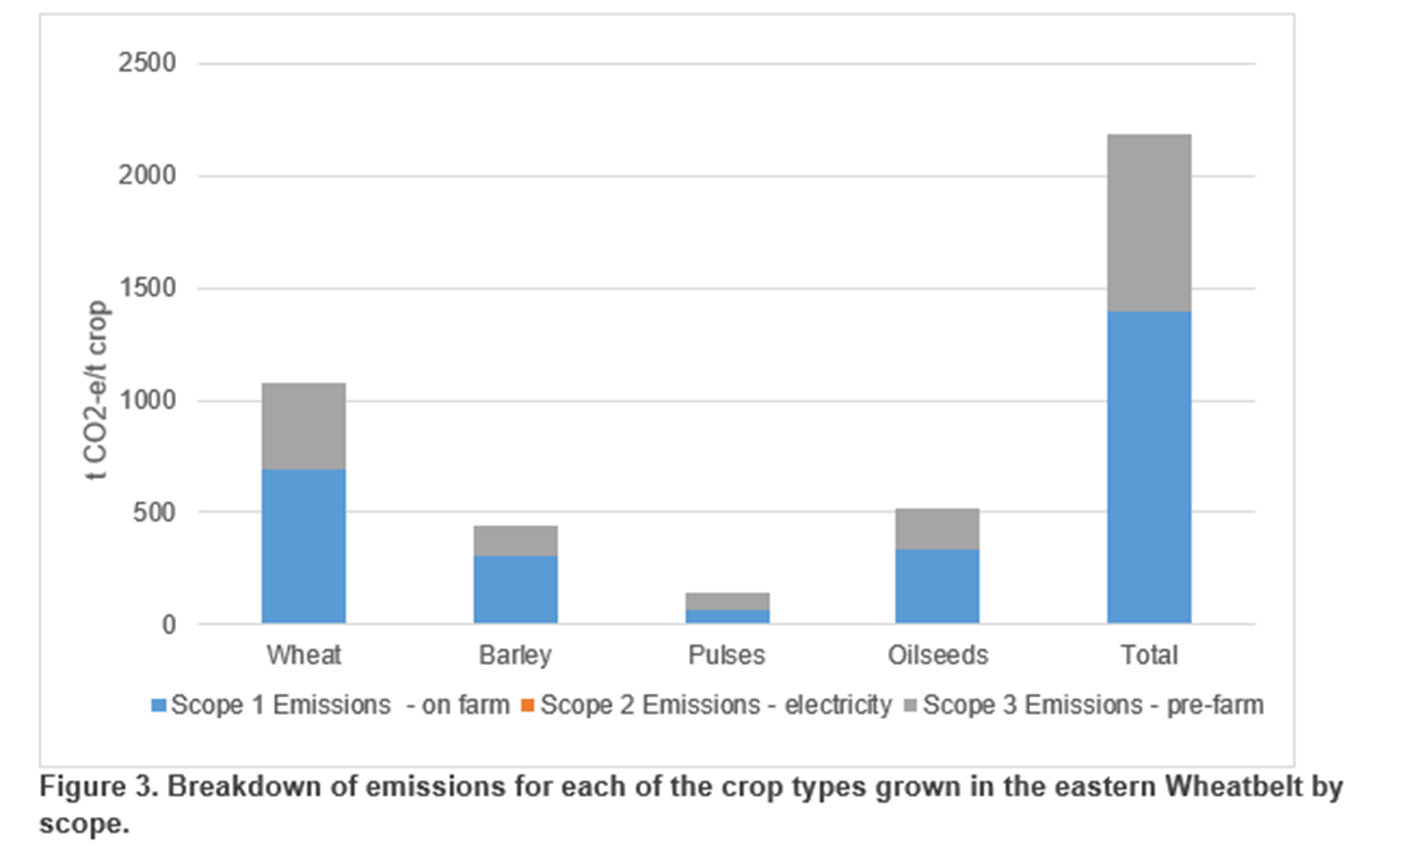
Table 2 shows the inputs used in calculating the carbon account for the 100% cropping example in the eastern Wheatbelt.
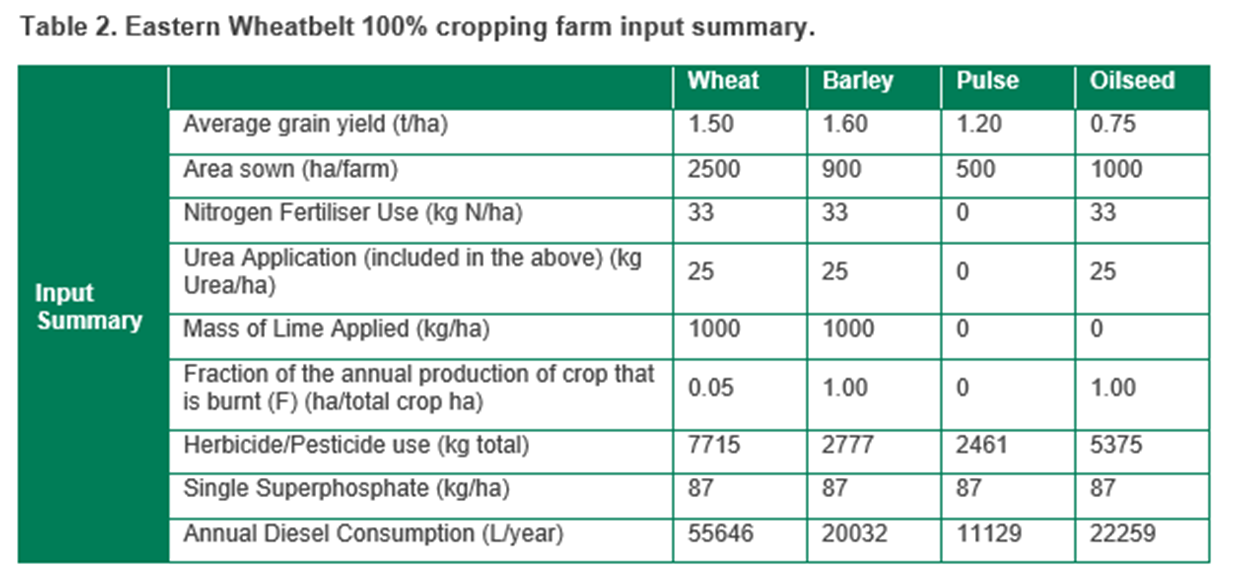
Fertiliser and fuel were the two largest scope 1 emission contributors (Figure 3) and the net farm emissions totalled 2184t CO2-e/farm. The pulse crop gave the least emissions due mainly to the absence of nitrogenous fertiliser application. Most of the emissions produced were by the wheat enterprise, which is to be expected, as it is the largest proportion of crop grown. Scope 3 emissions were approximately one third of the total emissions with the scope 1 emissions making up the lion’s share (scope 2 emissions were 0.2% of total emissions).
Opportunities for reducing emissions and sequestering carbon on farm
There are several options to decrease emissions (mitigation) and sequester carbon on farm. Many of these have the added advantage of boosting productivity and sustainability.
- Energy use including fossil fuels and electricity
- Nitrogen use efficiency including better application of fertilisers and use of legumes in the rotation
- Livestock performance and numbers (and in the future, feed additives)
- Trees and revegetation
- Soils including increasing soil health and retention of organic matter
- Supply chain choices utilising lower emission products
Decreasing the emissions intensity of produce in tonnes of CO2-e per tonne can be achieved by increasing productivity and efficiency. However, it must be remembered that growing more produce more efficiently will not necessarily reduce the farm’s overall emission total.
Reducing emissions through revegetation
Using the on-line tool developed by the CSIRO, Looc-c, the estimated carbon sequestration by planting either oil mallees or mixed eucalypts at Merredin, WA, is 7.17 tCO2-e per ha/year over a 25 year period. Given the total farm emissions for the 100% cropping example in the eastern Wheatbelt was 2184t CO2-e per annum, it would take an estimated 305ha of revegetation to completely off-set the farm’s emissions. The farm has 4900ha of arable land out of a total 5100ha. Assuming little vegetation exists on farm already, approximately 120ha of arable land and 180ha of non-arable land would need to be planted if vegetation was the only activity undertaken to reduce emissions.
Most options to increase efficiency through reduction in inputs, fuel and more efficient use of nitrogenous fertilisers will be incremental contributions to lowering emissions per kilogram, depending on existing practices and the scope for improvement. However, small decreases of several factors add up and will lower carbon product intensity. Using the on-line tools allows producers to run some ‘what if’ scenarios to see the likely impacts these ‘tweaks’ have on emissions. An example of what options and scenarios might be considered can be found in the Carbon Neutral strategy developed for the Katanning Research Facility (www.agric.wa.gov.au/carbon-farming/katanning-research-facility-carbon-footprint-assessment-and-strategy-achieve-carbon ).
Conclusion
It is important to benchmark practices on the farm and carbon emissions are no exception. Once the carbon account has been completed, and this only needs to be an ‘unofficial’ account using freely available on-line tools, scenarios for reducing emissions can be investigated and a course of action taken. This may include identifying and changing practices to become carbon neutral or to have lower emissions intensities to meet market requirements, identifying opportunities for carbon sequestration, either for reserving these to offset emissions from the farm’s produce, or to acquire carbon credits to earn income from those activities.
Acknowledgments
The carbon accounts of broadacre farms were conducted by Ashleigh Lydon, Development Officer, DPIRD Merredin and can be found at www.agric.wa.gov.au/carbon-farming/carbon-calculators-%E2%80%93-western-australian-example-farms
References
Simmons Aaron T., Murray Alexandra, Brock Philippa M., Grant Timothy, Cowie Annette L., Eady Sandra, Sharma Bharat (2019) Life cycle inventories for the Australian grains sector. Crop and Pasture Science 70, 575-584.
Contact details
Mandy Curnow
Department of Primary Industries and Regional Development
444 Albany Hwy, Albany, WA, 6330
Ph: 08 98928422
Email: mandy.curnow@dpird.wa.gov.au