Nitrogen release dynamics of enhanced efficiency fertilisers (EEFs): placement, soil factors and plant uptake
Nitrogen release dynamics of enhanced efficiency fertilisers (EEFs): placement, soil factors and plant uptake
Take home message
Enhanced efficiency nitrogen fertilisers (EEFs) control and delay the release of nitrogen (N) into soil, potentially leading to improved crop uptake and reduced environmental losses. However, in these studies we found that banded application of EEFs did not demonstrate any improvements in maize grain yields relative to conventional urea fertiliser.
The main responses to EEFs were as follows:
- Nitrification inhibitors (NIs) significantly reduced N2O emissions compared to urea and delayed nitrification but did not increase crop N uptake. Residual N in the soil was generally shallower (≤ 0.3m) than from urea and provided no additional N to a subsequent maize crop
- Urease inhibitors (UIs) did not improve N uptake by the initial maize crop and did not have any greater residual benefit than urea. UIs increased the depth of NO3- movement compared to urea, with most residual N located > 0.3m in the profile
- Polymer coated urea (PCUs) delayed N release, then provided a low and continuous supply of N throughout the season. This N was not effectively captured by the maize crop, with either no yield advantages or in some cases poorer yields compared to urea
Despite EEFs performing as designed, no clear productivity or yield advantages were found relative to conventional N fertilisers (i.e., urea) in banded applications. The slower rate of N release and / or availability appears to be poorly synchronised with crop N demand.
Introduction
Improved nitrogen use efficiency (NUE) in Australia’s cropping industries is critical for
- Reducing fertiliser costs to growers
- Improving agronomic efficiency and crop yields and
- Reducing environmental impacts (e.g., nitrous oxide [N2O] emissions, leaching & runoff losses).
Enhanced efficiency fertilizer (EEF) technology (i.e., inhibitors and controlled-release products) are potential tools for improving NUE in cropping environments. However, the effective use of EEFs is hampered by a poor understanding of how these technologies behave in soil and how this translates to agronomic outcomes in the field. Furthermore, most EEF products have been developed and tested in temperate environments where they are broadcast or incorporated with conventional tillage. Thus, a better understanding of the mechanisms at work when different EEF technologies are band-applied under Australian field conditions is required.
This study evaluated several urea-based EEFs, including urease inhibitors (UI - Green Urea NVTM), nitrification inhibitors (NI - ENTEC®) and 90 day controlled-release polymer coated urea (PCU - N90®), benchmarking their performance against granular urea under field conditions on Vertosol soils. The N release dynamics of these products were quantified and their potential to increase crop production and reduce N2O emissions were investigated.
Methods
This paper presents data from a series of field experiments (2018-2020) established at The University of Queensland Gatton campus. These experiments provide an integrated assessment of EEF performance benchmarked against granular urea under irrigated field conditions in southern Queensland, with maize as the test crop.
Maize production
In September 2017, a forage sorghum crop (cv. Pioneer® Super Sweet Sudan) was planted, and sequentially cut and baled twice, to deplete the indigenous soil-N prior to the start of the experiments. The first experiment examined EEFs (UI, NI and PCU) applied to maize at rates of 125 kg N ha-1 (sub-optimal relative to crop N demand) and 250 kg N ha-1 (optimal or supra-optimal). To confirm these rates were sub/supra optimal for the maize crop, six rates of urea (0, 62.5, 125, 175, 250 and 300 kg N ha-1) were tested to develop a reference N response curve, against which EEFs were benchmarked. A second experiment in the same season (adjacent to the first experiment block) compared N2O emissions from NI and PCU against those from urea at an intermediate rate of 150 kg N ha-1. Treatments in both experiments were replicated four times in randomised block designs.
Fertilisers were band-applied at a soil depth of 10cm with a spacing of 75cm, immediately prior to sowing of the maize crop. Maize hybrid PAC 606IT was planted at a rate of 70,000 plants ha-1 at a depth of 6cm, adjacent to fertiliser bands.
N2O emissions
Nitrous oxide emissions were measured over the entire maize crop season using a fully-automated chamber measuring system (see Grace et al. 2020). Chambers were positioned next to plant rows to account for N2O emissions integrated across the fertiliser band and adjacent row. Grain yield at 14% moisture was determined at time of harvest, after which soil samples were collected from fertiliser treatments (250 kg N ha-1) to quantify mineral N remaining in the soil. Soil samples were carefully taken to represent the band, near-band and inter-band locations (see Dang et al. 2021).
Residual N
Soil samples were collected using a 50mm diameter tube pushed by a hydraulic sampling rig and partitioned into 0–0.1, 0.1–0.3, 0.3–0.6 and 0.6–0.9m increments. Samples were dried at 40oC, ground and analysed for concentrations of nitrate (NO3-) and ammonium (NH4+). The total mass of NO3- and NH4+ was calculated by multiplying concentrations with bulk density and the depth of the soil layer.
In 2019, the same maize hybrid PAC 606IT was planted over the treatment plots without application of N fertiliser, to assess the residual value of fertiliser N applied during the previous season. The crop was sown at a rate of 65,000 plants ha-1 at a depth of 6cm into the space between the rows from the previous maize crop. Grain yield at 14% moisture was obtained at time of harvest.
Three-dimensional soil dynamics
Following the maize crop harvest in June 2019, wheat was sown to further draw down the soil N. An experiment was then established in January 2020 to investigate the release and distribution dynamics of N from banded fertilisers (urea, NI and PCU).
Fertiliser products were band-applied at a soil depth of 10cm with a spacing of 75cm on 8 January 2020 at a rate of 150 kg N ha-1. Soil samples were collected 7, 19, 46, 78 and 145 days after the onset of N release (i.e., once fertiliser bands were wet). During sampling, a profile (approx. 0.4m deep, 0.3m wide) perpendicular to the fertiliser band was exposed in each plot in central bands. Once the fertiliser band was located, a 5cm diameter soil coring tube was inserted into the face of the soil profile, such that the fertiliser band was in the centre of the tube. Additional tubes were then inserted directly above (5cm) and below (10cm) the fertiliser band on all sampling times, with two additional samples collected adjacent to the band for the first three samplings (see Martinez et al. 2021). After field sampling, soils were stored at 4oC until processing was completed within 48 hours of collection. Samples were manually mixed to ensure homogeneity and analysed for NO3-, NH4+, and soil pH. Samples collected on the fertiliser band were also analysed for urea-N.
Results
Maize production
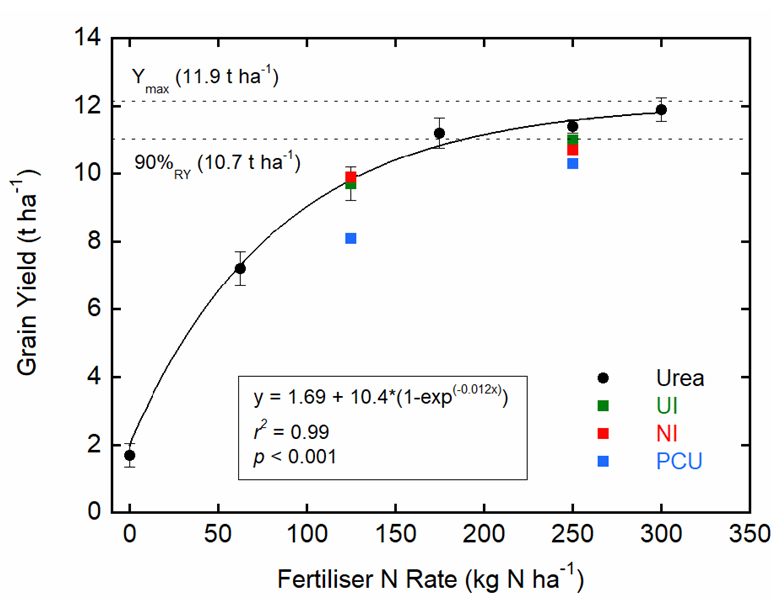
Prior to the 2018 maize crop, NO3- (< 1 mg kg-1) and NH4+ (2-4 mg kg-1) concentrations were low at all soil depths. Maize yield and grain N content was therefore highly responsive to N fertilisation (Table 1). Grain yield increased significantly with increasing rates of applied urea up to 175 kg N ha-1, after which only very small increases were observed. A Mitscherlich equation provided the best model fit for the relationship between N rate and yield, with maximum potential yield of 11.9 t ha-1 and 90% relative yield of 10.7 t ha-1 at 175 kg N ha-1 (Fig. 1).
Grain yields from EEF treatments did not improve compared to urea (Figure 1 and Table 1). While an average yield increase of 19% was recorded as N rates increased from 125 to 250 kg N ha-1, increases were not statistically significant for the NI treatment. Furthermore, the PCU produced significantly lower yields at both the low (8.1 t ha-1) and high (10.3 t ha-1) application rates compared to urea (9.7 and 11.4 t ha-1, respectively; Figure 1).
Table 1. Grain yield for maize grown in 2018 and 2019 at increasing rates of urea (0, 62.5, 125, 175, 250 and 300 kg N ha-1) and EEFs (UI, NI, PCU) applied at 125 and 250 kg N ha-1.
Urea rate kg ha-1 | 2018 (year of fertiliser N application) | 2019 (residual fertiliser N) | ||||
|---|---|---|---|---|---|---|
N response curve (urea N, kg N ha-1) | ||||||
0 | 1.7a | 3.7a | ||||
62.5 | 7.2b | 4.0a | ||||
125 | 9.7c | 4.4a | ||||
175 | 11.2d | 5.1b | ||||
250 | 11.4d | 6.4c | ||||
300 | 11.9d | 8.2d | ||||
Relative performance of EEFs | ||||||
N type | 125 kg N ha-1 | 250 kg N ha-1 | 125 kg N ha-1 | 250 kg N ha-1 | ||
Urea | 9.7 | 11.4 | 4.4 | 6.4 | ||
UI | 9.7 | 11.0 | 4.0 | 6.6 | ||
NI | 9.9 | 10.7 | 3.7 | 6.7 | ||
PCU | 8.1 | 10.3 | 3.2 | 5.9 | ||
l.s.d (p<0.05) | 2018 | 2019 | ||||
N products | 0.9 | 0.6 | ||||
N rate | 0.4 | 0.3 | ||||
Interaction | 1.3 | 0.8 | ||||
Values within a column followed by the same letter are not significantly different at p=0.05. UI = urease inhibitor; NI = nitrification inhibitor; PCU = polymer coated urea
N2O emissions
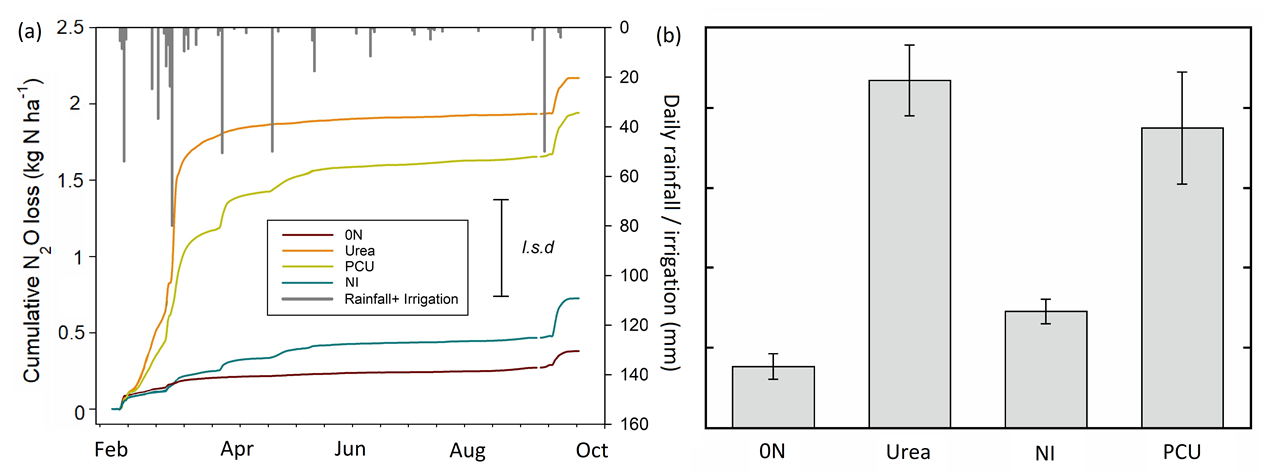
The majority of N2O emissions occurred in the first two months after sowing / fertiliser application, when soil mineral N was highest. The highest daily N2O fluxes from all treatments occurred after an 80mm rainfall event in February, with a smaller peak also occurring in response to a 50mm irrigation event that was applied to the emission trial area during the postharvest fallow period (Figure 2a). The EEFs produced significantly lower cumulative N2O fluxes than urea, but differences between urea and PCU were not significant (Figure 2b). The PCU product continued to produce spikes in emissions in response to rainfall events later in the growing season (Figure 2a). Conversely, the NI produced significantly lower cumulative N2O fluxes than urea and the PCU (Figure 2b). The calculated N2O emissions factors ranged between a high of 1.2% of applied urea-N to a low of 0.2% for the NI. The PCU had an emission factor of 1.0%, indicative of little improvement compared to the urea.
Residual N
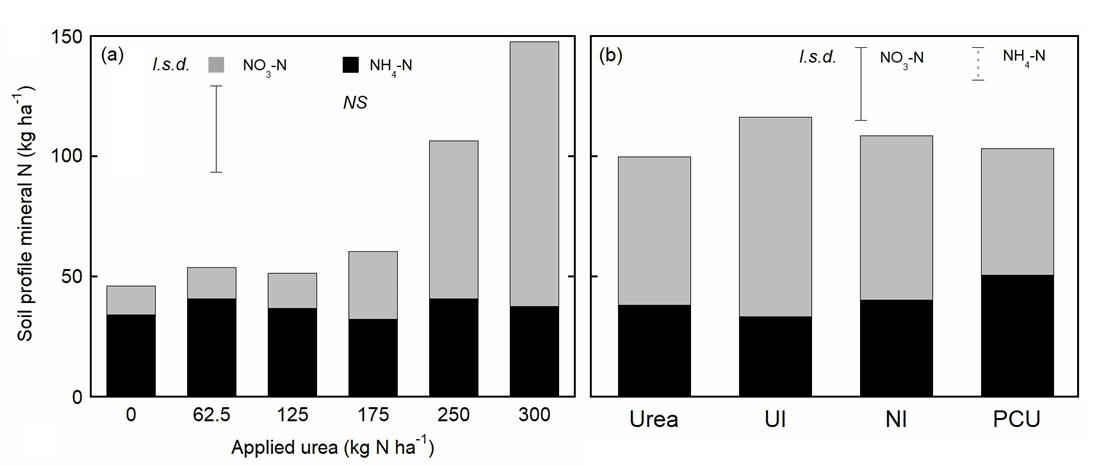
Soil samples collected after the 2018 maize harvest revealed increasing amounts of residual NO3- in the soil as fertiliser N rates increased above 125 kg N ha-1 (Figure 3). Interestingly, while increasing rates of applied urea significantly (p < 0.001) increased the residual mass of NO3- in the soil, the mass of NH4+ remained largely unchanged (Figure 3a). The mass of residual NO3- in soil was statistically similar for all EEFs except the UI, which had more NO3- than urea at an application rate of 250 kg N ha-1 (Figure 3b). At 250 kg N ha-1, NH4+ concentrations were greater for the PCU treatment compared to urea.
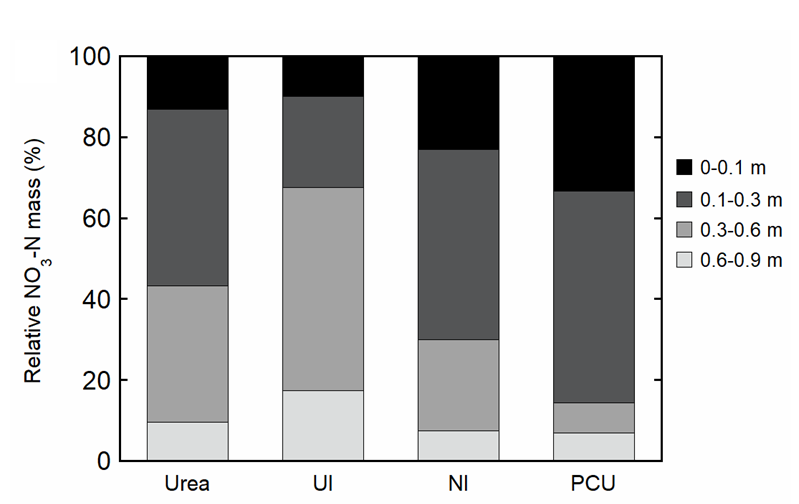
Despite wet seasonal conditions (419mm of rainfall and irrigation), NO3- was largely confined to the band and near-band (0.05–0.10m) positions, with relatively small amounts found in the mid-row positions (i.e., 0.35–0.40m from the nearest band), with similar patterns observed for urea and EEFs (data not shown). There were noteworthy differences in the depth distribution of NO3- for the different N fertilisers (Figure 4), with the mass of NO3- in the 0–0.3m for PCU (85%) > NI (70%) > urea (55%) > UI (30%). Relative NO3- mass in the 0–0.1m soil depth followed similar patterns, with PCU (33%) > NI (23%) > urea (15%) > UI (10%). Movement of NO3- below 0.3m was highest for the UI (70%), with relatively lower NO3- mass observed for urea (45%), NI (30%) and PCU (15%).
In the subsequent maize crop grown in 2019, there was no grain yield response to residual N in plots treated with rates up to 125 kg N ha-1 (applied in 2018; Table 1), which was consistent with the lack of residual N seen in the soil profiles (Fig. 3). However, significant improvements in grain yield were observed as the initial N application rate (2018) increased to 175 kg N ha-1 and above. Consistent with this, grain yield and N content responses from EEF products was greater at an initial N application rate of 250 kg N ha-1 compared to the lower rate of application (125 kg N ha-1). Nevertheless, none of the EEF products resulted in significantly higher grain yields or N contents relative to urea at either low (125 kg N ha-1) or high (250 kg N ha-1) rates of application. Notably, the PCU yielded 28.1% lower than urea when both were applied at a rate of 125 kg N ha-1.
Three-dimensional soil N dynamics around N bands
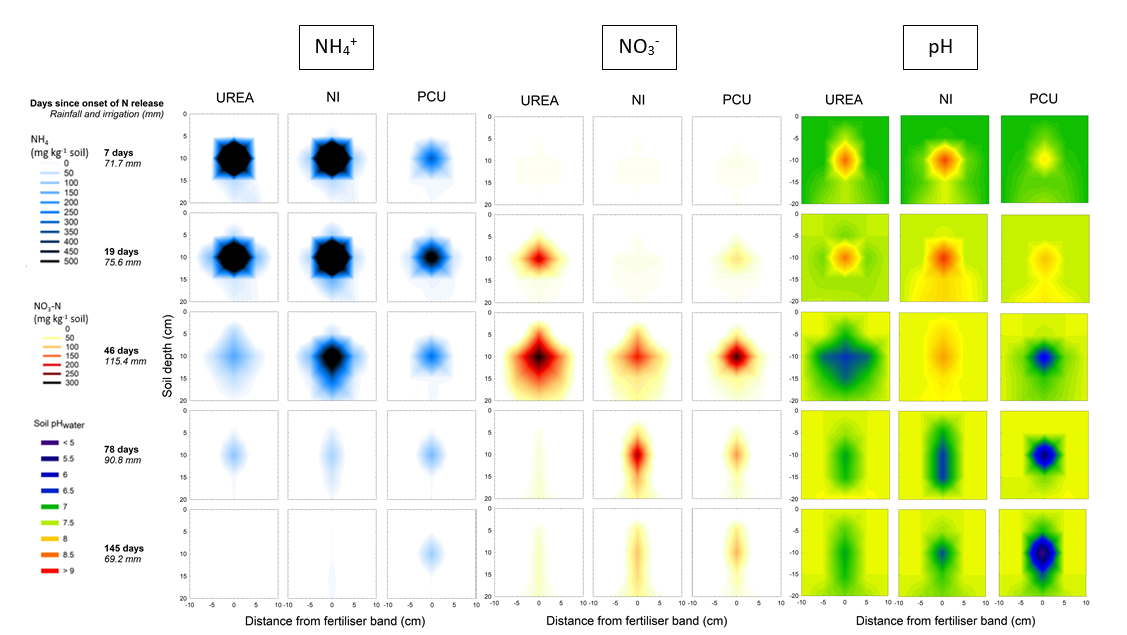
Irrespective of fertiliser type, NH4+ was the predominant soil mineral N species at 7 days after onset of N release, after which the proportion of mineral N found as NO3- increased for both the urea and PCU treatments (Figure 5). Over the first 46 days, the concentration of NH4+ in the PCU treatment was relatively low (compared to urea and NI) and was distributed over a much smaller zone around the fertiliser band. In the NI treatment, a greater proportion of mineral N in the soil remained as NH4+ for the first 46 days, after which NO3- became the predominant N form, peaking at 78 days. Nitrate concentrations peaked at 46 days in the urea and PCU treatments and declined considerably after this time (Figure 5).
In-band soil pH was significantly higher in all fertiliser treatments relative to the unfertilised control at 7 days, although that of the PCU was significantly lower than the urea and NI treatments (Figure 5). Soil pH continued to increase for PCU until 19 days, while only minor changes were evident for granular urea and the NI between 7 and 19 days. Subsequently, the pH of soil for the urea treatment declined up to 46 days, after which no further change was recorded. For the NI treatment, the pH remained higher than the urea and PCU treatments at 46 days, with this difference being significant compared to urea. A minimum pH of 6.5 was reached at 78 days for this N-fertiliser treatment. In comparison, the pH of soil treated with PCU demonstrated a continuing decline from 19 days until at least 145 days. The acidification of soil resulting from nitrification in and around N-fertiliser bands was substantially greater in the PCU treatment compared to urea, with the PCU treatment recording a significantly lower in-band pH (5.0) by 145 days relative to granular urea (pH 6.9; Figure 5).
Discussion
Nitrification inhibitors reduce N2O emissions but do not improve crop N acquisition
The preservation of N as NH4+ for an extended period (Figure 5) provided the driver for the NI to significantly reduce N2O emissions (Figure 2) relative to those from urea fertiliser. However, the net N ’saved’ by reduced N2O emissions was low (ca. 1.5 kg N ha-1; Figure 2b) and not surprisingly did not translate to improvements in maize grain yield (compared to urea; Figure 1) or greater end-of-season soil mineral N concentrations (Figure 3b).
Controlled release of N is poorly matched to maize demand and does not reduce N2O emissions
Release of N from PCU granules was slow and controlled, and the relatively benign chemical conditions around the fertiliser band (compared to urea; see Janke et al. 2020, Martinez et al. 2021, Figure 5) meant N was rapidly converted to NO3-. The limited N available during early growth stages was likely well below crop demand and contributed to the poorer productivity of maize (compared to urea; Table 1). A large proportion of N from PCUs remained in smaller zones of N distribution (Fig. 5) that were closer to the soil surface (Figure 4) and so inaccessible for uptake in dry(er) topsoil layers later in the growing season. This likely contributed to yield penalties, as crop roots followed water down the soil profile, leaving N released from the PCU more susceptible to N2O emissions.
Urease inhibitors may be useful for deeper incorporation of N into soil profile
Urease inhibitors target NH3 volatilisation, however, this loss pathway is effectively minimised by sub-surface fertiliser application. The most significant impact on N dynamics from this EEF is the maintenance of N in the form of urea-N, which increases the rate of N movement down the soil profile as rainfall or irrigation water drain through the fertiliser band (Janke et al. 2020). Deeper distribution of N following fertilization with a UI (compared to urea) has been observed both in-season (Janke et al. 2020) and as residual N in this study (Figures 3, 4). However, UI treatments did not deliver any improvement in maize yield (Figure 1), suggesting that this N at depth at the end of the initial growing season was either no longer available the following year, or was not available at a time that matched crop N demand. The reasons for this lack of residual benefit could not be determined.
Banded urea may behave like a ‘slow-release’ fertiliser
Whilst EEFs performed true to their stated mode-of-action (e.g., controlled release from PCU, nitrification inhibition by NIs, etc.), the timing and distribution of available N appeared to limit the efficacy of these products for improved crop productivity. It is well established that restricted N availability before the V8 stage (around30 days after emergence) will significantly reduce yield. Accordingly, if release is too slow (i.e., PCU) or N is preserved in a largely unavailable form or in very constrained soil volumes (i.e., NIs), then early N supply may be insufficient and consequently limit final grain yield. In extreme cases, this mismatch may be so great that EEFs may perform worse relative to conventional N fertilisers (i.e., PCU). Compared to EEFs, the volume of soil enriched with N in banded urea treatments is greater, potentially enabling better coincidence with a larger proportion of growing crop roots. Furthermore, a greater proportion of N is available earlier from urea bands, better coinciding with maize demand. These dynamics may explain why no yield penalties were observed for maize treated with conventional urea (compared to EEFs) even though urea did result in much greater N2O emissions. Urea bands may therefore act as a short term ‘slow-release’ N source in terms of N availability in clay soils such as the Vertosols.
Conclusions
Despite differences in N release dynamics and some reduction of N losses, we saw no clear agronomic advantages for EEF use relative to conventional N fertilisers when band applied. This was largely due to asynchrony of N availability with crop demand and / or poor co-location of N with crop root activity. From an agronomic perspective, conventional urea delivers grain yields which are similar or better than that of EEFs, and at lower cost for each kg of N applied. The NIs were effective at greatly reducing N2O emissions without any adverse impacts on crop productivity. Polymer-coated urea and UIs did not demonstrate either agronomic or environmental benefits in this study. It’s possible that under different environmental conditions or soil types, the efficacy of these technologies compared to urea may improve. Furthermore, crops with differing patterns of N demand may demonstrate different responses to EFF application.
Acknowledgements
This research was jointly funded by the Science with Impact Fund (The University of Queensland, Australia), Kingenta Australia Ag Pty Ltd., and the Australian Government’s National Environmental Science Program (NESP).
References
Dang YP, Martinez C, Smith D, Rowlings D, Grace P and Bell M (2021) Maize production and nitrous oxide emissions from enhanced efficiency nitrogen fertilizers. Nutrient Cycling in Agroecosystems, 121: 191-208.
Grace PR, van der Weerden TJ, Rowlings DW, Scheer C, Brunk C, Kiese R, Butterbach-Bahl K, Rees RM, Robertson GP, Skiba UM (2020) Global Research Alliance N2O chamber methodology guidelines: considerations for automated flux measurement. Journal of Environmental Quality, 49: 1126-1140.
Janke CK, Moody P and Bell MJ (2020) Three dimensional dynamics of nitrogen from banded enhanced efficiency fertilizers. Nutrient Cycling in Agroecosystems, 118: 272-247.
Martinez C, Clarke D, Dang YP, Janke C and Bell MJ (2021) Integrated field assessment of nitrogen release dynamics and crop recovery of band-applied controlled-release fertilisers. Plant & Soil, 466: 257-273.
Contact details
Cristina Martinez & Chelsea Janke
School of Agriculture and Food Sciences,
The University of Queensland, St Lucia, QLD 4072
Email: cristina.martinez@uq.edu.au and c.stroppiana@uq.edu.au
® Registered trademark
TM Trademark
