Optimising fertiliser application – what level of precision can we achieve?
Optimising fertiliser application – what level of precision can we achieve?
Author: Craig Scanlan, Raj Malik, James Easton, Mark Gherardi, Zed Rengel, Richard Bell, Gustavo Boitt and Qifu Ma. | Date: 22 Feb 2022
Key messages
- Economically optimum fertiliser rate is more sensitive to the magnitude of grain yield response than to recent variations in grain and fertiliser prices.
- Economic analysis of rate response trials showed that a wide range of rates fall within the 90% confidence interval of the optimum rate.
- These case studies suggest a low level of precision is sufficient to maximise net return for N, P and K fertiliser.
Aims
To assess the influence of recent changes in fertiliser and grain prices on economically optimum N, P and K fertiliser rates.
To quantify the range of rates that fall within the 90% confidence interval of the economically optimum rate.
Introduction
Optimising the application of nitrogen (N), phosphorus (P) and potassium (K) fertiliser is an ongoing challenge because grain producers are attempting to address multiple objectives. Grain producers are trying to strike a balance between maximising their gross margins at a paddock or enterprise level, maximising the chance of capitalising on good years by removing nutritional constraints to yield and minimising the overall financial risk to their business in poor years. Fertiliser recommendation systems are widely used in Western Australia to assess the optimal fertiliser strategy based on assumptions about yield response to fertiliser, potential yield and fertiliser price.
The approach used for making fertiliser recommendations by most commercial providers in WA is known as the sufficiency approach, where fertiliser rates are adjusted to achieve a yield or profit target. The sufficiency approach has its origins in soil test calibration curves for nutrient response (Olsonet al 1982), where little or no yield response to a nutrient is expected above a certain soil test level. This is typically expressed as the critical range (or level) for 90% of maximum yield i.e., 10% or less yield response to a nutrient is expected above its critical range. Soil test calibration curves are combined with predicted yield response to fertiliser in analytical models to predict the yield and profit response from applied nutrients. Presented as a dose response, this type of modelling allows the user to identify an optimal rate based on the highest point on the rate-net return response curve.
Research that has investigated the statistical confidence around rate-net return response curves challenges the goal of defining optimum rates. For example, the range of the 68% confidence interval bands for economically optimum nitrogen rate in maize was 21kg N/ha (Jaynes 2011). A similar study showed the range of the 90% confidence interval of the economically-optimum nitrogen rate was 77kg N/ha (Nigonet al 2019). Given the statistical uncertainty of economically optimum rates, and the flatness of rate-net return response curves, it may be more meaningful to discuss optimality in terms of ranges rather than rates (Pannell 2017).
In a farming system, the goal of identifying an optimal fertiliser rate is further complicated by the interactions between different nutrients applied as fertiliser, soil properties, crop sequence, crop type and season. The impact of preceding crop on yield response to fertiliser N is widely understood, and grain producers in WA modify N rate based on the number of years since lupins were planted (Harrieset al 2021). There is also evidence of interactions between nutrients e.g., N and sulphur (Brennan and Bolland 2008), K fertiliser and leaf disease (Brennan and Jayasena 2007), sowing date and P response (Mason and McDonald 2021; Gherardiet al 2022), and soil compaction and N fertiliser (DPIRD, unpublished data) influencing grain yield. It is likely that the optimal rate of a nutrient applied as fertiliser is influenced by the factors above as well as the level of soil supply of that nutrient.
In this paper, we examine one component only of optimising fertiliser rate; the precision in rate required to maximise profit from N, P and K fertiliser. This paper was motivated by recent increases in fertiliser prices, and we address this using different price scenarios.
Method
Field trials
This paper draws upon field research being completed or compiled in a current GRDC project (UWA1801-002RTX). The N field trial data presented here are N rate-response experiments for wheat at Lake Grace (2017), Wongan Hills (2016) and Gibson (2016). The P trial data are from five representative sites from a series of P rate-response trials being done across WA to examine how soil and climate factors interact for wheat yield response to fertiliser P. The K data are drawn from two recent trials by CSBP — a K-rate design for wheat at Gnowangerup in 2018, and a K-rate x source x placement trial in canola at Brookton in 2020.
Economic analysis
Two approaches were used for the economic analysis. For trial designs with a rate-response design, the economically optimum rate and the 90% confidence interval for this (CI) were calculated by fitting a quadratic model to rate-net return (income from grain minus fertiliser costs) data (Nigonet al 2019). For trials with a factorial design, economic analysis was done by calculating net return for each plot and testing for treatment effects using analysis of variance (ANOVA) in Genstat (VSN International 2021).
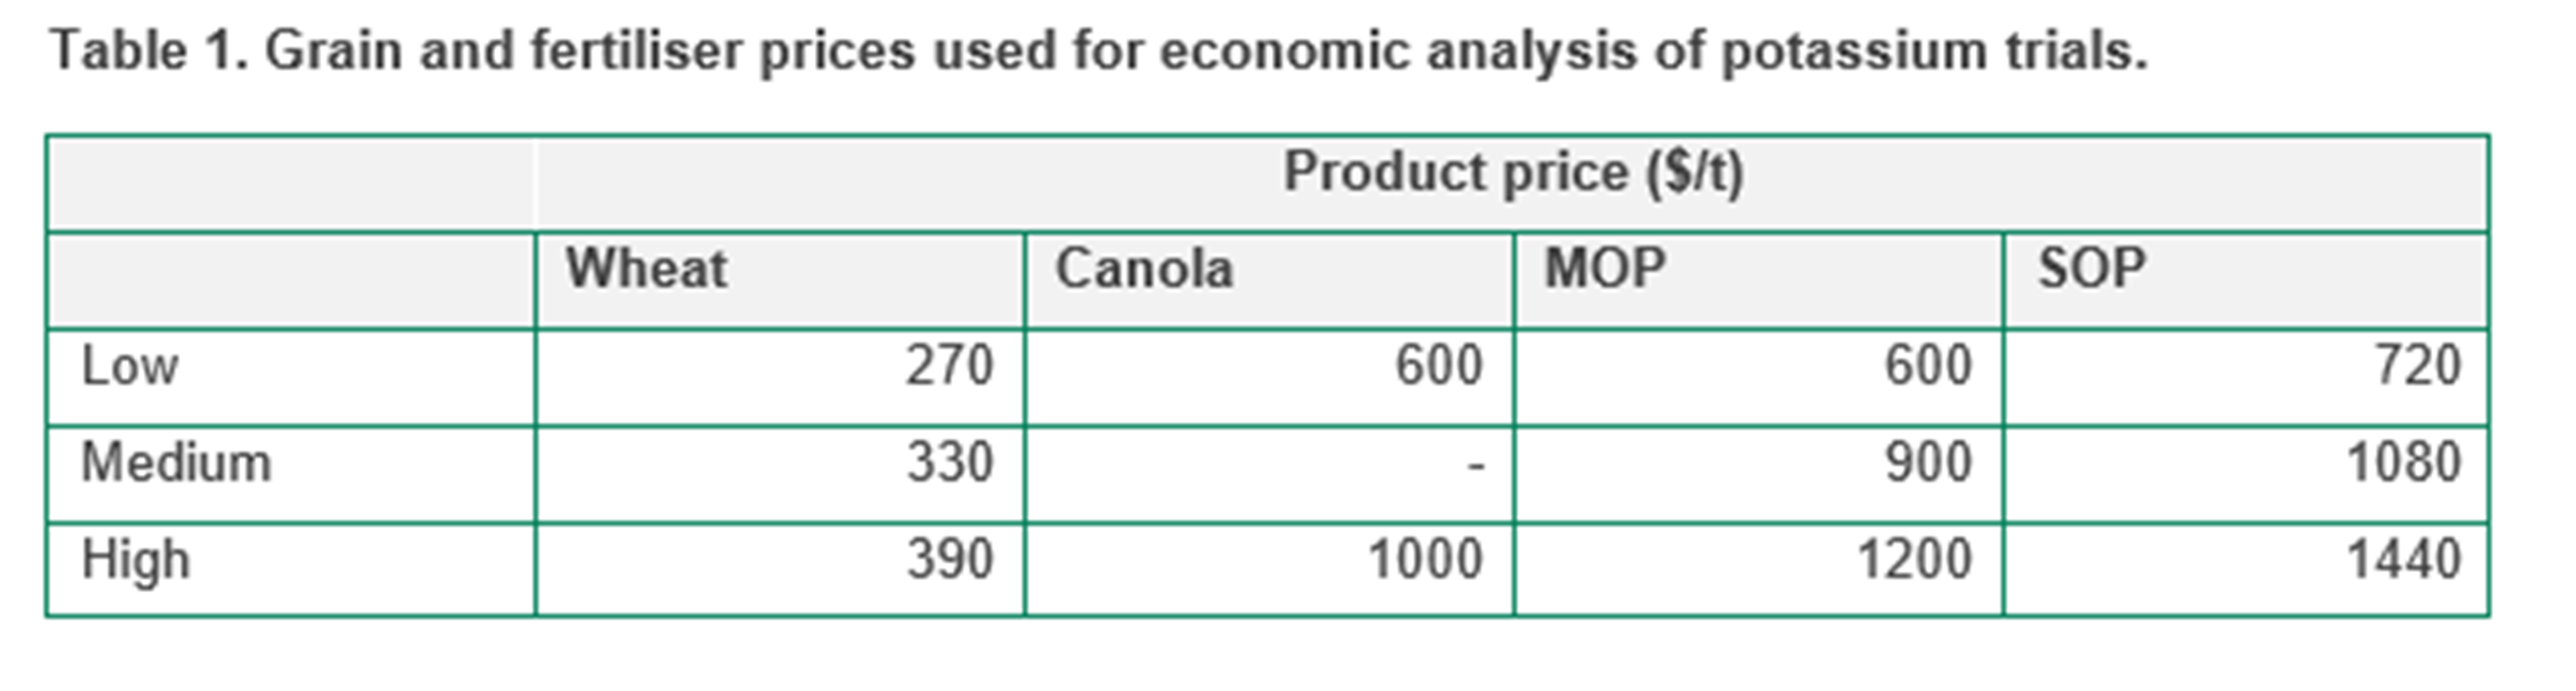
Economic analysis for N was implemented for a factorial of wheat and urea prices. The wheat prices used are those in Table 1. Urea prices of $500/t, $1000/t and $1500/t were used, and a freight cost of $21/t was included for fertiliser. The economic analysis for P was done using the wheat prices in Table 1, and MAP prices of $700/t (close to 5-year av. 2015-2019), $1150/t (1.5 x 5-year av.) $1400/t (2 x 5-year av.). The economic analysis for K was done using a factorial of low (close to 5-year av.), medium and high (close to current peaks) prices (Table 1).
Results
Nitrogen
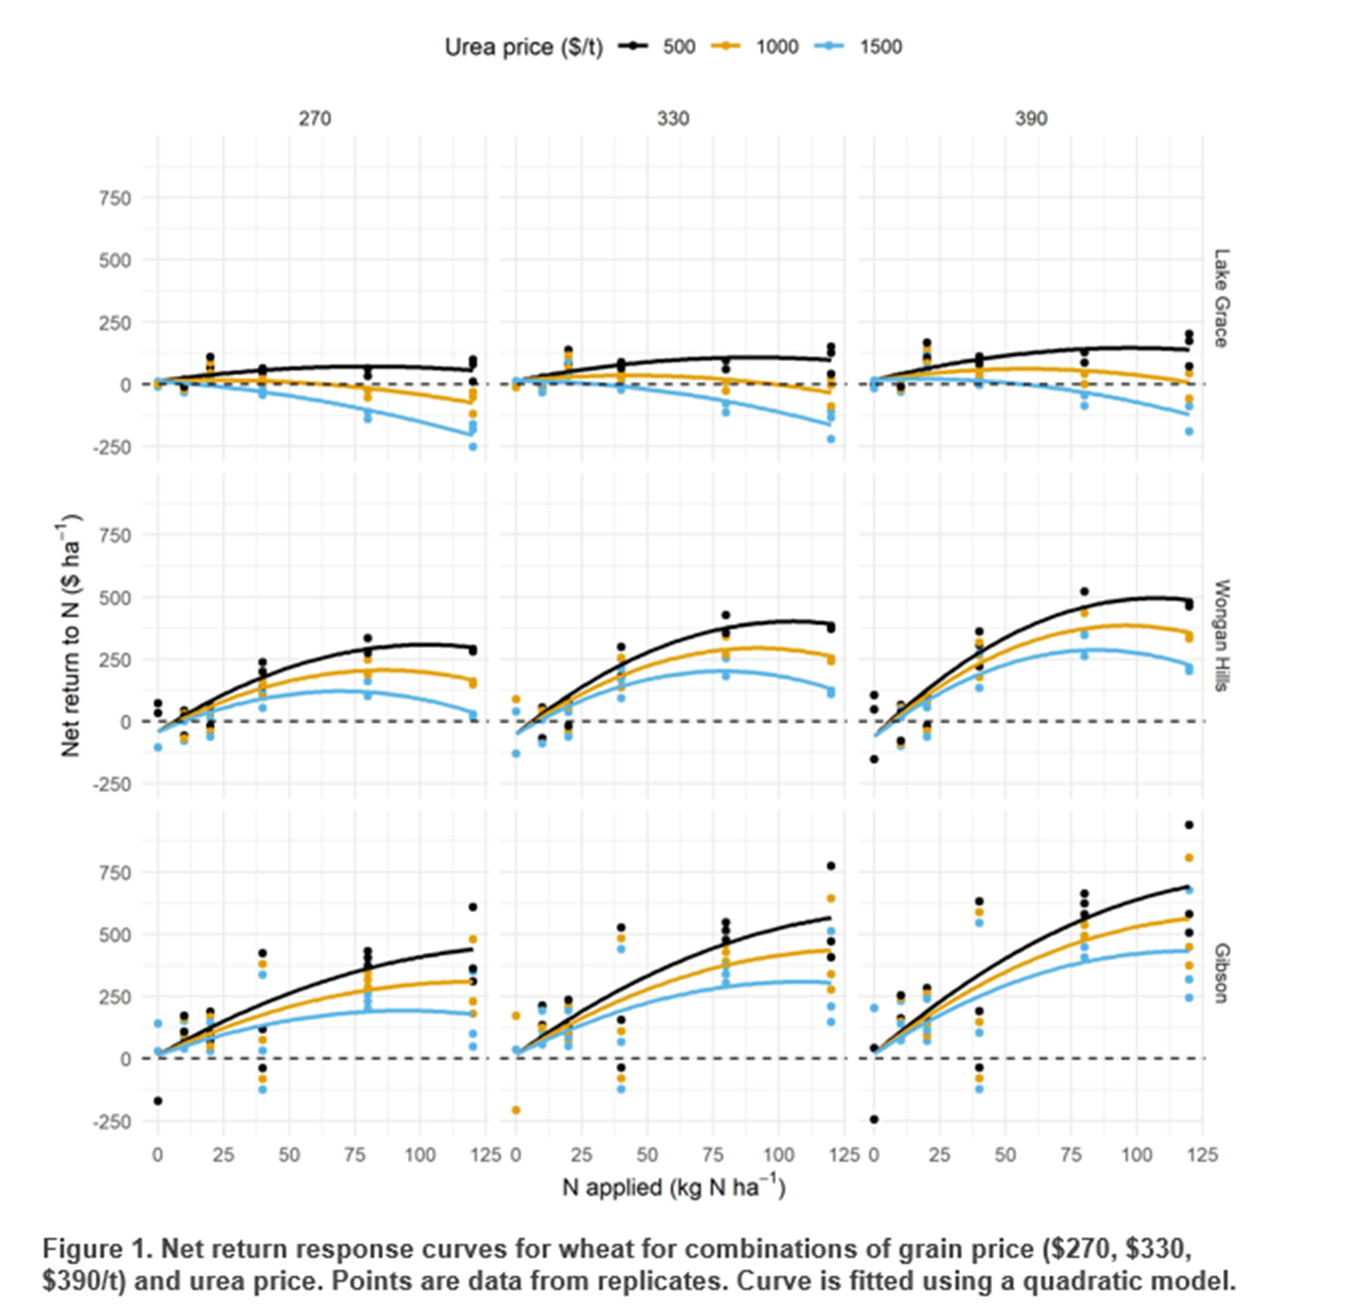
A significant wheat yield response to N was observed at the three sites used. The yield response (grain yield at 120kg N/ha – nil N) was 0.72, 1.55 and 2.06 t/ha at Lake Grace, Wongan Hills and Gibson, respectively.
The impact of price scenarios on the rate-net return response differed among the three sites (Figure 1). At Lake Grace (0.72t/ha response to N), a profitable response to N occurred for urea at $500/t for all grain price scenarios, and for urea at $1000/t when grain price was $390/t. Net return (compared to nil N) decreased with urea application at $1500/t for all grain price scenarios. At Wongan Hills and Gibson, net return increased with N-application in all price scenarios.
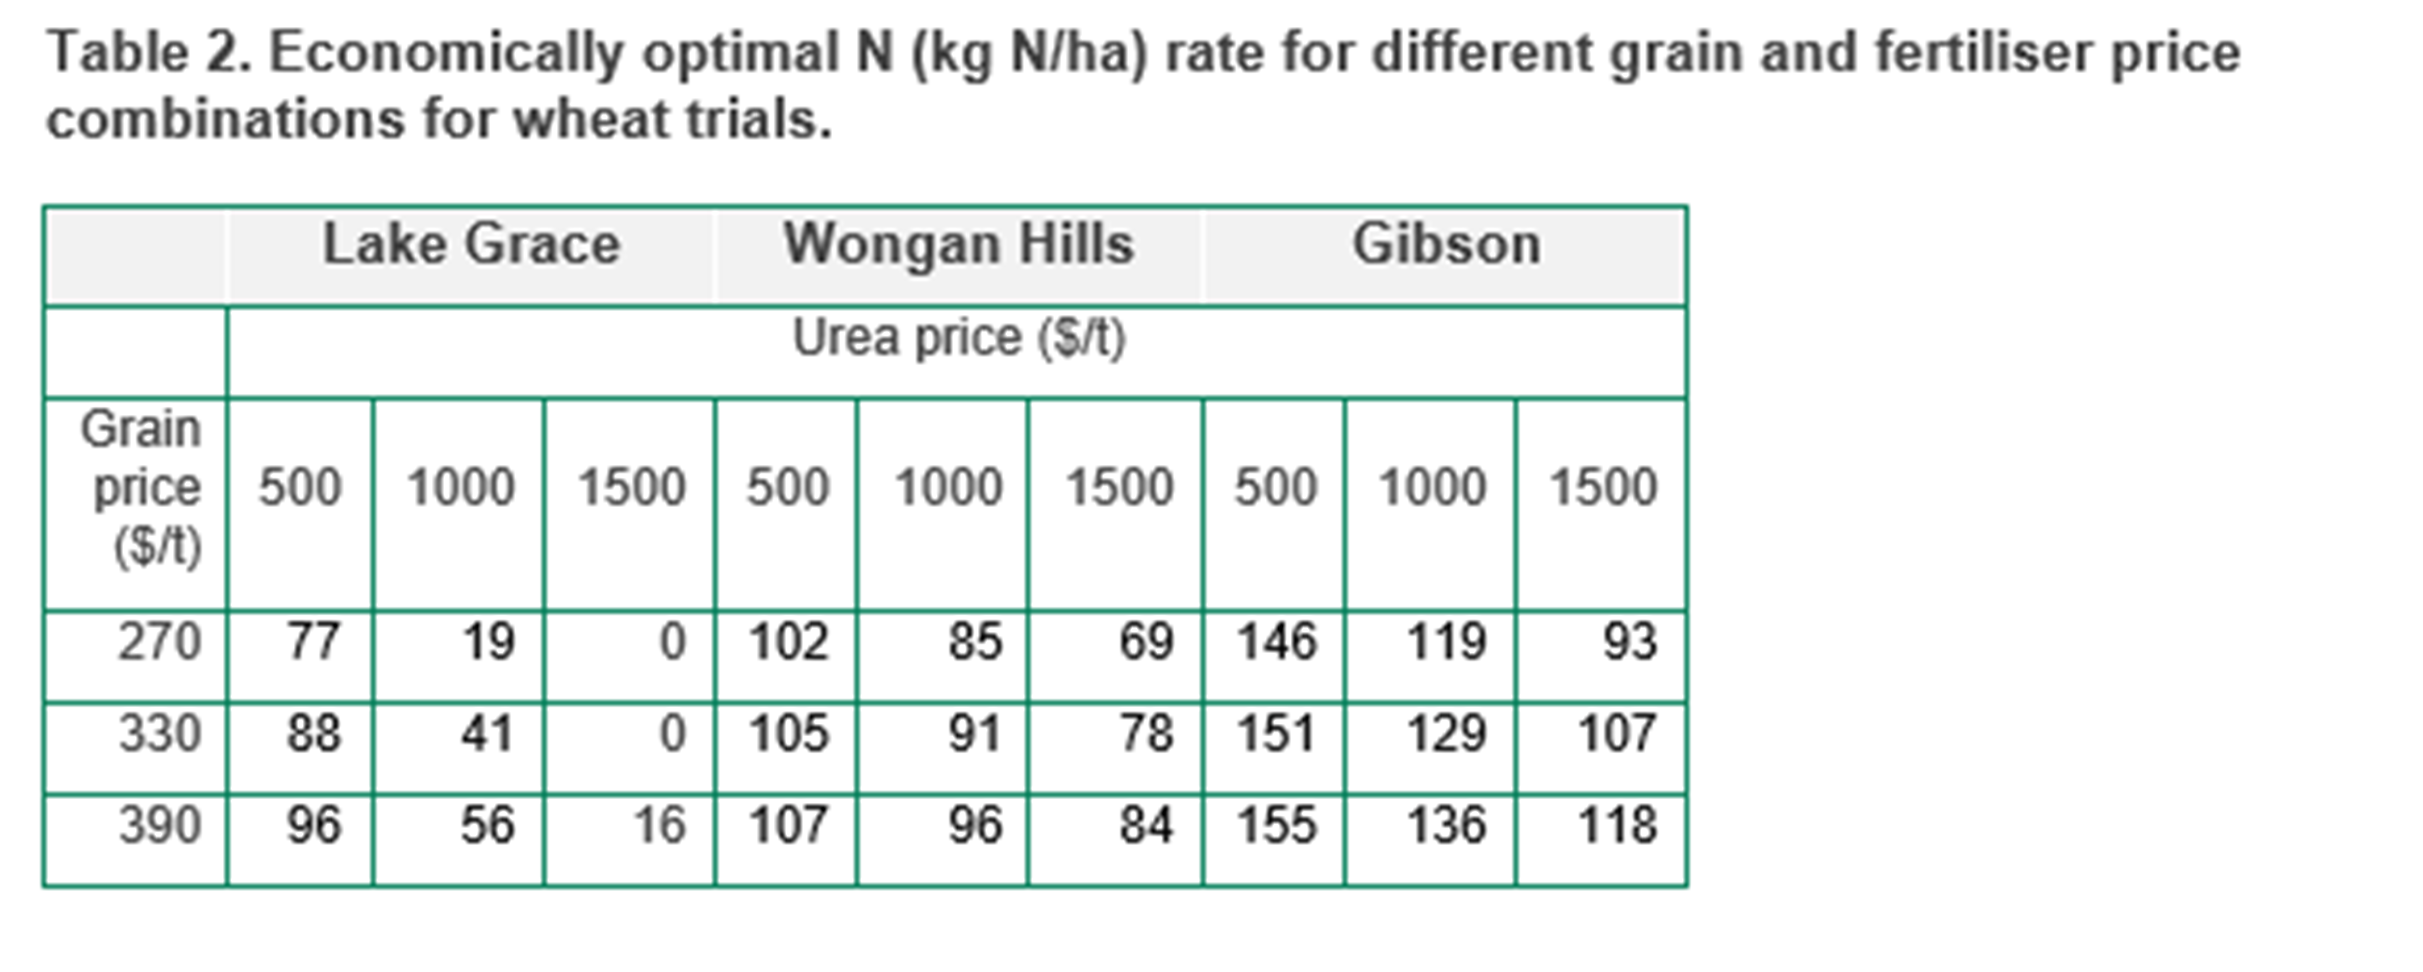
The influence of grain and fertiliser price was greatest at Lake Grace site where the yield response to N was the lowest. For example, an increase in urea price from $500/t to $1500/t decreased the optimal rate by about 80 to 90kg N/ha at Lake Grace, 40 to 50kg N/ha at Wongan Hills and 20 to 30kg N/ha at Gibson.
The confidence interval for the economically optimal N rate was wide in relation to the optimal rate (data not shown here). At Wongan Hills, the width of the confidence interval was about half the optimal rate and was close to 40kg N/ha overall. At Lake Grace, the width of the confidence was of similar magnitude as the optimal rate for most price combinations at about 60kg N/ha. The width of the confidence interval was greatest for the Gibson site which is partly attributed to the poorer fit of the quadratic model to economic data at that site. Our analysis for these examples suggests that a high level of precision in N fertiliser rate is not required to maximise profit; a rate ± 20kg N /ha of the optimum would be within the 90% confidence interval at all three sites tested.
Phosphorus
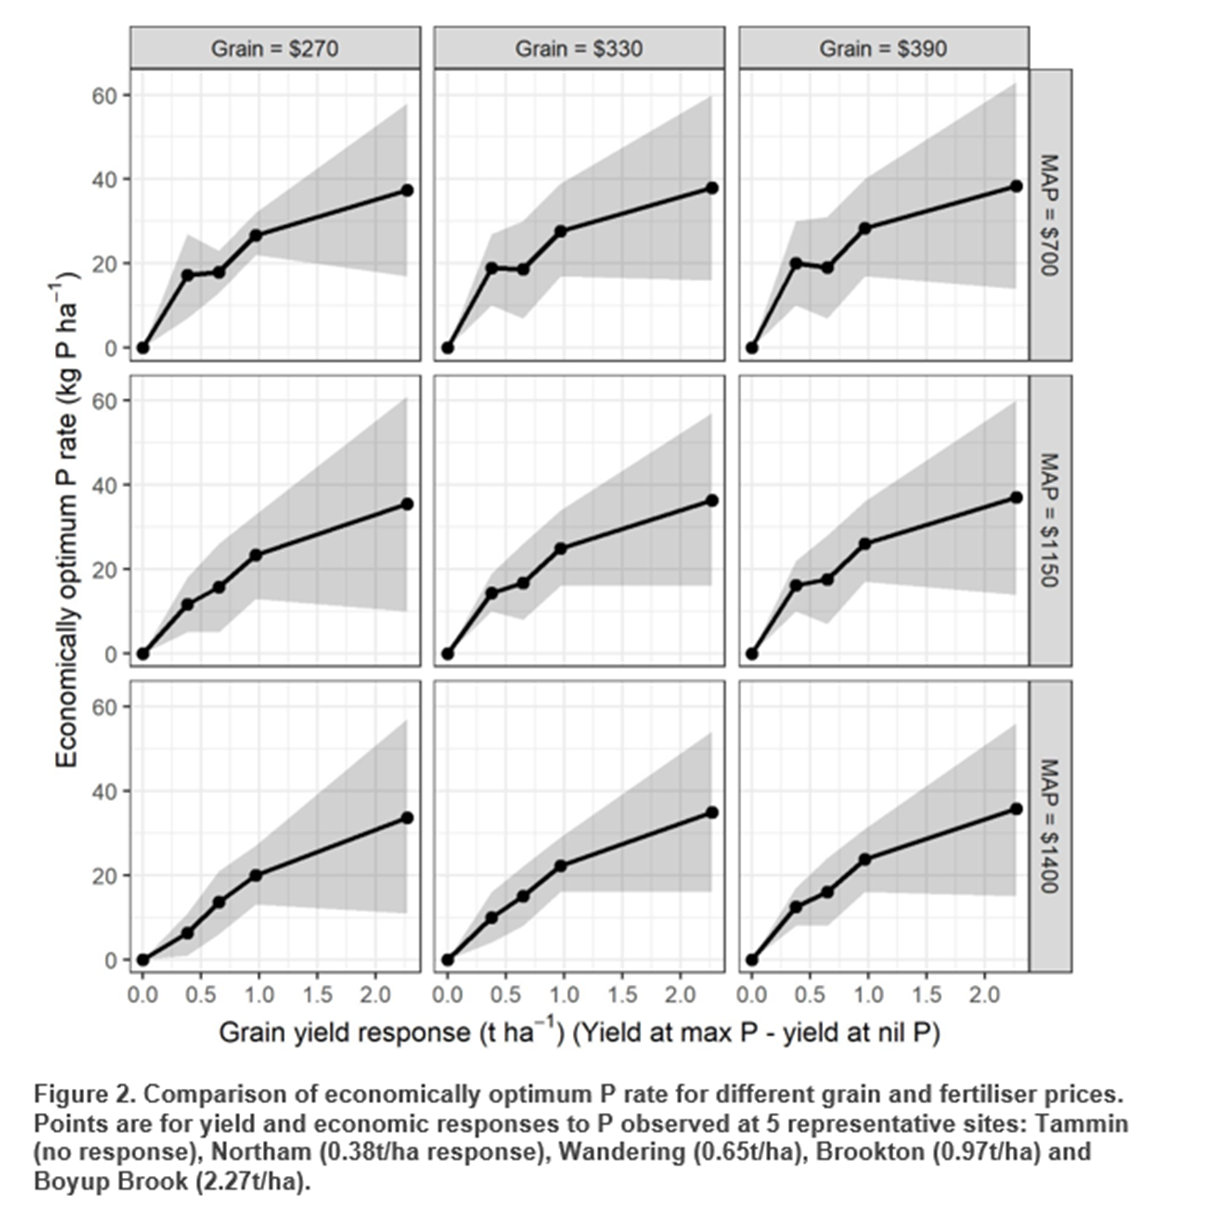
The level of yield response to P fertiliser had a greater influence on the economically optimum rate than the price of mono-ammonium phosphate (MAP) or the price of grain (Figure 2). The economically optimum rate increased from 0 to about 36kg P/ha as the yield response to P increased from 0 to 2.27t/ha. By comparison, the greatest change in economically optimum rate due to a change in the price of MAP occurred at Northam; a decrease of 11kg P/ha when MAP price increased from $700/t to $1400/t, and grain price was $270/t. The greatest change in economically optimum rate due to a change in grain price was also at the Northam site; an increase of 5kg P/ha where grain price increased from $270 to $330/t, when MAP price was $1400/t.
Our analysis of economically optimum P rate show that there is a wide range of rates that fall within the 90% confidence interval. The width of the confidence interval (depending on MAP price) was 38 to 51kg P/ha at Boyup Brook, 10 to 23kg P/ha at Brookton, 11 to 24kg P/ha at Wandering and 9 to 20kg P/ha at Northam. The width of the confidence interval was of a similar magnitude to the economically optimum rate; for example, the economically optimum P rate at Northam (MAP=$700/t, wheat=$270/t) was 17kg P/ha, and the confidence interval was 20kg P/ha (confidence interval of 7 to 27). These case studies suggest that a low level of precision is required in P rate to maximise net return. For example, at the Northam site, the P rate could be ± 5kg P/ha of the optimum and still be within the confidence interval for the optimal rate for all price scenarios. At the sites with higher levels of response to P, the P rate could be ± 10 to 15kg P/ha and still fall within the confidence interval.
A comparison of the shaded areas showing economically optimum P range for each combination of site and P fertiliser price shows that some P rates fall within the optimum range for all price scenarios (Figure 2).
Potassium
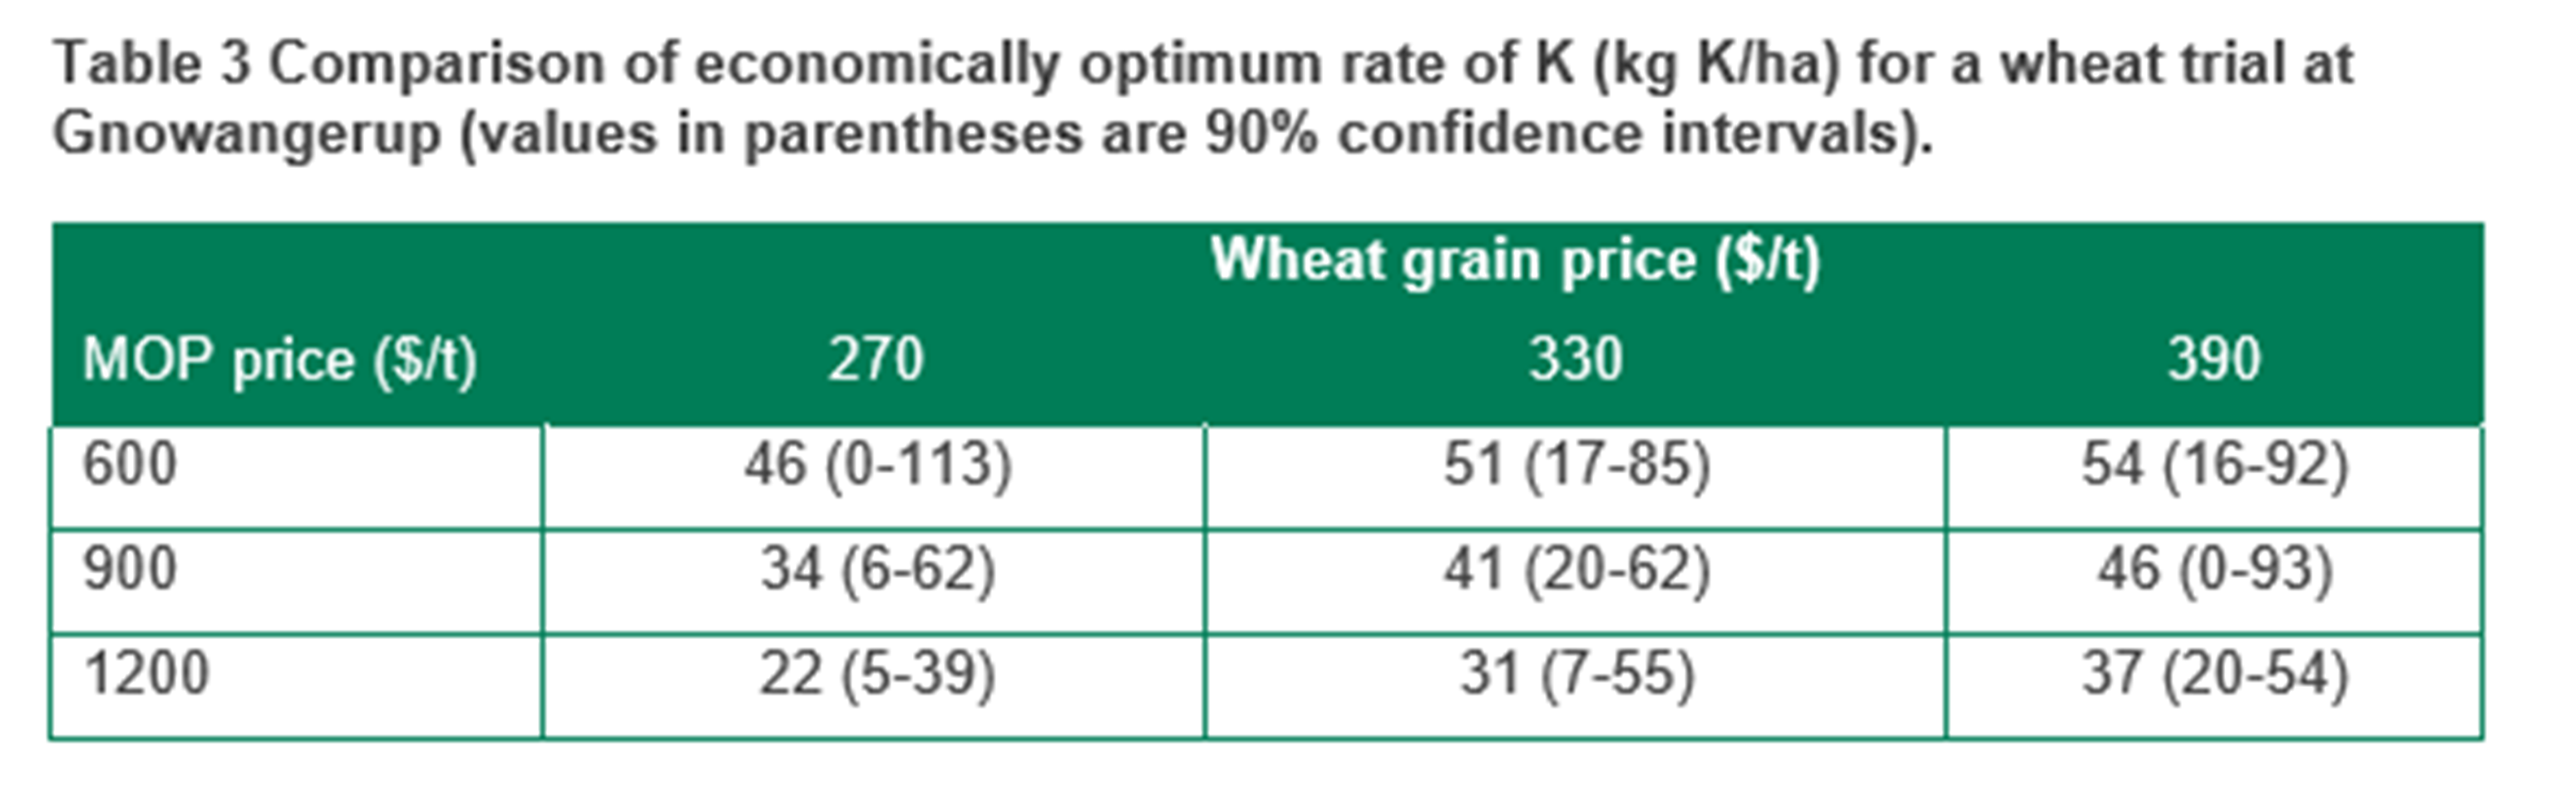
Economic analysis of a K response trial for wheat showed similar outcome to the analysis for N and P. The economically optimum rate increased as the grain price increased (Table 3) and width of the confidence interval was a similar magnitude to the optimum rate in most cases. The smallest range in the confidence interval for optimal rate was 34kg K/ha meaning that a rate ± 15kg K ha would be within the confidence interval for any price scenario.
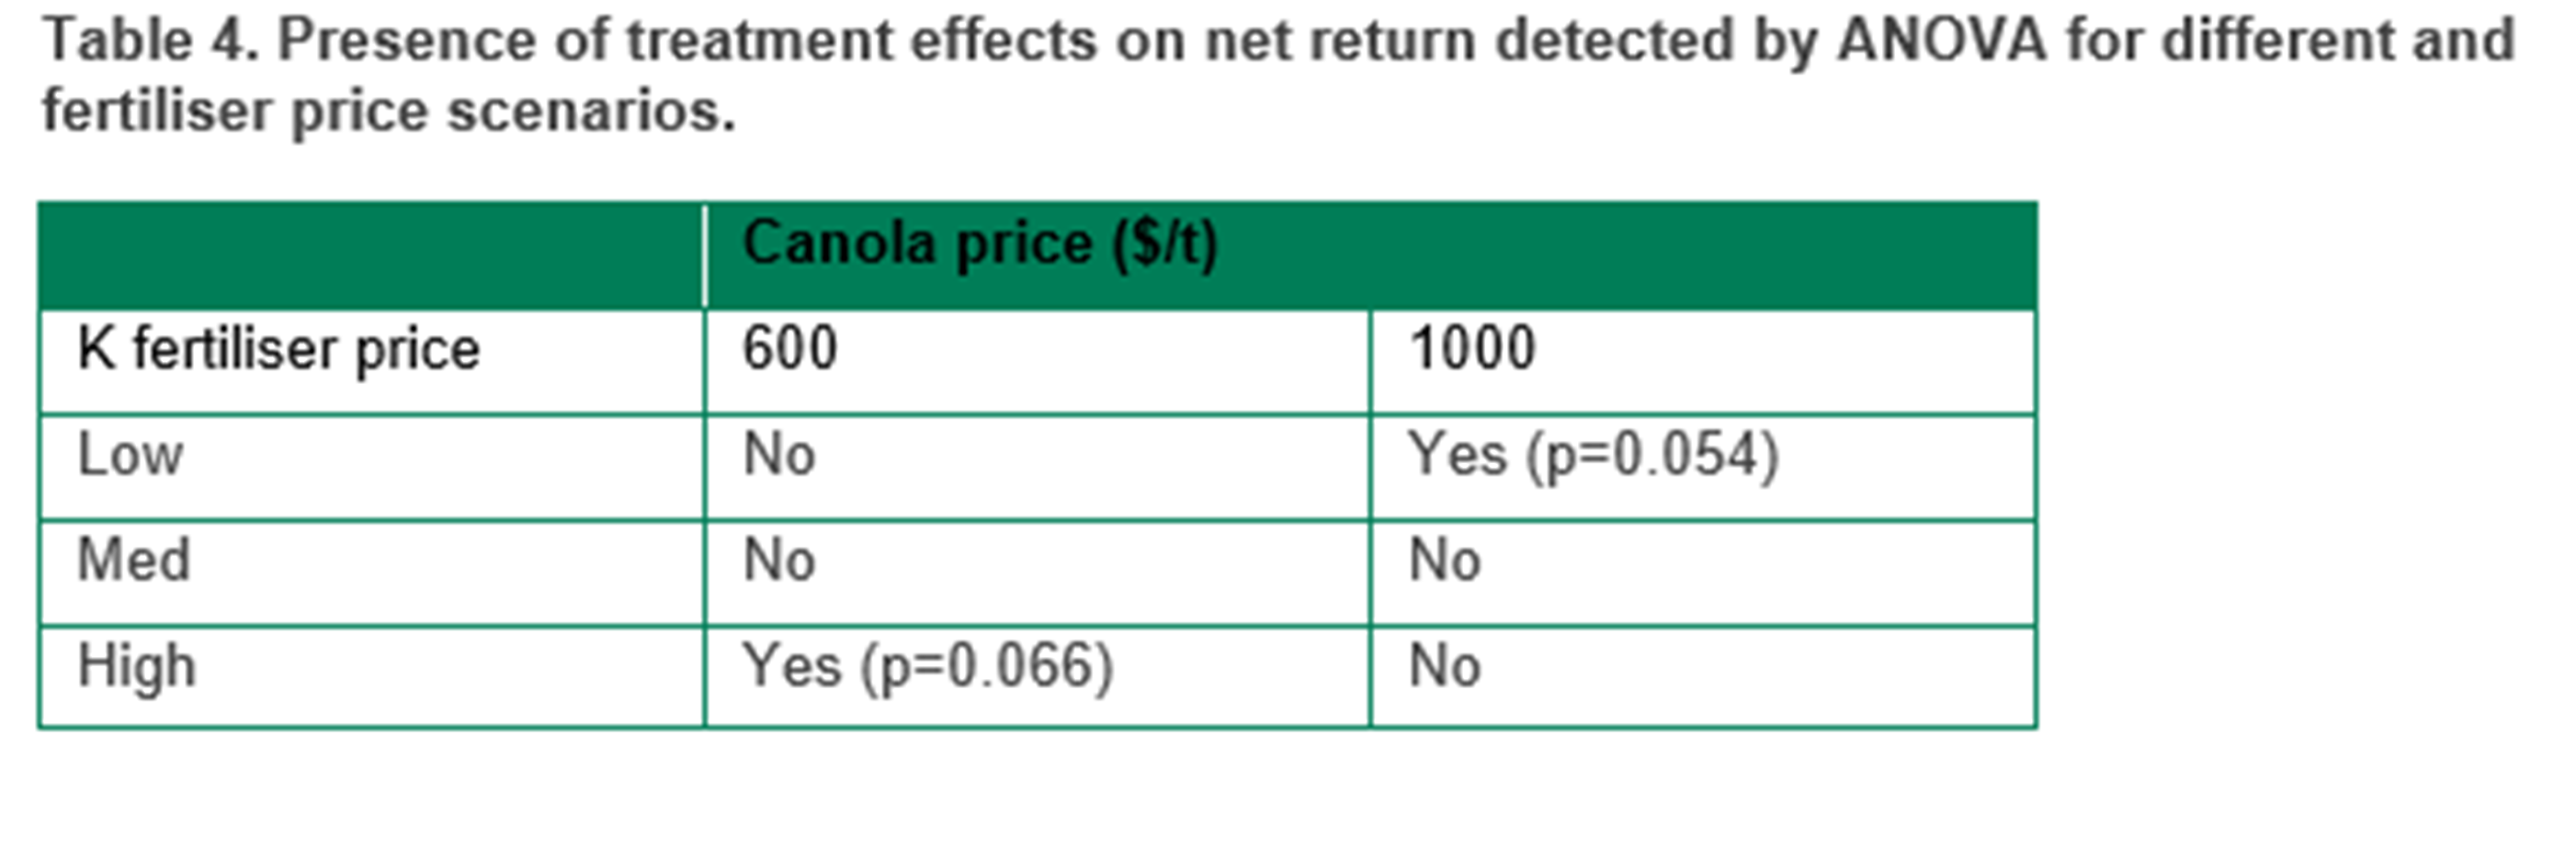
Analysis of variance for the K trial in canola showed treatment effects on grain yield, and treatment effects on gross margin in only two of the six price scenarios (Table 4). Analysis of variance showed a significant effect of K rate on grain yield, but not source. Canola grain yield was significantly higher than the nil K (3.12t/ha) at 75kg K (3.52t/ha) only, a response of 0.4t/ha, or 13%. The treatment effect on net return at low canola, high K price scenario was a source effect; the overall mean for muriate of potash (MOP) ($1914/ha) was higher than sulphate of potash (SOP) ($1851/ha). In the high canola, low K price scenario, an effect of rate was detected. The highest gross margin occurred at 30 and 70kg K/ha. Within this price scenario, 30 or 75kg K/ha as MOP or SOP, banded or topdressed, would maximise gross margin, i.e., there are multiple options that would achieve the maximum net return.
Conclusion
Our analysis suggests that a low level of precision of N, P or K fertiliser is sufficient to maximise net return. Based on the case studies presented here, fertiliser rates that are ± 20, ± 5 and ± 15kg/ha of the predicted optimum for N, P and K are likely to fall within the range of rates where maximum net return occurs. The range of rates that fall within the 90% confidence interval may be greater than the values above; we have been conservative with our interpretation because in some cases the quadratic model did not provide a good fit to the rate-net return data.
Our economic analysis also suggests that the level of yield response to fertiliser has a greater impact on the optimal rate than grain or fertiliser price. We showed that the optimal rate increases as the level of yield response increases, and the sensitivity of optimal rate to grain or fertiliser price decreases. Fortunately, the influence of yield response on optimal rates can be assessed using current decision support tools used by fertiliser advisors by assessing different scenarios of target yield and soil and residue nutrient supply.
Acknowledgments
This research was completed for the GRDC project ‘Increasing profit from N, P and K fertiliser inputs into the evolving cropping sequences in the Western Region’ (GRDC project UWA1801-002RTX), a consortium through the SoilsWest alliance that includes the University of Western Australia, Department of Primary Industries and Regional Development, Murdoch University, CSBP, Summit and the University of Adelaide.
The research undertaken as part of this project is made possible by the significant contributions of growers through both trial cooperation and the support of the GRDC, the authors would like to thank them for their continued support.
This paper includes data from previous GRDC project ‘Tactical Break Crop Agronomy’ (DAW00227):
Contact details
Craig Scanlan
Department of Primary Industries and Regional Development
75 York Road Northam
Ph: 9690 2000
Email: craig.scanlan@dpird.wa.gov.au
References
Brennan, RF, Bolland, MDA (2008) Significant Nitrogen by Sulfur Interactions Occurred for Canola Grain Production and Oil Concentration in Grain on Sandy Soils in the Mediterranean-Type Climate of Southwestern Australia. Journal of Plant Nutrition 31 (7), 1174-1187. 10.1080/01904160802134459
Brennan, RF, Jayasena, KW (2007) Increasing applications of potassium fertiliser to barley crops grown on deficient sandy soils increased grain yields while decreasing some foliar diseases. Australian Journal of Agricultural Research 58 680-689.
Gherardi, M, Mason, S, Marais, S, Pages-Oliver, J 'Does optimum wheat phosphorus requirement change with sowing time and conditions in WA? , Research Updates'. 2022, Crown Perth. (GIWA. Available
Harries, M, Flower, KC, Scanlan, CA (2021) Sustainability of nutrient management in grain production systems of south-west Australia. Crop and Pasture Science 72 (3), 197-212. https://doi.org/10.1071/CP20403
Jaynes, DB (2011) Confidence bands for measured economically optimal nitrogen rates. Precision Agriculture 12 196-213.
Mason, S, McDonald, G (2021) Time of sowing influences wheat responses to applied phosphorus in alkaline calcareous soils in a temperate climate. Crop and Pasture Science 72 (11), 861-873. https://doi.org/10.1071/CP21176
Nigon, TJ, Yang, C, Mulla, DJ, Kaiser, DE (2019) Computing uncertainty in the optimum nitrogen rate using a generalized cost function. Computers and Electronics in Agriculture 167 105030. https://doi.org/10.1016/j.compag.2019.105030
Olson, RA, Frank, KD, Grabouski, PH, Rehm, GW (1982) Economic and agronomic impacts of varied philosophies of soil testing1. Agronomy Journal 74 (3), 492-499. https://doi.org/10.2134/agronj1982.00021962007400030022x
Pannell, DJ (2017) Economic perspectives on nitrogen in farming systems: managing trade-offs between production, risk and the environment. Soil Research 55 (6), 473-478. https://doi.org/10.1071/SR16284
VSN International (2021) 'Genstat for Windows 21st Edition.' (VSN International: Hemel Hempstead, UK.)
GRDC Project Code: UMU1801-006RTX,
Was this page helpful?
YOUR FEEDBACK