P dynamics in vertosols – which soil properties affect declines in P availability over time? Are there differences between MAP and DAP?
P dynamics in vertosols – which soil properties affect declines in P availability over time? Are there differences between MAP and DAP?
Author: Nelly S. Raymond, Peter M. Kopittke, Frederik van der Bom, Michael J. Bell (The University Queensland, School of Agriculture and Food Sciences) | Date: 01 Mar 2022
Take home message
- Vertosols vary greatly in their physical and chemical properties which affect the dynamics of P availability after fertiliser addition
- The degree of P saturation (a product of original P fertility, crop removal and fertiliser inputs) is one of the key soil properties that affects both the initial increase in P-availability after fertiliser addition and the longer-term residual P availability
- DAP application can result in initially greater P availability compared with MAP in some specific vertosols, although those benefits are short-lived
- The type of P fertiliser has very minor impacts on the longer-term P-availability in vertosols compared to soil properties that influence the initial sorption and re-release of applied P.
Why the focus on phosphorus fertiliser availability in vertosols?
Grain production in northern NSW and southern and central Qld is based primarily on alkaline clay soils which had relatively high fertility prior to the commencement of cropping. In these systems there has been limited, or in some cases no phosphate fertiliser applied, with crop phosphorus (P) demands primarily met from indigenous soil P (Dalal, 1997; Wang et al., 2007). Over time, the P removal in harvested grains or forages has therefore exceeded the amount applied in fertilisers or soil amendments, and this has led to a decrease in soil P reserves. It has now become increasingly common to observe crop responses to the addition of P fertilisers (Bell et al., 2012) (Figure 1), and particularly when P fertilisers are applied into depleted subsoils. This means that while fertiliser budgets used to be dominated by nitrogen (N), there is now a need to accommodate additional P inputs. Similarly, while low rates of starter P in the seeding trench may have been adequate to meet past demands, application strategies that can ensure larger amounts of fertiliser P uptake are becoming increasingly important. The impact of these increased fertiliser requirements on grower profitability has been further accentuated by the current spike in fertiliser prices which have seen costs/kg of most inputs effectively double within a short period of time. There is therefore an increasing need to understand how, where and when to apply P fertiliser to maximise the benefits of this investment.
There is a long history of P research in southern and western cropping regions, particularly on acidic and lighter textured soils, or on highly calcareous soils in SA. However, the applicability of those findings to our northern systems on (largely) alkaline, often non-calcareous clays is limited. Key differences include
- The strongly depleted soil P reserves;
- The alkaline soil pH and resulting soil-fertiliser P reactions that determine availability;
- The high clay contents in the vertosols, that limit internal P redistribution, and that provide a large number of potential P sorption sites that could limit fertiliser P availability to plants;
- The widespread lack of tillage and profile mixing, combined with a large reliance on water (and nutrients) extracted from subsoils during dry periods.
- Fewer growing season rain days and associated greater reliance on deep stored soil water and thus greater capacity for nutrients to become stratified and unavailable to the crop.
These points are all significant in terms of how they may impact on P management in the cropping system. Southern and western Australian cropping regions started with very low P soils, but regular applications of P fertilisers for many decades, often at rates greater than those needed to meet crop demand, have been able to build a ‘bank’ of soil P fertility in many situations. This has resulted in P deficiencies now being much less common and growers and advisers are questioning whether future strategies should change to a soil P maintenance strategy, or even an occasional P mining event when fertiliser prices are high. The northern vertosols are heading in the opposite direction on the soil P decline curve, with previously adequate P concentrations now suboptimal, and those effects often most significant in subsoils. While deep banding has been proposed as a strategy to address this subsoil P decline and has shown some strong productivity and profitability impacts in trials in many areas, research is also showing that reliance on those deep bands can be very seasonally dependent and is limited in what it can provide to a crop due to drying out of the soil around the band (e.g., see van der Bom et al. these proceedings). Indeed, researchers are suggesting a much greater emphasis on timing and placement of any fertiliser P inputs such that the soil volume and profile distribution of P-enriched soil is increased (i.e., to some extent, attempting to rebuild a broader soil P bank).
However, to improve the P fertility of vertosols and the ability of crops to acquire the P they need to optimise crop performance under variable seasonal rainfall, there needs to be a fundamental understanding of what happens to fertiliser P that is either banded or mixed into different profile layers in these soils. Due to the historical lack of an imperative for P application in these soils, this understanding is limited to specific combinations of sites and seasonal conditions – not always with no till cropping management (Hibberd et al., 1991; Strong et al., 1997; Dorahy et al., 2005). Recent research has started to explore the P dynamics that occur in concentrated fertiliser bands in different soils and with different P (and K) fertilisers (Meyer et al. 2020), with a particular focus on deep banded applications. However, not all P is applied at high rates in concentrated bands in subsoils, and crop residues and unused starter P are returned, and often mixed into, topsoil layers. Interactions between soil type and bioavailable P fractions, the volume of soil enriched during fertiliser application, seasonal moisture availability and crop root system dynamics are all expected to be key factors driving fertiliser P dynamics in vertosol soils and will influence how readily crops can access these inputs over a crop rotation.
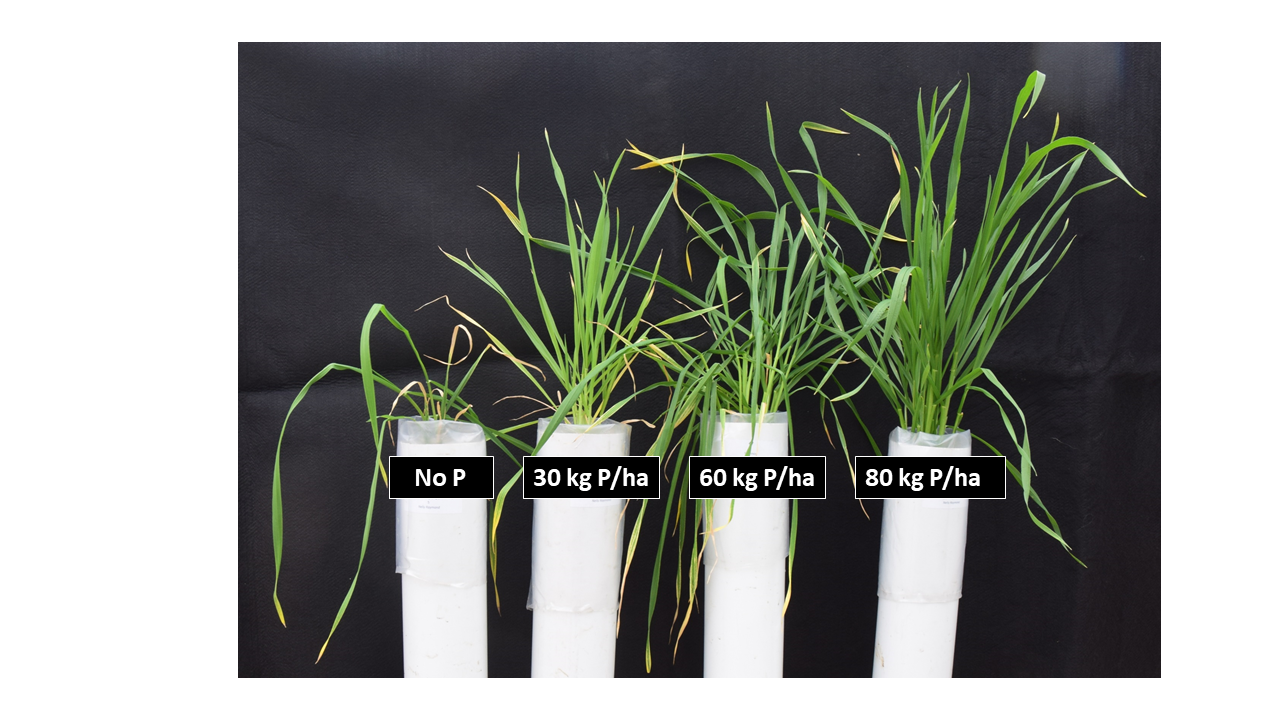
Figure 1. Effect of MAP addition on wheat growth in a long-term cropped Central Queensland (CQ) soil
Objectives of the research
The research reported here was conducted to provide a better understanding of P behaviour in alkaline clay soils from the northern grains region (NGR) with a longer-term objective of being able to predict the behaviour and residual value of different P fertiliser strategies in grains cropping systems. The work has focussed on vertosols, which vary greatly in their physical and chemical properties that are likely to affect soil P dynamics. While other research has focussed on banded P, these studies have focussed on fertiliser P applications that involve a greater degree of fertiliser mixing and exposure to the surrounding soil particles, equivalent to incorporation of fertilisers or crop residues with tillage.
The project initially focussed on the evaluation of crop models to simulate soil P dynamics and crop responses to historic long term fertiliser trials run by Strong et al. (1997) and Hibberd et al. (1991) and found that these models have struggled to predict soil P dynamics, and hence residual P value in crop sequences (Raymond et al., 2021). This has necessitated a fresh look at P behaviour in these soils, focussing on the initial interaction between soil and fresh fertiliser (dominated by P sorption reactions) and the subsequent residual value of added fertiliser P with increasing times after application. The soil assays used the most common commercial P fertilisers mono-ammonium-P (MAP) and di-ammonium P (DAP). These fertiliser products cause different pH in the soil solution as they dissolve, with MAP producing an acidic pH in solution (pH 3.5) whilst DAP produces an alkaline pH in solution (pH 7.5-8). These differences in pH reaction are expected to influence P behaviour and dynamics within the soil.
The work reported here focuses on P dynamics and recovery from soil using a variety of laboratory analyses. The project is also undertaking glasshouse studies to extend the findings to include plant P uptake using wheat or chickpeas grown in soils supplied from sites established in UQ00082, and while these are nearing completion, results are not reported here.
Our specific objectives were:
- Determine the variability in sorption and desorption reactions that occur when fertiliser P is applied to different vertosols in the period immediately following application
- Examine the changes in indices of soil P availability determined shortly after P application, and then how those changes persist or decline with increasing time in the soil.
These two objectives will provide insights into the impact of P fertiliser type (ammonium phosphates with either acidic or alkaline reactions) on the dynamics and availability of P in a range of vertosols from the NGR, and will determine the extent to which these differences in P dynamics and availability can be explained by differences in key soil properties
Large gradient in physical and chemical properties in vertosols
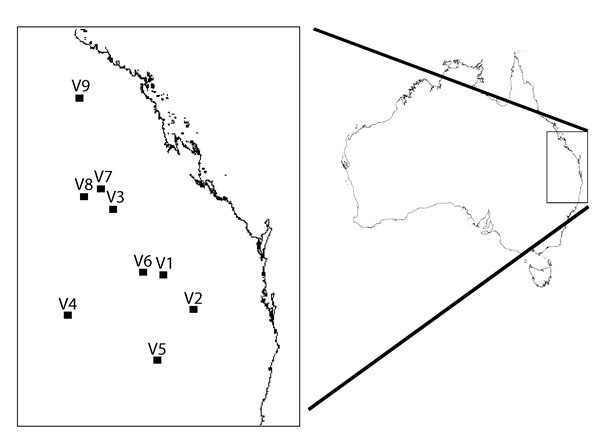
Vertosols vary greatly in their physical and chemical properties, although it is not clear which of these soil properties will contribute to differences in crop P availability. We collected vertosols from nine sites across the NGR (Figure 2) to study the dynamics of added fertiliser P in response to the variation in soil characteristics they provided. All the soils came from fields with a long-term cropping history with limited or no P fertiliser application, so total P contents were low and soil P tests (e.g., Colwell-P and BSES-P) indicated a likelihood of crop fertiliser response. While low P availability was common to all the soils, they differed markedly in other properties likely to affect the dynamics of added fertiliser P. As an example, soil pHw varied from 5.7 to 8.8, there was a large variation in clay content (24 – 58 %) and the likely number of P sorption sites (indicated by characteristics such as the presence of iron and aluminium oxides and free calcium carbonate) differed greatly. This variability in intrinsic properties related to plant P supply highlight the fact that vertosols cannot be consider as one unique soil type and that the fate of applied P fertiliser is likely to differ from one vertosol to the other.
Soils | V1 | V2 | V3 | V4 | V5 | V6 | V7 | V8 | V9 |
|---|---|---|---|---|---|---|---|---|---|
pHwater | 8.2 | 8.8 | 8.7 | 8.7 | 6.5 | 8.7 | 7 | 7.3 | 8.8 |
Clay (%) | 58 | 53 | 41 | 41 | 28 | 35 | 52 | 56 | 45 |
CEC (cmol_c kg-1) | 69 | 61 | 49 | 26 | 16.3 | 24 | 23 | 65.6 | 53 |
Ptotal (mg P kg-1) | 329 | 972 | 295 | 157 | 138 | 193 | 134 | 161 | 132 |
Colwell-P (mg P kg-1) | 8 | 4 | 7 | 13 | 9 | 7 | 3 | 15 | <2 |
BSES-P (mg P kg-1) | 59 | 22 | 67 | 15 | 12 | 44 | <2 | 5 | 7 |
PBIColwellP | 163 | 245 | 165 | 110 | 52 | 101 | 211 | 161 | 149 |
Al+Feoxides (%) | 1.1 | 1.1 | 0.8 | 1.2 | 0.5 | 0.6 | 4.1 | 4 | 1.5 |
Variability in sorption and desorption reactions with fertiliser P addition
The use of sorption and desorption curves can provide insights on P application strategies to optimise plant P acquisition and are also considered a useful tool to describe the short-term behaviour of added P. Sorption curves are generated by the addition of graded amounts of P to soil (Rayment & Lyons, 2011), and determine the extent to which that P is retained (sorbed) onto the soil matrix. The present study showed that vertosols drastically differed in their short-term P sorption behaviour (Figure 3), which was reflective of the wide range of soil properties within this soil type. The PBI criteria defined by Moody (2007) classified these soils as having low (V5 – PBI 52) to moderate (V1, V2, V9 - 150 to 250) sorption capacities, and while the relative ranking of the maximum amounts of sorbed P were consistent with this index (i.e. V5 < V1 and V9 < V2), these differences reflected large differences in the capacity of each of these soils to sorb P.
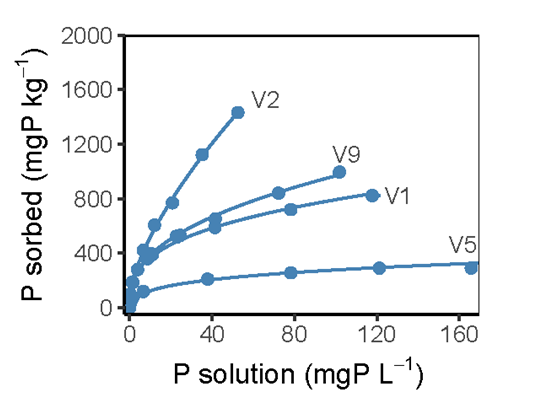
Figure 3. Sorption curves for selected vertosols fitted using a non-linear regression model based on a Freundlich equation.
The variability between soils was even more substantial when the subsequent desorption process (release of sorbed P back into solution) was studied. The desorbability of the previously sorbed P varied substantially between vertosols, and with the amount of added P that had been sorbed in each soil (Figure 4). At low concentrations of sorbed P (LH panel), analogous to low (commercial) rates of P fertiliser broadcast and mixed through the soil volume with conventional tillage, only small fractions of the sorbed P could be desorbed and that release differed substantially between vertosols (between 2 and 10 % of the previously sorbed P). This suggests that low rates of dispersed P may have limited plant availability in many low P vertosols, even shortly after fertiliser application. Conversely, larger fractions of sorbed P were readily desorbable when high concentrations of P had been sorbed, which would be analogous to the situation after a long history of P fertiliser use, or in close proximity to a fertiliser band. This suggests that P in and around fertiliser bands should result in higher relative P availability (up to 75 % of sorbed P), compared to dispersed P that has reacted with larger soil volumes, and is therefore retained more strongly on the soil matrix. Additionally, at high concentrations of sorbed P, the desorption of P was ‘relatively’ similar across the soil types, especially for those with ‘similar’ PBI values (see High P example in Figure 4b, where PBI ranges between 101 and 211). Collectively, these sorption and desorption curves on vertosols with low P and little history of fertiliser P application showed that even in the vertosols in which P was more readily desorbable, mixing P fertiliser through large soil volumes is likely to be a less efficient way of improving plant P uptake.
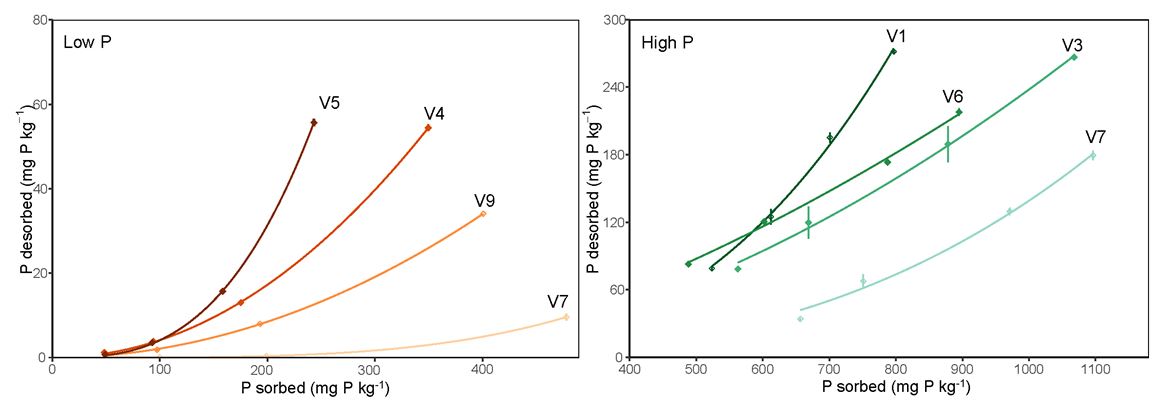
Figure 4. Phosphorus desorption curves for four vertosols differing in their P release at left (a): low concentration of P initially sorbed (< 500 mgP kg-1; Low P) and right (b) at high concentration of P initially sorbed (> 500 mgP kg-1; High P).
Effect of soil properties on longer-term P availability
Sorption and desorption curves are useful to describe P behaviour in the very short-term, but time is likely to further affect the amount of P sorbed and the extent to which it is either ‘fixed’ or only slowly available. Formation of more stable calcium phosphates and increasing occlusion of adsorbed P will both reduce the long-term availability of P (Lindsay et al., 1989). These factors, combined with a low proportion of applied P typically recovered in the year of application in many cropping systems, highlight the need to understand the longer-term soil P dynamics in relation to specific soil properties that will ultimately determine the residual value of applied fertiliser P.
To determine the soil properties affecting the decline in P availability over time after P fertiliser addition, we set up an incubation with the nine contrasting vertosols. The soils were incubated with P fertiliser applied mixed through the soil volume. Two fertiliser types were used: MAP and DAP at a rate of 50 mg P kg-1 (~ 55-60 kg P ha-1). Soil P-availability was assessed using Colwell-P and BSES-P measured after 10, 30, 90 and 365 days of incubation. Similar trends were reported with both extracts, so only the Colwell P data are reported here.
The application of P fertiliser significantly increased P availability measured with Colwell-P in all soils (Figure 5). However, it was clear that the initial net increase in P-availability 10 days after P addition was highly variable between soils, with the increase in Colwell P in response to the same amount of P fertiliser addition ranging from the equivalent of 12 and > 80 % of the applied P. As an example, the fertiliser-induced increase in P availability measured using Colwell P in V7 was very marginal (e.g., net increase of only 6.3 mg P kg-1 with MAP and 7.5 mg P kg-1 with DAP). On the other hand, the net increase in Colwell-P in V5 was 30 mg P kg-1 with MAP and 44 mg P kg-1 with DAP. These results correlate with the sorption and desorption behaviour previously observed for low rates of added P and they again emphasise the variable responses to incorporated P in different vertosols.
As the time in the incubation increased, the Colwell extractable P decreased, with the sharpest decrease occurring relatively quickly after P fertiliser addition (between day 10 and day 30 of the incubation (Figure 5)). After 30 days incubation, subsequent changes in Colwell-P were negligible or indicated only a marginal loss of P-availability. The decline in P-availability differed considerably between soils, with net recovery of the added P in the Colwell-P extract falling by between 6 and 44%. One year after P fertiliser addition, soil differences were more pronounced, with V1, V3, V4, V5 and V6 showing much higher residual effects on Colwell-P than V2, V7, V8 and V9. For the former ‘high residual P’ group, the residual increase in Colwell-P was at least twice as high at 1 year (~20 mg P kg-1) than in the low response group of soils (~10 mg P kg-1).
The initial value of Colwell-P 10 days after P fertiliser addition was correlated to the degree of P saturation (DPS) of the soils in their pre-incubated condition, with this index calculated as the soil background Colwell-P (before P fertiliser addition) divided by the phosphorus buffering index (PBIColwell-P)(DPS = Colwell-P/PBIColwell-P). This showed that the number of P sorption sites (indicated by the PBIColwell-P) and their relative saturation (indicated by the desorbable P measured by the Colwell P extract) were key determinants of the decline of P availability over time. While the number of sorption sites is likely to be influenced by the clay content and mineralogy of the soils themselves, the degree of P saturation will be strongly influenced by cropping duration and the previous applications of P fertiliser.
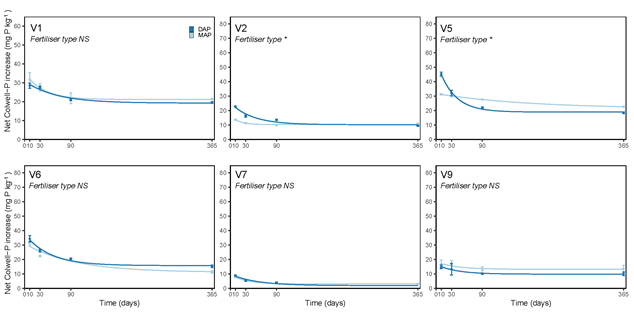
Figure 5. Phosphorus availability decline over time in Colwell-P after the addition of 50 mg P kg-1 (~ 60 kg P ha-1) applied as MAP or DAP. The star after ’Fertiliser type’ indicates that the type of fertiliser has a significant effect on Colwell-P decline over time while ’NS’ indicates no significant differences between the fertiliser types.
Does the type of fertiliser matter when broadcast and mixed throughout the soil profile?
Differences in the granule dissolution pH have been hypothesised to influence P-availability in soil. Therefore, because the difference in the fertiliser granule dissolution pH between MAP (pH 3.5) and DAP (pH 7.5-8) were so marked, MAP has often been preferred for alkaline soils (e.g., vertosols) while DAP has been preferred in more acidic soils (e.g., Ferrosols). In our incubation, the type of fertiliser used had only marginal effects on the Colwell-P test value 10 days after application. The addition of 50 mg P kg-1 as MAP or DAP increased the average Colwell-P test result across all soils by 28.1 and 30.6 mg P kg-1, respectively, with DAP addition resulting in slightly greater P availability in some vertosols (e.g., V2 and V5). Although DAP resulted in higher initial P-availability in some specific soils, it was clear that over time, most differences in P availability between MAP and DAP disappeared. The initial higher P availability measured with DAP correlated with higher P availability observed in the concentrated P bands of this product (Meyer, 2020), and can be explained by the initial change in soil solution pH after P fertiliser application. The greater acidification by MAP is likely to result in more precipitation reactions, leading to a greater reduction in P availability shortly after P mixing through soil. However, in contrast to P banded applications, the soil solution is likely to be less saturated and can quickly be buffered by the surrounding (unfertilised) soil, which is consistent with the lack of differences in P availability between MAP and DAP over longer periods. While there is no clear long-term benefit of using MAP or DAP on P-availability, it is clear that soil characteristics rather than the fertiliser type seem to determine the increase in soil test P after fertiliser application, and their residual benefits in the longer-term.
Practical implications
- This research suggests that the further the native soil P reserves in cropped vertosols are run down before starting fertilising to halt or reverse this trend, the harder it is going to be to return to a system that can meet crop P demands – both in terms of investment in P fertiliser to make a difference, and in the flexibility of application strategies than can be employed
- When dealing with low P vertosols, and particularly in soil layers that have not received much/any P fertiliser (e.g., depleted subsoils), banding is clearly the most reliable application strategy. Smaller, less concentrated bands that collectively enrich more of the soil volume (i.e., narrower band spacings, or more frequent, lower rate applications in different positions) are likely to minimise the precipitation reactions previously seen in narrow concentrated bands, but also reduce the strong P sorption observed when P is mixed throughout large soil volumes
- This research has demonstrated that the choice of fertiliser product has little impact on either the short- or longer-term fate of applied P, with soil properties a more important determinant of the effectiveness of applied P in increasing soil P availability to plants
- Identification of the specific soil properties that drive these dynamics, and the extent to which any such indicators can form part of routine soil test diagnostics (e.g., like PBI) will have a large impact on the fertiliser strategy recommended to rebuild soil P reserves and cropping systems resilience
- These results require further research to confirm the correlation between these laboratory soil assessments of P availability and increased plant recovery of applied P.
Acknowledgements
The research undertaken as part of this project is made possible by the significant contributions of growers through both trial cooperation and the support of the GRDC, the authors would like to thank them for their continued support.
Many people assisted with various aspects of the project and the experiments, sample collection and processing and sample analyses, including Brigid McKenna, Tim Rossignol, Celso Cordova and Meghan Barnard at the University of Queensland; and David Lester, Doug Sands and Peter Want at the Department of Agriculture and Fisheries (DAF), QLD. Dr. Enli Wang at CSIRO.
References
Bell M, Lester D, Smith L, Want P (2012) Increasing complexity in nutrient management on clay soils in the northern grain belt–nutrient stratification and multiple nutrient limitations. Proceedings of 16th Australian Agronomy Conference. 14-18.
Dalal RC (1997) Long-term phosphorus trends in vertisols under continuous cereal cropping. Australian Journal of Soil Research 35(2): 327-339.
Dorahy C, Rochester I, Blair G (2005) Response of field-grown cotton (Gossypium hirsutum L.) to phosphorus fertilisation on alkaline soils in eastern Australia. Soil Research 42(8): 913-920.
Hibberd D, Want P, Hunter M, Standley J, Moody P, Blight G (1991) Marginal responses over six years by sorghum and sunflower to broadcast and banded phosphorus on a low P Vertisol, and changes in extractable soil phosphorus. Australian Journal of Experimental Agriculture 31(1): 99-106.
Lindsay WL, Vlek PL, Chien SH (1989) Phosphate minerals. Minerals in soil environments(mineralsinsoile): 1089-1130.
Meyer G, Bell MJ, Kopittke PM (2020) Understanding factors affecting the effectiveness of P and P+K fertilisers when deep banded. GRDC Update Goondiwindi. Goondiwindi, Australia.
Moody PW (2007) Interpretation of a single-point P buffering index for adjusting critical levels of the Colwell soil P test %J Soil Research. 45(1): 55-62.
Rayment GE and Lyons DJ (2011) Soil chemical methods: Australasia: CSIRO publishing.
Raymond N, Kopittke PM, Wang E, Lester D, Bell MJ (2021) Does the APSIM model capture soil phosphorus dynamics? A case study with vertisols. Field Crops Research 273: 108302.
Strong WM, Best EK, Cooper JE (1997) Phosphate fertiliser residues in wheat-growing soils of the Western Downs, Queensland. Australian Journal of Soil Research 35(2): 341-354.
Wang X, Lester DW, Guppy CN, Lockwood PV, Tang C (2007) Changes in phosphorus fractions at various soil depths following long-term P fertiliser application on a black vertosol from south-eastern Queensland. Australian Journal of Soil Research 45(7): 524-532.
Contact details
Dr. Nelly Raymond
The University of Queensland
St Lucia Campus
Ph: 04049 18489
Email: n.raymond@uq.edu.au
Prof Mike Bell
University of Queensland
Gatton Campus
Ph: 0429 600730
Email: m.bell4@uq.edu.au
GRDC Project Code: UOQ1905-009RTX,
