Satellite sites – ameliorating spatially variable soil constraints. What did growers try, what was done and how has it worked so far?
Author: Stirling Roberton, University of Southern Queensland | Date: 02 Mar 2022
Take home message
- Soil constraints are highly spatially variable
- Crop response to soil amelioration is complex and soil specific, meaning it is difficult to predict which soils will provide the biggest crop response for a specific farm (which soils should I invest in?)
- Installation of strip trials can be used to identify the farm-specific soils which offer the greatest economic potential for improvement
- The presented methodology offers an approach to develop a business case to guide investment into soil amelioration.
Introduction
Soil constraints are prevalent across the northern grains region, with very few farms displaying unconstrained conditions. These constraints (acidity, alkalinity, compaction, salinity, dispersion, sodicity and nutrition) limit crop yield by reducing the soil’s ability to store water and nutrients and provide them to the plant when they are needed. Soil constraints are overcome by the implementation of various soil amelioration strategies, which are largely focussed on improving soil structure, chemical stability and nutrient availability within the soil which in turn improves the storage and movement of water and nutrients. Consequently, soil amelioration is largely focused on strategies such as deep ripping, manuring, applications of lime and gypsum, fertilisers and elemental sulphur and combinations of all, both in the surface (0–20 cm) and sub-surface (20–80 cm). Implementation of these strategies are intended to have a permanent, or at least semi-permanent improvement in soil structure/soil health which will ultimately increase the long-term production value of the soil resource. Whilst the long-term economic significance of this is large, the investment required to make these changes is often substantial ($200–$2000/ha). Hence, when making these capital investments, we want to be confident that they are only being applied to areas of the paddock where they are needed, and there is some indication on what the likely Return-On-Investment (ROI) will be before expenditure is made.
Unfortunately, there is no crop model which can accommodate changes in soil chemistry or soil structure to simulate crop yield response due to soil amelioration for a specific soil. Whilst our six regional core soil amelioration trials are invaluable in providing a broad indication of what crop responses are achievable, they are limited by two factors:
- Soil constraints and their severity is highly spatially variable
- Crop response due to amelioration is complex, non-linear and soil specific. This means we can have 2 soils which share similar soil constraints within the same paddock (e.g. an acidic-dispersive soil), require the same application rate, yet they may have different crop responses due to amelioration.
This means within a single paddock, a variety of soil amelioration strategies may be considered, all on a variable-rate basis. Furthermore, even if we get the diagnosis correct, there is still no indication of what the likely ROI may be. Are you better off investing in areas of the paddock which require 6 t/ha of gypsum, or the areas that only require 2 t/ha? Which will provide the best return? Which soils should you invest in?
To answer these questions, we developed a new methodology which involves the installation of on-farm soil amelioration strip trials to guide farm-specific investment decisions. Whilst results from these trials remain in the infant stages (i.e., currently only 1–2 years’ worth of data), this paper demonstrates how the installation of soil amelioration trials may be used to estimate what the likely ROI may be for soil amelioration on any farm and identify how these trials can be used to guide investment in other areas of the paddock/farm
Developed methodology
The methodology described below has been deployed to install a total of 18 strip trial sites at the time of writing, out of a total of 61 farms across the Northern Grains Region where some preliminary work has been undertaken. The key point of difference of the methodology is the spatial analysis which is undertaken along each trial strip, where crop responses are measured down the strip as opposed to simply comparing strip totals or averages. This provides the ability to firstly identify where the biggest crop responses are being observed, and secondly, to identify which soil types/soil constraints the largest crop responses are being achieved from. Once obtained, this information can be combined with a more extensive paddock/farm mapping exercise to determine where similar constraints exist across the rest of the paddock/farm. Soil amelioration investment can then be targeted to those areas where the largest crop response is likely.
This paper uses an example trial located in central NSW, where only a single years’ worth of yield data is currently available. Practical deployment of this methodology should rely on multi-year data, so this example exists only for illustrative purposes only.
The implemented methodology takes the following steps:
Step 1 – Initial sampling constraint diagnosis
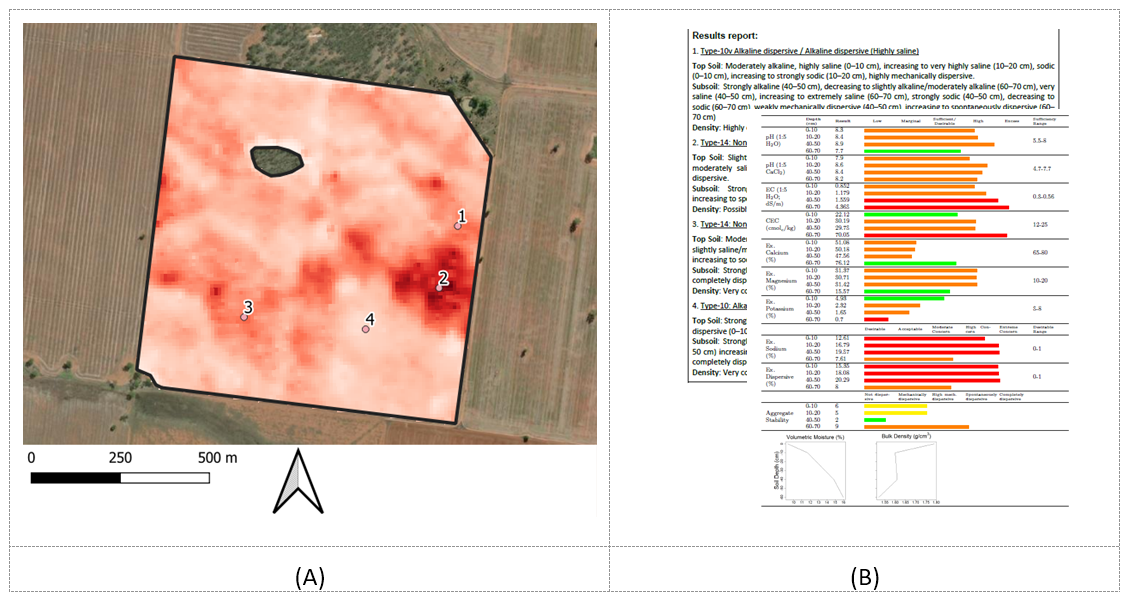
This step seeks to broadly identify the main constraints and their spatial variability across the paddock. Here we utilised EMI data, elevation data, yield data, gamma radiometric data, long-term NDVI information and grower experience information to select 4x sampling locations aimed at identifying the broad constraints and their spatial variability across the paddock (Figure 1A).
Step 2 – Constraint diagnosis
The second step requires the accurate diagnosis of soil constraints from laboratory analysis of the 4 extracted soil cores at multiple depths through the profile (0–10 cm, 10–20 cm, 40–50 cm and 60–70 cm for each soil core). Soil analysis included; soil pH, soil EC, exchangeable sodium percentage (ESP), texture, aggregate stability, bulk density and nutrient analysis. Given what we know about the spatial variability of soil constraints across a paddock, using a sample size of only 4 cores is not sufficient to accurately diagnose the extent of the constraints, nor is it sufficient to design variable-rate management plans. It merely provides an indication of the range of issues the grower is dealing with and informs which amelioration strategies may be considered. Figure 1B displays an example of the laboratory and soil constraint reports developed for each site.
Step 3 – Trial design, implementation and benchmark sampling
Once constraints have been diagnosed, treatments are designed according to the most severe constraint and positioned in a location which is both representative of this constraint and which considers paddock variability. This will help ensure adequate investigation of treatment responses across the paddock variability. In this approach, we accept that there will be areas where treatment application will likely be over-applied, and areas where it will be under-applied. The only way to avoid this is to increase sampling density to design a variable-rate trial plan prior to implementation. Whilst this is possible, a more cost-effective initial solution is to initially blanket-apply the treatment strip, and then back-calculate where over- and under-application was achieved. A key component of the methodology is the intensive benchmark soil sampling which is taken along each treatment strip (Figure 2). These samples are used in the latter steps to identify which soil constraint types are providing the largest yield response. Examples of treatment installation is displayed in Figure 3.
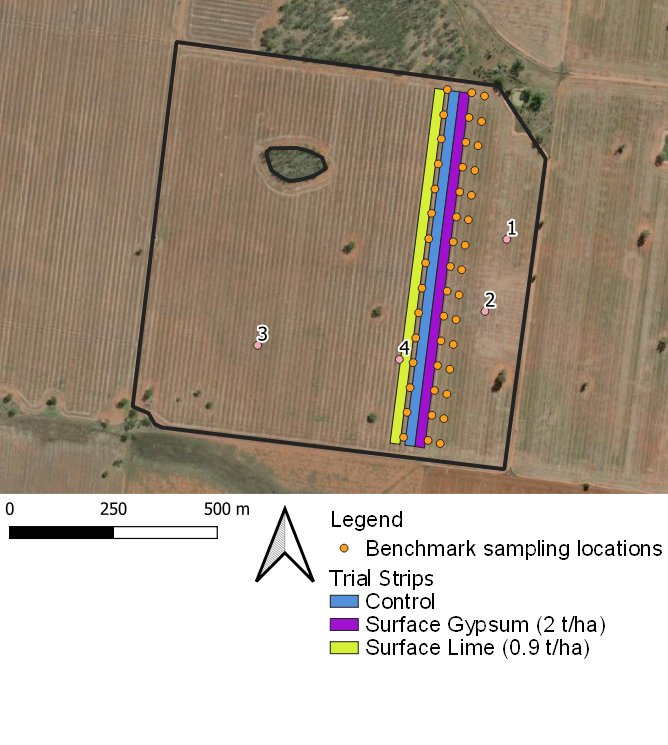
Figure 2. Trial design and benchmark soil sampling locations
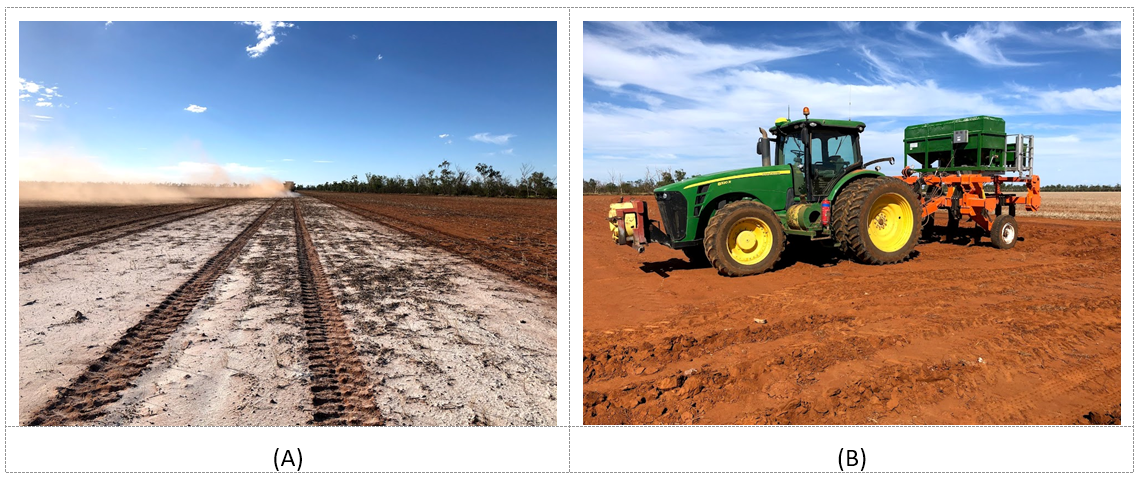
Figure 3. Trial implementation for surface lime (A) and deep rip + deep placed gypsum (B). Note that deep placed gypsum was not undertaken at the site in this example but is shown here for reference.
Step 4 – Observe and map yield response
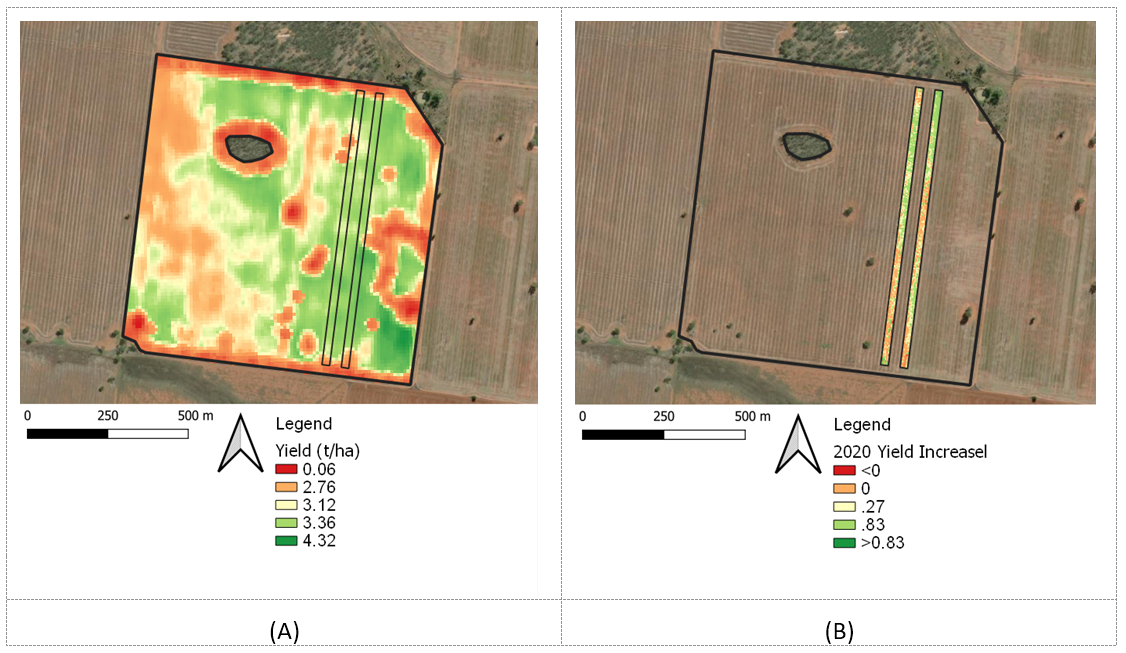
Over several seasons, yield data (obtained from the header) should be collected and analysed across the trial site. Yield analysis should not stop at calculating strip totals/strip averages, but instead should involve a yield response calculation, where every harvested point along each strip is compared directly to its closest control point in the nil strip. Undertaking this style of spatial analysis identifies which parts of the strip are contributing the biggest yield responses. Figure 4 displays an example of this type of analysis in practice. When only observing the entire yield map in Figure 4B, no visual responses in the treatment strips can be observed. However, after undertaking spatial analysis of the strips and comparing each point to its closest control point, it is apparent that there are areas of each strip contributing an ~0.8t/ha yield increase, which may be considered significant. Whilst this is only observed in small areas of the strip, these soil constraints/soil types may represent larger area across the paddock/farm. Hence, using this approach, it is possible to identify which soils offer the greatest potential to benefit from soil amelioration. The final step is to identify where else these conditions exist (Step 5).
Step 5 – Paddock and farm analysis (future work)
The final step extrapolates the yield responses observed along the trial strips to estimate which other areas of the paddock/farm will likely produce a similar yield response if amelioration was attempted. Achieving this requires two sub-steps: 1) laboratory analysis of the benchmark soil samples which were taken along the length of each strip at treatment installation; and 2) an intensive soil survey taken across the remainder of the paddock/farm to map soil constraints at fine scale. Whilst this second step will require increased investment in soil sampling, the dataset will be valuable in identifying the areas across the paddock/farm which will provide the largest yield responses if amelioration was attempted. This sampling investment may be considered as a due diligence step prior to making a substantial soil amelioration investment. In doing so, soil amelioration can not only be targeted to the areas where required, but targeted to the areas which will provide the largest yield response and subsequently, ROI from the amelioration. This analysis may be used to build amelioration investment reports which can be used to justify investment in soil amelioration, whether it be for internal budgeting purposes or external financing requests. Figure 5 provides an example of how the yield responses obtained from the treatment strips can be coupled with paddock maps of constraints to identify areas which are likely to provide a similar response.
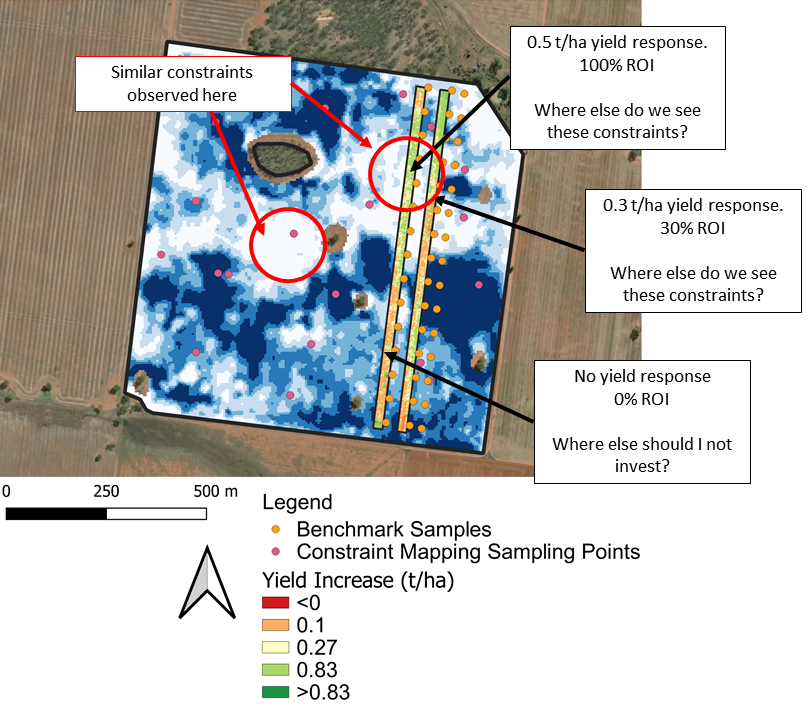
Figure 5. Illustrative example of how tracking the yield responses down the strip can be used to infer where similar yield responses may be achieved in other areas of the paddock/farm.
Conclusion
This paper has presented a methodology which can be deployed to estimate the likely yield response and ROI of soil amelioration before wide-scale investment is attempted. This step-based approach relies on implementing site-specific strip trials (tailored to each site) to tell us which soils offer the greatest potential for improved crop response. Coupled with soil amelioration cost data, it also becomes possible to map ROI of soil amelioration. Using multi-year yield data, this methodology may be used to develop whole-farm soil amelioration investment plans which may be used for internal budgeting purposes, or to access external financing to achieve large-scale amelioration. Achieving this remains a goal of future work.
Acknowledgements
The research undertaken as part of this project is made possible by the significant contributions of growers through both trial cooperation and the support of the GRDC, the author would like to thank them for their continued support.
Thank you to all out our fantastic farming co-operators who have made significant contributions in the establishment of these trials.
Contact details
Stirling Roberton
University of Southern Queensland
West St, Toowoomba, QLD, 4350
Ph: 0417 138 503
Email: Stirling.roberton@usq.edu.au
GRDC Project Code: USQ1803-002RTX,
Was this page helpful?
YOUR FEEDBACK

