How soil organic matter and carbon work! Data from 500 paired-site comparisons across the northern region
How soil organic matter and carbon work! Data from 500 paired-site comparisons across the northern region
Author: David Lawrence (QDAF), Michael Bell (UQ), Jayne Gentry (QDAF), Suzette Argent (QDAF), Rod O’Connor (QDAF) | Date: 20 Jul 2022
Take home message
- Soil organic matter and its nutrients currently have far more value than soil carbon itself. Soil organic matter is 58-60% carbon, so soil organic carbon is used as an indicator of soil organic matter levels
- Soil organic matter (and carbon) levels are just a balance between the dry matter produced and retained in the paddock versus its subsequent loss and breakdown by microbes
- Grain production can reduce soil organic matter levels by up to 70%, mainly due to fallowing
- In-crop agronomy has much less effect on soil organic matter levels than land use changes, such as clearing land for cropping. However, modern farming practices that maximise water-use-efficiency for extra dry matter production are key to protecting soil organic matter. More crops with higher yields, pasture rotations and not burning or baling, will all help maintain soil organic matter levels
- Well-grown pastures can make major improvements in old croplands. Soil organic carbon levels under pastures have been measured at up to 1.0 t/ha/year higher than with continued cropping
- All grain growers need an informed soil organic matter strategy because it underpins their soil’s resilience, nutrient supply, and general soil health.
Background
Soil organic matter is critical for healthy soils and sustainable agricultural production. This is not ‘news’ to growers, agronomists, or indeed anyone with a vegetable garden or compost heap at home. We know that healthy soils with high organic matter levels grow better crops that are easier to manage. However, we also know that soil organic matter (SOM) and soil organic carbon (SOC) levels are declining, which means continued grain production and healthy crops are needing more fertiliser, especially for nitrogen (N).
To make sensible decisions on how best to manage SOM and SOC on our own farms, we need to understand how SOM and SOC work, why their levels are declining, the implications for enduring profitability, and what we can realistically do about it.
Soil organic carbon – an indicator of soil organic matter
SOM is what’s important to agricultural production. However, SOC is a reliable indicator (~ 58-60% of organic matter) that we can measure and so talk about. This means a soil with 1.0% SOC has ~1.7% organic matter by weight. Over time SOC has become a key indicator of soil health, the sustainability of long-term crop production and the need for continual inputs to maintain productivity.
Forms and dynamics of soil organic matter and carbon
SOM is ‘everything in or on the soil that is of biological origin, whether it’s alive or dead’. It includes live plant roots and litter (not shoots), humus, charcoal, and other recalcitrant residues of organic matter decomposition. It also includes the organisms that live in the soil that are collectively called the soil biota (e.g., fungi, bacteria, mites, earthworms, ants and centipedes). The one thing all these materials have in common is that they all contain carbon.
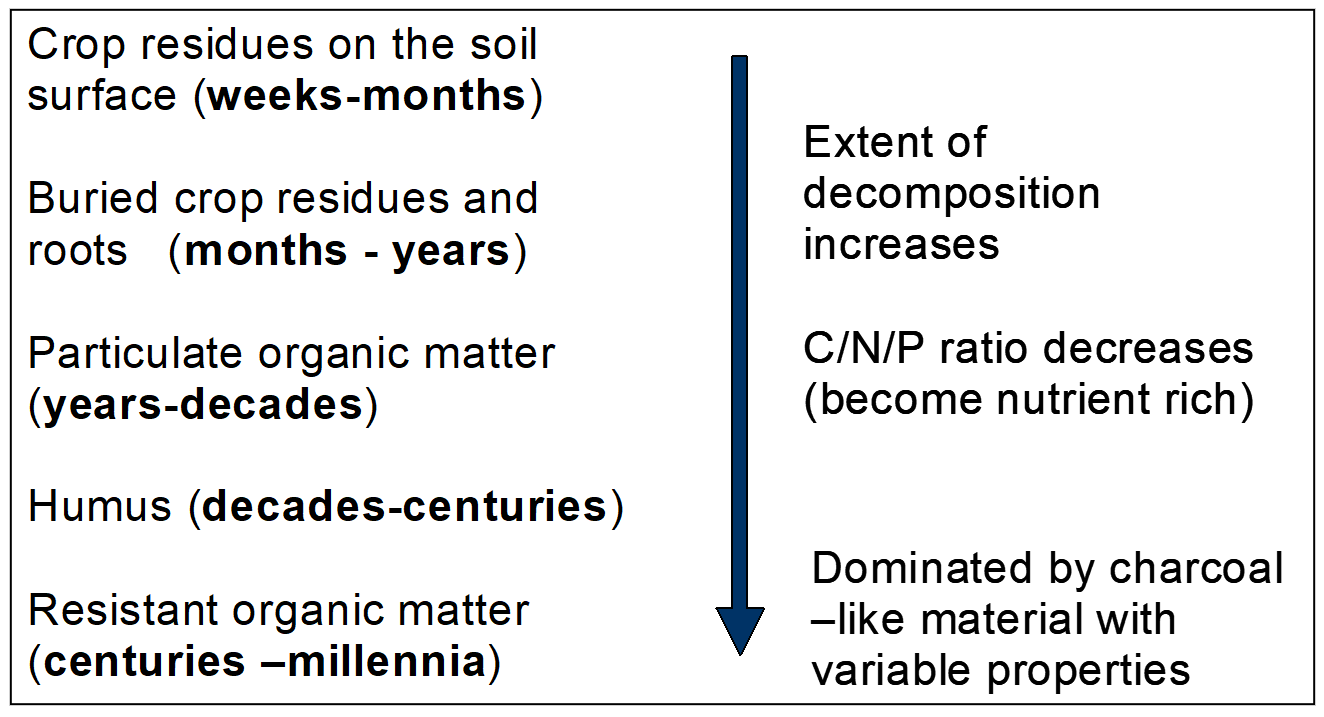
Ultimately, SOM is derived from decomposing plant material as the soil biota feed on it for energy and nutrients. Populations in the biota all wax and wane with the supply of their preferred foods and predation by other organisms. Similarly, the amount and age of different SOM/SOC ‘fractions’ will fluctuate in response to the quality and quantity of inputs (i.e. residue type and frequency of addition) and the influence of moisture and temperature on the decomposing organisms (Figure 1).
Microbial respiration during decomposition releases carbon dioxide (or methane in some conditions) and any nutrients surplus to the biota’s needs are released (mineralised) in inorganic forms for use by other microbes and plants. However, soils are generally nutrient-poor environments so as the decomposition process occurs and the organic materials age in the soil, there is generally more carbon (C) released as CO2 than there are surplus nutrients released. For example, fungi need a C:N ratio of ~8:1 (8 C atoms for every N atom) available to grow more hyphal threads, but can digest poor quality crop residue with C:N ratios up to ~100:1. As a result, surplus C is respired while the N is conserved, and the soil organic materials become increasingly nutrient rich as it ages. This enrichment of nutrients in humus and more recalcitrant/charcoal-like materials occurs especially with N and sulphur (S). The humus that eventually forms from decomposition of, say, cereal straw will have C:N ratios of approximately 12:1, rather than the 100:1 in its original form. The lower the C:N ratio of the material being decomposed (i.e., humus versus fresh cereal straw) the more likely there is to be net release of mineral N. After so many cycles of digestion and excretion, these humic materials are less readily decomposed than the initial plant residues, but the nutrients they contain ensure that they remain a valuable source of nutrients contributing to soil fertility.
Figure 1. Forms of soil organic matter and carbon and their indicative ‘half-life’ in the soil, which also indicates how long the next decomposition stage takes to form.
Benefits of soil organic matter
While SOM contains ~60% organic carbon, it is the decomposition of organic matter with its associated materials that drives most physical, chemical, and biological soil processes, supplying a range of nutrients needed by both plants and soil biota. Organic matter helps major soil functions:
(i) Physically with better structure, infiltration, and water holding capacity,
(ii) Chemically with better nutrient supplies and pH; and
(iii) Biologically by maintaining a food supply for microbes and the microbial activity that supplies available nutrients for plants and competes with pathogens.
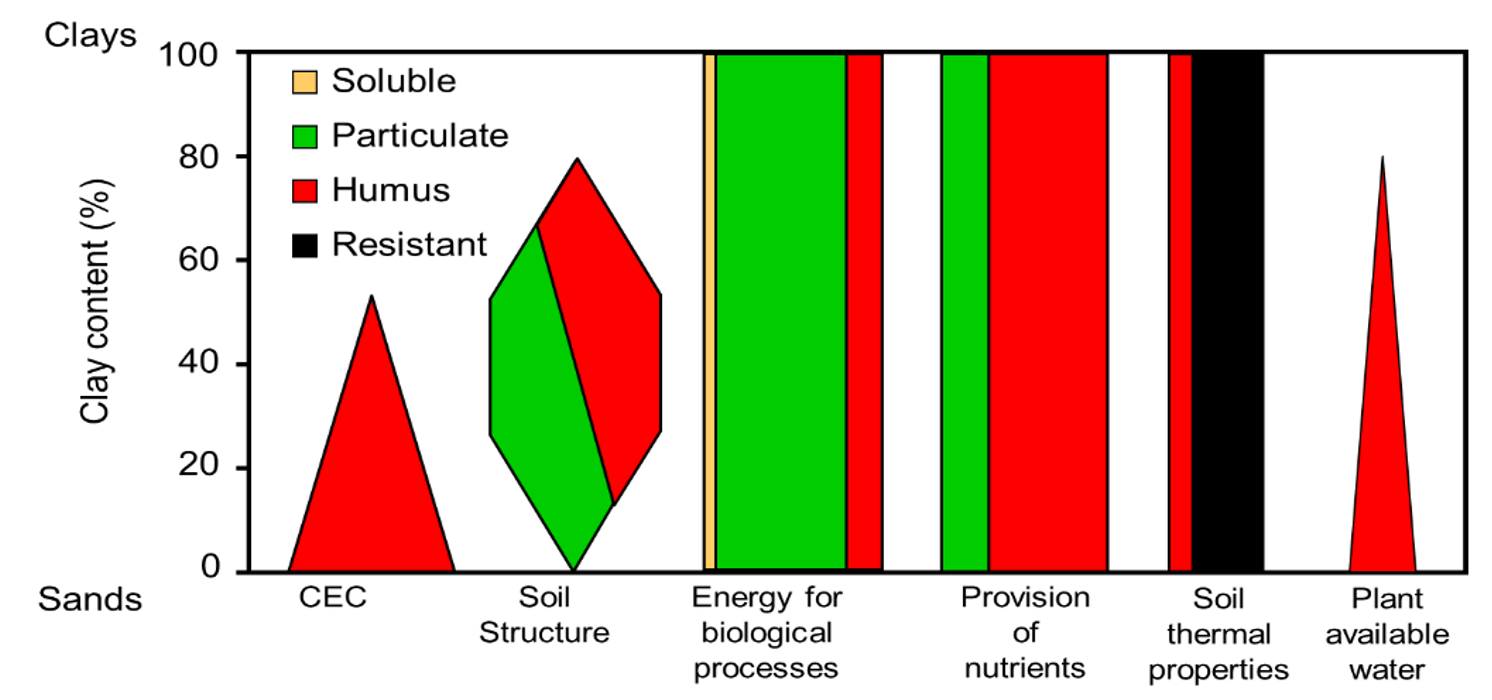
However, the impact of these functions varies with different soils and the types, or fractions, of SOC that we measure (Figure 2). The width of the lines represents the impact of soil carbon on that function, and the colour represents the fraction of the carbon that provides that function in the soil. For example, the relative contribution of organic matter/carbon to cation exchange capacity (CEC) and water holding capacity is large on sandy soils but small on heavy clays that already have high CECs and water holding capacities. Similarly, the bulk of nutrients come from the humus fraction, while the particulate fraction provides much of the energy for microbial activity.
Figure 2. The impact of soil organic carbon fractions and clay content on soil function (Hoyle et al. 2006).
What is soil organic matter really worth to grain producers?
The direct economic value is hard to quantify for many of the soil functions that organic matter supports. Yet, it’s clearly higher than the value of soil carbon alone; 1 tonne of SOC is associated with ~100 kg organic nitrogen, so when the SOC levels in the 0-10cm layer of a brigalow/belah soil decline by 1% (10-13t/ha), it means up to $1500/ha of nitrogen has been released for crops to grow on and which is no longer present in that soil. For all nutrients, including phosphorus and sulphur, this figure may be as high as $2000/ha.
These nutrients may not have been wasted as the decomposing natural organic matter reserves enabled cropping for 30+ years with little or no fertiliser. However, fertiliser use is now increasing as the supply of nitrogen and other nutrients from SOM decline, and the soils’ reserves of mineral nutrients such as phosphorus and potassium are also depleted. Profitability of production will clearly change as we need to replace more nutrients in older cropping soils.
Soil organic matter & carbon levels
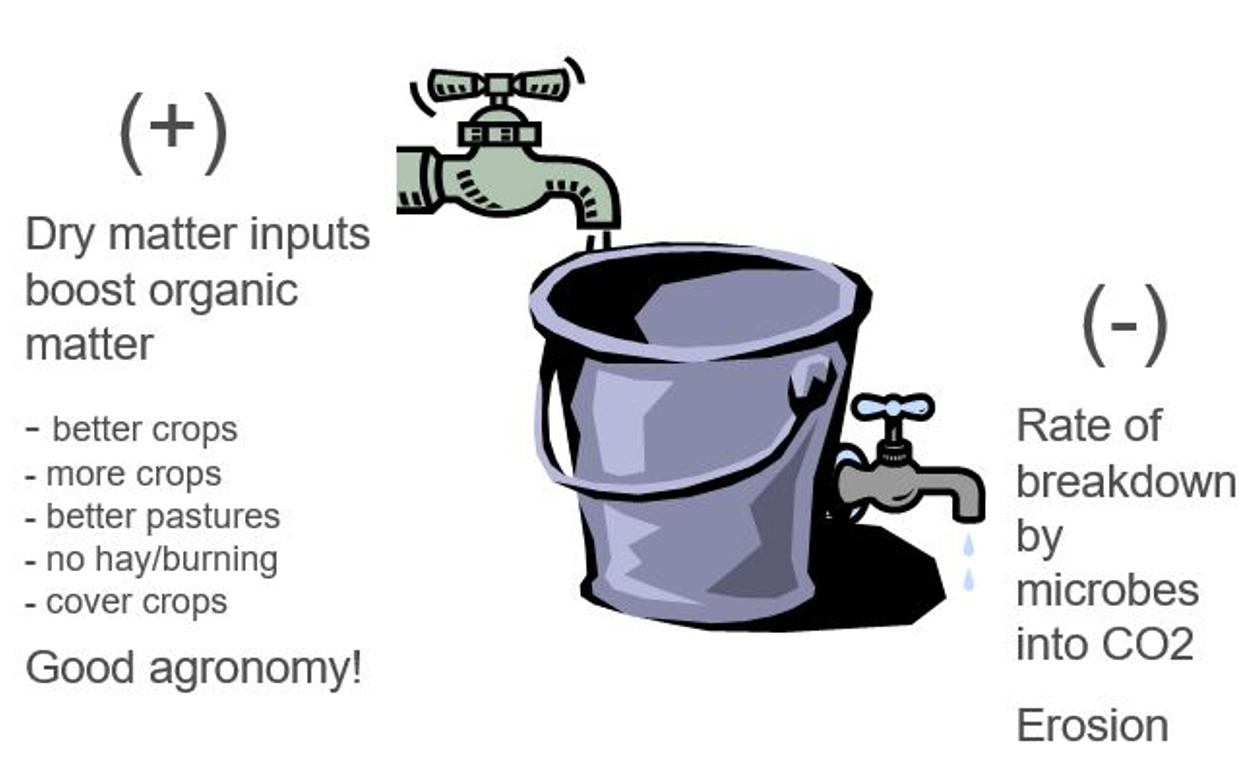
Natural organic matter levels vary with each location’s soil type, rainfall and vegetation. The SOC levels for each farming system then results from its balance between inputs (e.g., plant residues other organic inputs) and losses (e.g., erosion, decomposition, harvested material) (Figure 3).
Figure 3. Soil organic carbon levels: a balance between dry matter (organic) inputs, losses and decomposition.
Soil organic carbon levels in the northern region
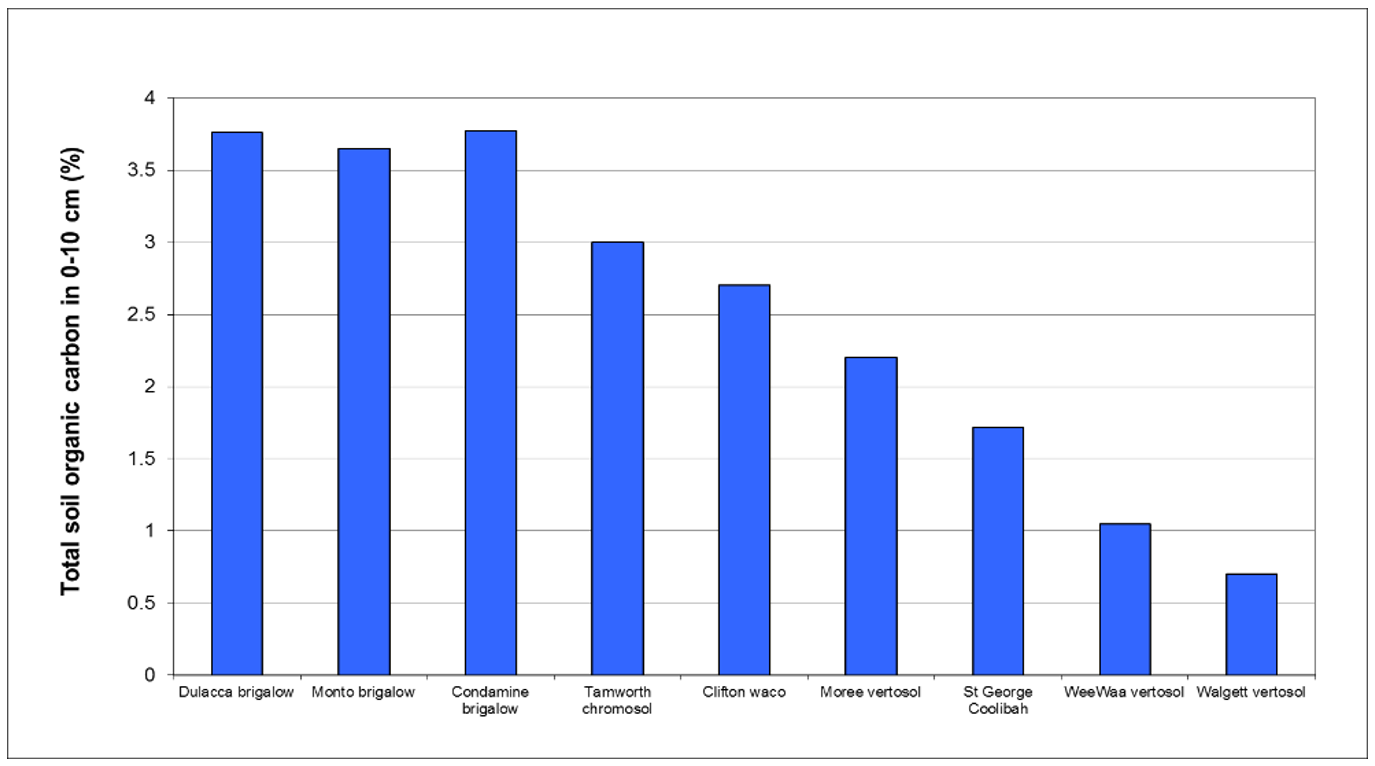
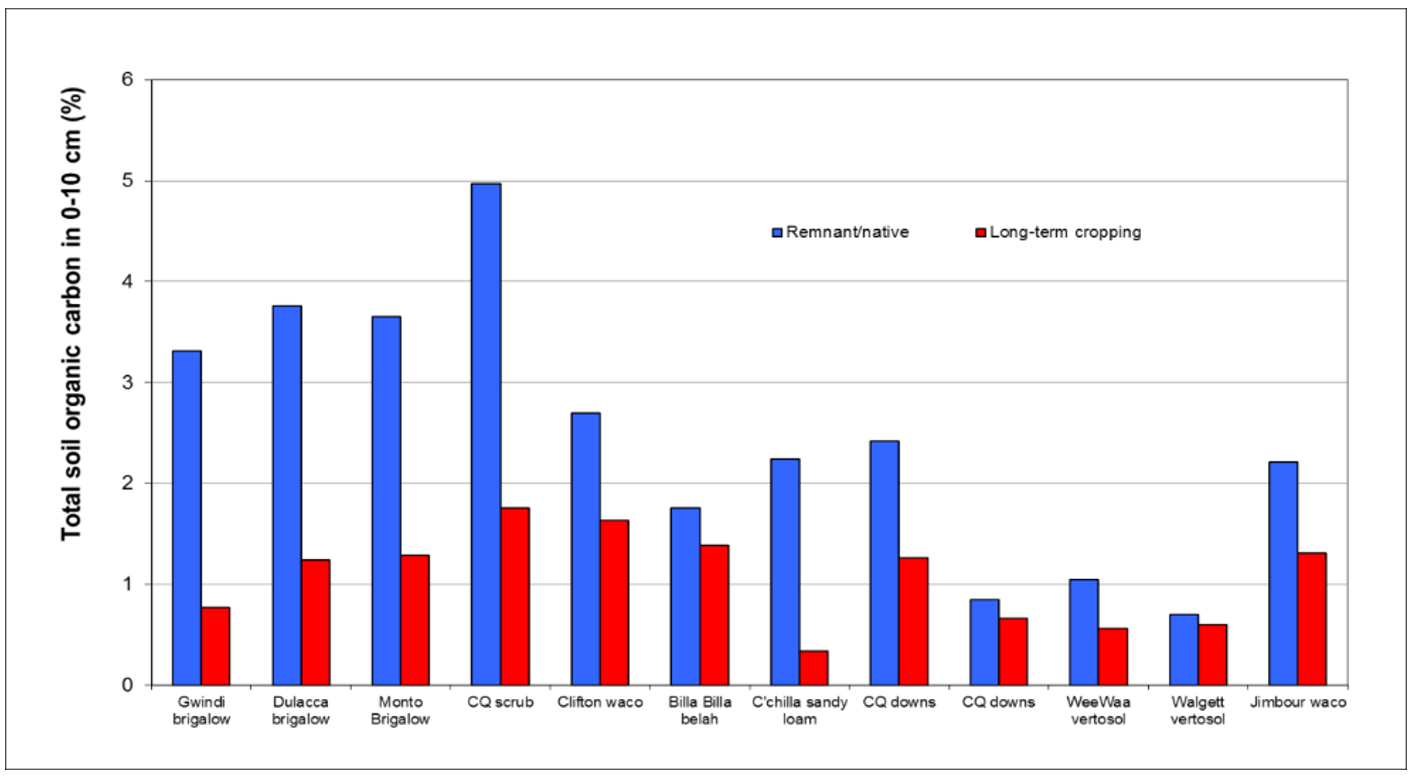
Data from 500 paired-site comparisons from 2008-2017 show the effects of land-use and farming practices on SOC levels across the northern grain region. Total Organic Carbon in the top 10 cm of the soil (TOC 0-10 cm) under remnant vegetation at selected sites varied from 0.7 at Walgett to 3.8-5.0% on brigalow soils at Condamine and Central Queensland (Figures 4 and 5). Critical levels for each soil/location are not defined because the varied functions of organic matter are difficult to match with crop productivity. Basically, more organic matter is better.
Figure 4. The impact of location/land type of soil organic carbon levels (0-10 cm) under remnant vegetation.
Declines in soil organic carbon under cropping
The most consistent land-use impact on SOC was the decline when country was cleared for long-term cultivation (Figure 5). There was a clear and dramatic impact of clearing and cultivating for 20+ years. These reductions in Total Organic Carbon (TOC) were most dramatic on the highly fertile brigalow soils in Queensland. Declines of 60-70% (i.e., >2-3% TOC) were common, representing declines in the natural nutrient capital to a depth of 30cm in these soils of up to $5000-8000/ha.
This decline under cropping is driven by fallowing to store moisture. Fallow efficiencies typically range between 20-30%, which means 70-80% of fallow rainfall is lost, mostly to evaporation. It is not transpired by plants to grow more dry matter and replenish the organic matter that continues to be decomposed by microbes in the moist soil.
Figure 5. The impact of long-term cropping (20+ years) on soil organic carbon (TOC 0-10 cm).
Pasture development also reduced SOC levels, confirming that the native vegetation (typically with trees/shrubs) produced more dry matter than cleared pastures, even if it’s not valuable as feed. The declines under pastures were less dramatic than cropping. Pastures do not have fallows and use most of their rainfall to grow dry matter that’s ultimately returned to the soil. The higher productivity of sown pastures produced higher SOC levels than native pastures in nearly all cases.
Rebuilding soil organic carbon levels with pastures
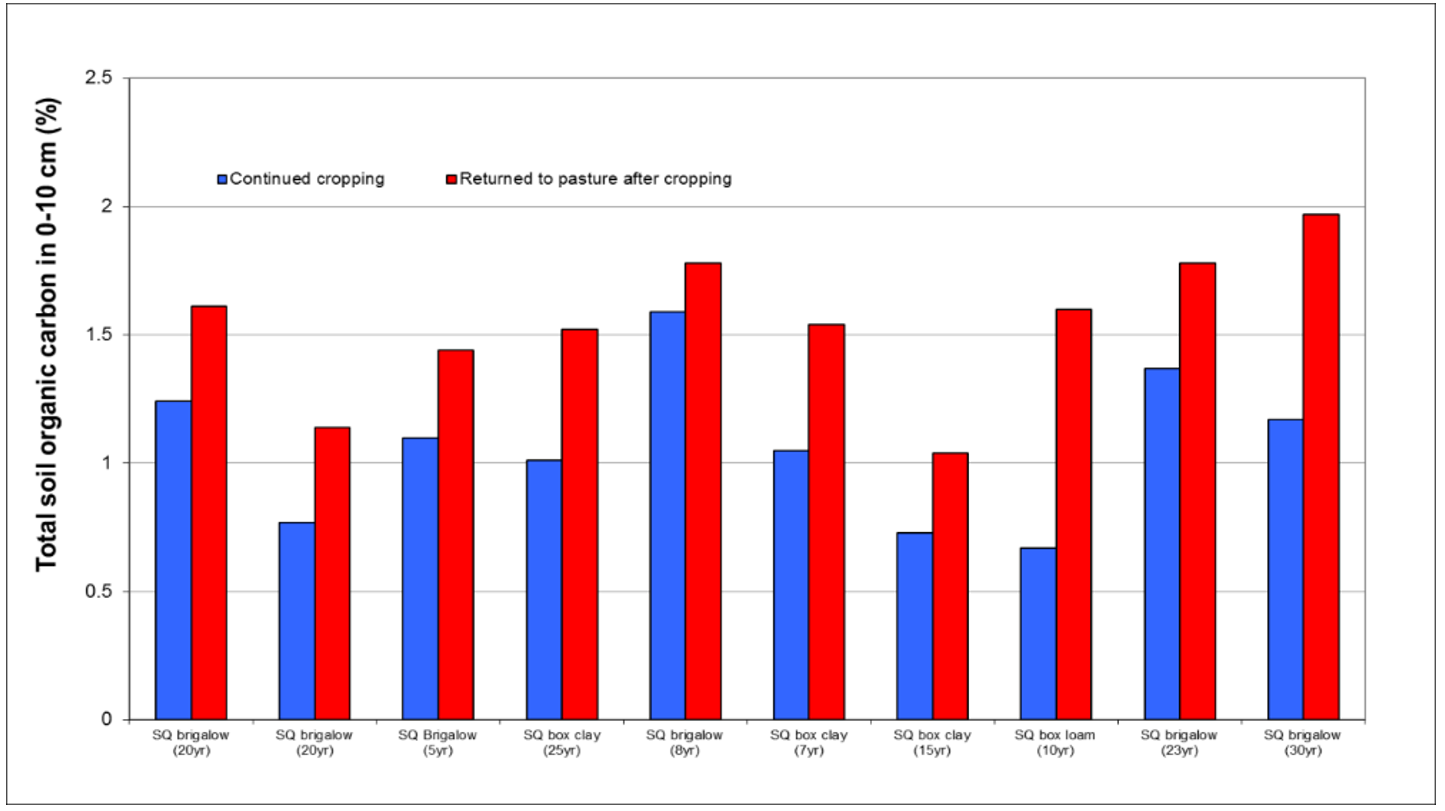
When compared to paddocks under continuous cropping, SOC levels were higher in most paddocks that had been returned to pastures for at least five years, both in the more marginal Western Downs districts (Figure 6) and the higher rainfall Darling Downs. In isolated cases the pasture paddock had a lower soil carbon level; in each case, it was confirmed that those paddocks were returned to pasture because they were not performing in the first instance (due to some confounding influence).
Figure 6. Total organic carbon comparisons for croplands resown to pasture (Western Downs).
The changes in carbon stocks showed that the difference between the paddocks that continued to be cropped and those resown to pastures could be at least 1.0t/ha/yr in well-grown pastures (Table 1). However, some pastures provided little if any increase in soil carbon stocks after many years. The determining factor appears to be the presence of legumes in the better performing pastures and their absence in the poorer performing paddocks.
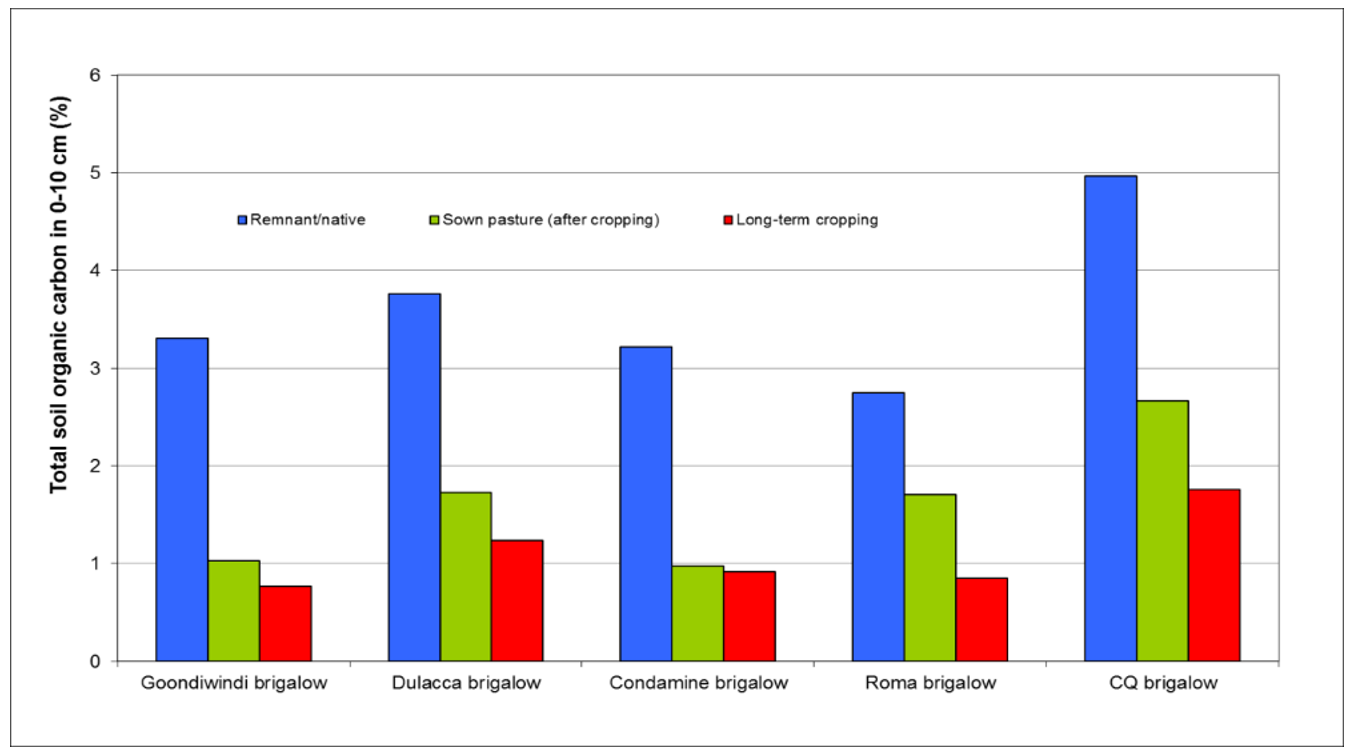
Three-way comparisons between remnant vegetation, long-term cropping and long-term cropping land returned to pastures, also revealed the variable ability of pastures to build or maintain soil carbon levels (Figure 7). Re-investigation of the soil test data suggests the recovery in soil carbon at the sites reflects the soils’ phosphorus levels and the subsequent legume growth in the pastures:
- The best performing pasture for rebuilding soil carbon stocks (Roma), had high phosphorus levels and strong legume (medic) growth which may supply an extra 30kg N/ha/yr and produce 900-1200 kg extra dry matter each year for better productivity and higher soil carbon stocks.
- In contrast, the pasture with no carbon impact (Condamine), was extremely deficient in phosphorus (3mg/kg Bicarbonate P0-10cm) and had no legume growth. This left the pasture with little dry matter production due to extreme N deficiency after a cropping phase. This pasture may never recover without remedial action and the farmer may have low dry matter levels, poor beef production and little increase in soil carbon stocks for the foreseeable future.
This insight on the importance of soil phosphorus had a major impact on the participants in the projects. It was the catalyst for many of the mixed farmers developing strategies to maintain soil phosphorus levels on their cropping country for bigger and better crops and yields and to maintain the flexibility to use pastures to rebuild soil carbon and soil health levels into the future if need be.
Table 1. Examples of the change in carbon stocks when cropland was returned to pastures.
Location | Soil/vegetation | Time in crop | Time in pasture | Carbon stocks (t/ha) | ∆ Carbon |
|---|---|---|---|---|---|
Samples to 30cm (0-10cm + 10-30cm) using conservative bulk densities of 0-10: 1.25 & 10-30: 1.3 | |||||
McCallister | Waco clay | 60 50 | 0 10 (native grass) | 44 54 | +1 t/ha/yr |
Jandowae | Brigalow clay | 40+ (baled) 40+ | 0 40 (sown grass) | 49 63 | +0.4 t/ha/yr |
Nindigully | Red box loam | 40 30 | 0 10 (sown grass) | 28 31 | +0.3 t/ha/yr |
Nindigully | Coolibah clay | 25-30 25-30 | 0 10 (sown grass) | 17 21 | +0.4 t/ha/yr |
Samples to 10cm only using conservative bulk densities of 0-10: 1.25 | |||||
Warra | Brigalow clay | 45 35 | 0 10 (sown grass/medic) | 12 17 | +0.5 t/ha/yr |
Glenmorgan | Box wilga loam | 25 15 | 0 10 (sown grass/medic) | 8 20 | +1.2 t/ha/yr |
Condamine | Brigalow belah clay | 40 30 | 0 10 (sown grass/medic) | 15 25 | +1 t/ha/yr |
Talwood | Red clay | 40 40 | 0 7 (sown grass/medic) | 13 19 | +0.9 t/ha/yr |
Talwood | Brigalow clay | 15 15 | 0 3 (sown grass) | 14 18 | +1.3 t/ha/yr |
Talwood | Grey Clay | 25 15 | 0 10 (sown grass) | 9 13 | +0.4 t/ha/yr |
Goondiwindi | Brigalow belah clay | 30 30 | 0 20 (sown grass) | 16 20 | +0.2 t/ha/yr |
Condamine | Belah wilga clay | 35 20 | 0 15 (native grass) | 12 12 | +0 t/ha/yr |
Figure 7. Three-way comparisons of the soil carbon impacts of cropping and resowing pastures.
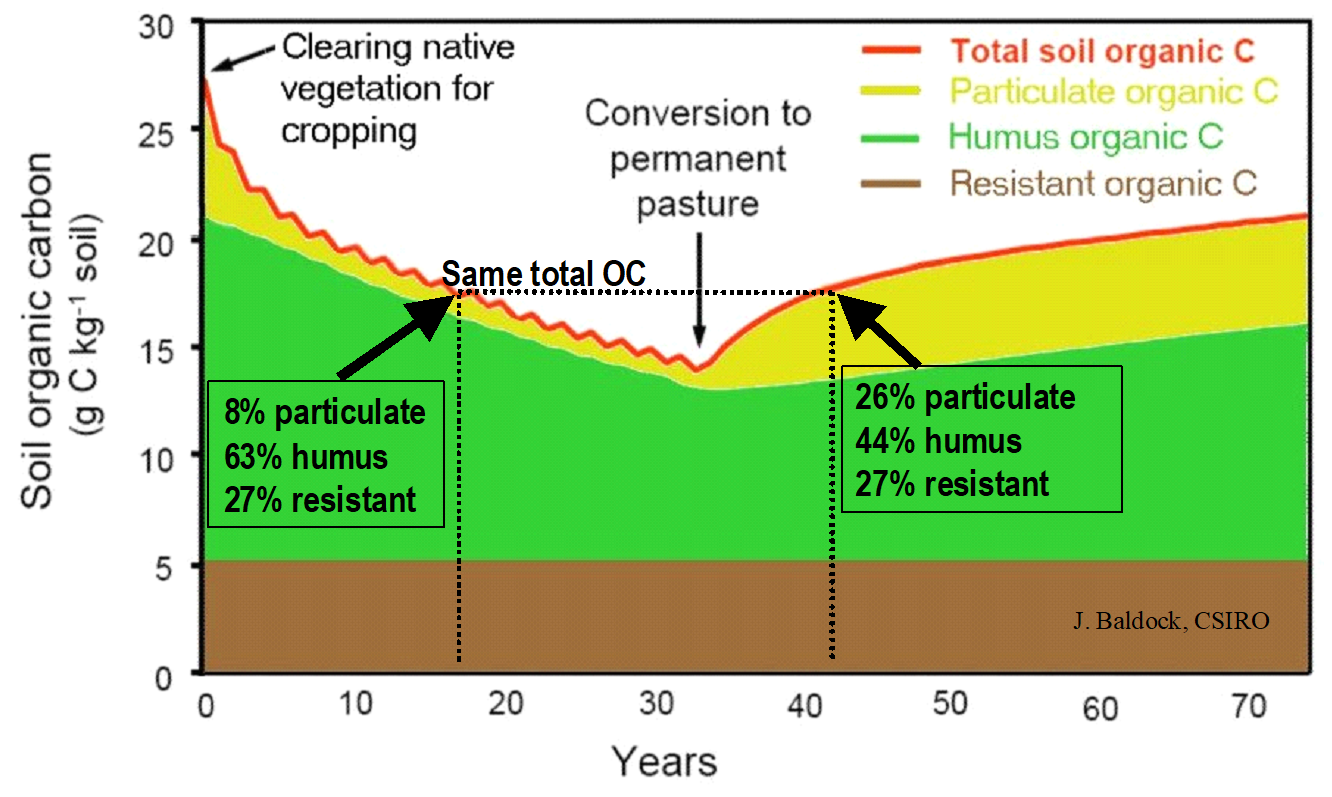
A final consideration for growers that do use pasture phases to rebuild their SOM and SOC levels is how long it takes for more stable forms such as humus to develop? The half-life of particulate carbon indicates that humus takes ‘years to decades’ to form (Figure 1). This means a 5-to-10-year pasture phase will primarily increase the more easily decomposed (labile) particulate carbon with much less nutrient rich humus than the remnant vegetation had over centuries. The rebuilt SOM and SOC levels will break down much faster when returned to cropping than when the country was initially developed (Figure 8) and will require careful management with high productivity to maintain.
Figure 8. An illustration of changes in the soil organic carbon fractions under development for cropping and a subsequent return to pastures (Hoyle et al 2006).
Rebuilding soil organic carbon levels in crop soils
While mixed farmers may be able to use pasture phases to manage their soil carbon levels, most grain farmers were interested in options for their permanent cropping paddocks. A range of agronomic practices were assessed in the paired-site comparisons for their impacts on SOC. The impacts of these different agronomic practices were minor at best and appeared to be overwhelmed by the effect of fallowing:
- Crop choice: Crops with different levels of dry matter (e.g., cotton vs grain) showed minor differences, reinforcing the overall impact of a prolonged fallow in northern farming systems. This re-assured some cotton growers who worried that cotton farming systems were further degrading their soils. Systems with increased use of legumes also had no clear impact on SOC.
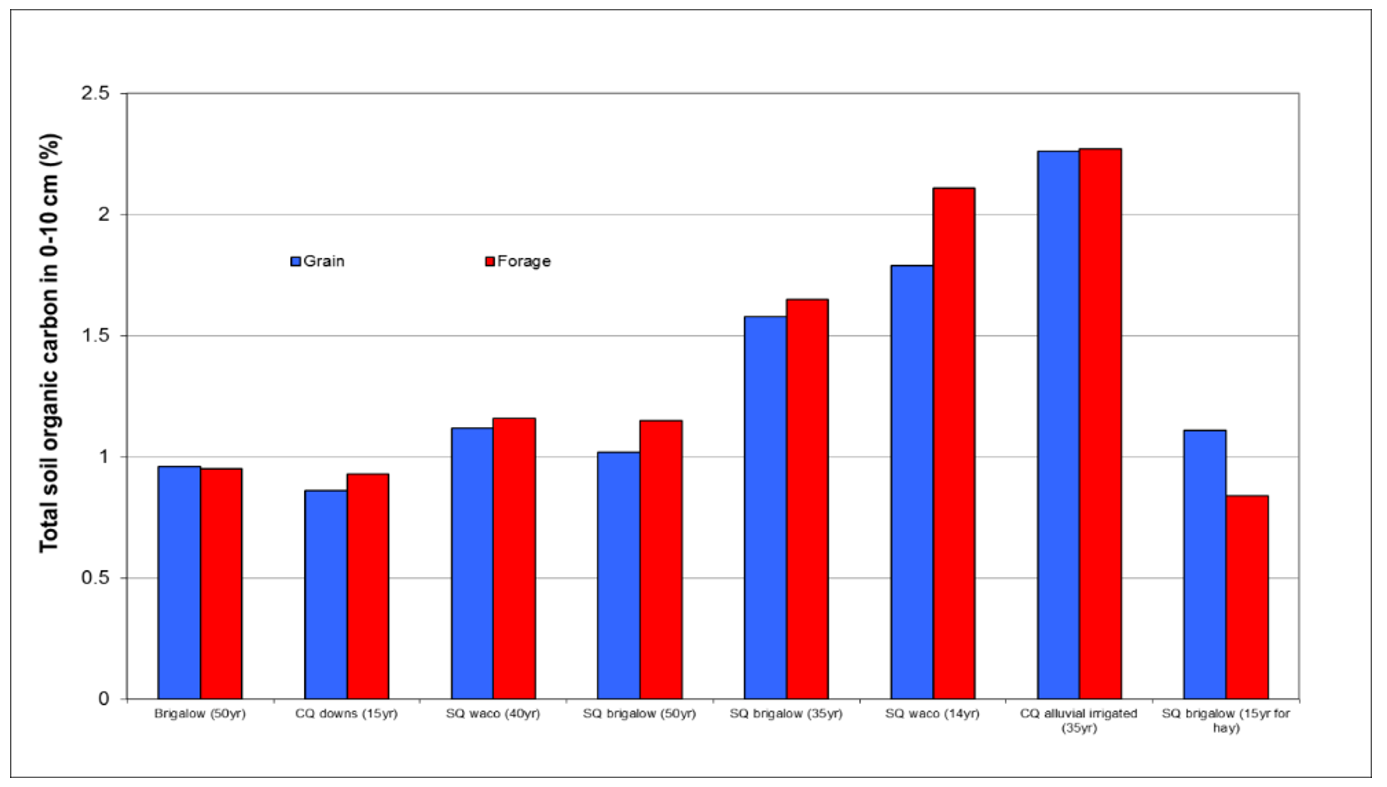
- Forage crops: Forages have potential to produce more dry matter and maintain higher SOC levels than grain crops (Figure 9). However, the differences were minor at best, perhaps because many forage crops under-perform on poorer soils with less management and fertilisers and stock redistribute some residues via manure around watering points and shade lines.
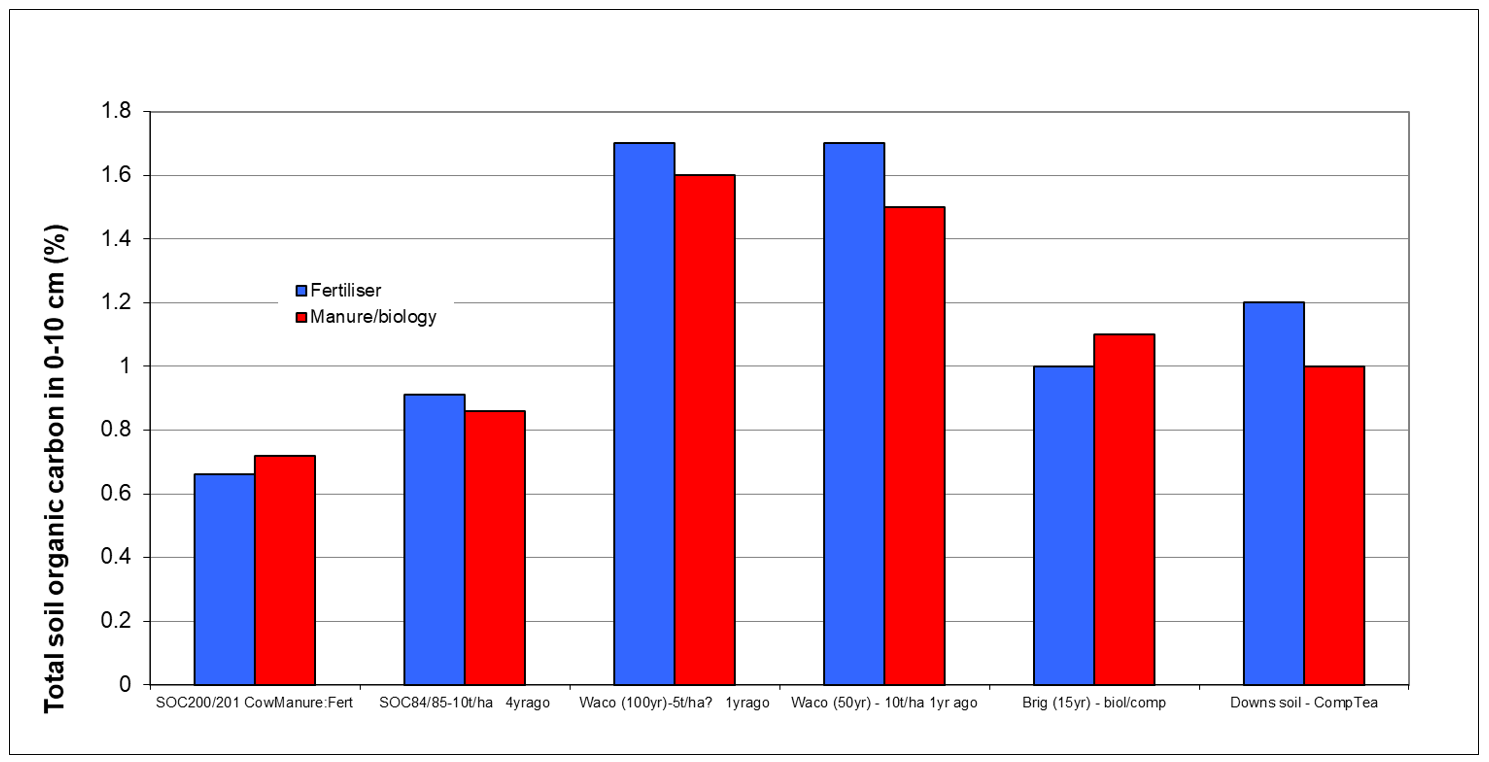
- Manures: It is logical for grain-only producers to think that manures add dry matter and must at some level increase SOC. However, the SOC levels showed no real benefit from the relatively low commercially used rates (typically to supply phosphorus) and the rapid breakdown of their labile carbon in manures (Figure 10). No comparisons of repeated use of heavy manure rates were available on crop land, as farmers with feedlots spread manure on all their cropping paddocks. In some cases, SOC levels declined where manures and other biological products were used, perhaps due to people reducing the overall amount of nutrients being added. The key insight was to ensure that crop nutrient needs are met, and that compost teas and other products alone are not going to overcome nutrient deficiencies.
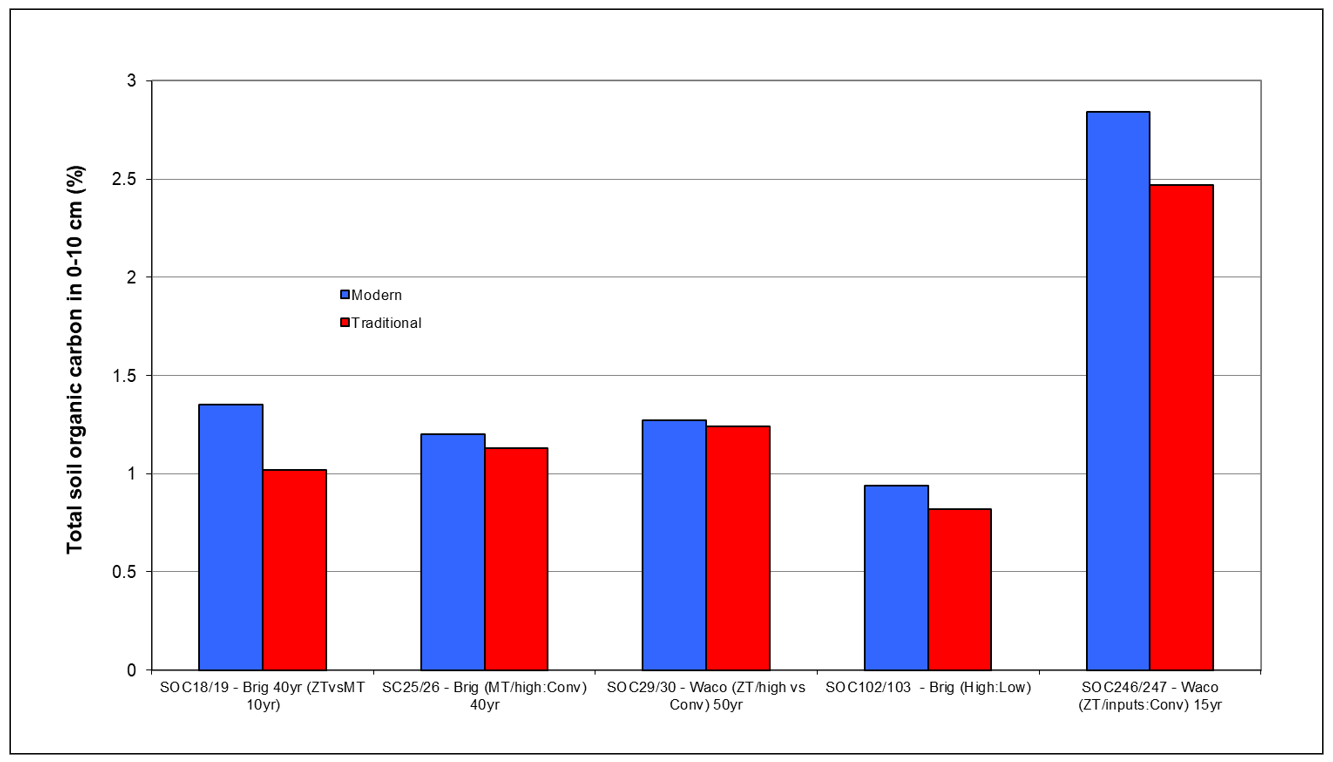
- Best modern practices: Modern farming systems with zero/reduced tillage and high nutrient replacement rates were compared to more traditional management practices. As farmers tend to change practices such as use of tillage and nutritional strategy across their whole farm, the project was unable to locate separate comparisons of different tillage practices and of high nutrient applications on paired paddocks. The data suggests potential for a small impact of modern practices on maintaining SOC levels, which requires further monitoring to confirm (Figure 11).
Figure 9. Total organic carbon levels under long-term grain and forage cropping.
Figure 10. Total organic carbon levels under traditional fertiliser and manure/biological systems.
Figure 11. Total organic carbon levels under modern (less tillage, more fertiliser) systems compared to more traditional systems.
Implications
Long-term grain production clearly reduces soil organic carbon (and hence organic matter) levels. On well-structured soil this decline and the subsequent loss of soil nutrients such as nitrogen, may be managed by increased rates of fertiliser. However, management will need to be ‘spot-on’ as the soil will become less resilient and less able to respond to seasonal changes. These soils will also be more prone to disease, so again, good agronomy and timely management will become increasingly important.
For grain-only producers, strategies to maintain soil organic carbon will need to focus on using the best possible agronomy to grow the best crops, with as much dry matter as possible, as often as possible; balanced with the need for each crop to be profitable. Cover crops and companion cropping that seek to produce more on the same land by making greater use of rain may also offer some small improvements in soil organic matter and carbon.
Mixed farmers who have the option of prolonged pasture phases, have much greater potential to rebuild and manage their soil organic matter and carbon levels than grain-only farmers. The best results for rebuilding soil organic matter and carbon will be from growing the best, most productive, and profitable pastures for livestock. Positive results will require both a good supply of nitrogen from fertiliser and/or legumes with an adequate phosphorus supply for good legume growth to support high levels of pasture dry matter production.
Ultimately, any practice that increases the return of dry matter from stubble and roots will help maintain, or at the very least, slow the decline of soil organic matter and carbon levels in our cropping lands. This includes using zero/reduced tillage to maximise water capture and grow more crops and better higher yielding crops with adequate nutrition to meet their full potential; considering cover crops and companion crops if they can increase dry matter production without compromising grain yields; avoiding burning and baling that removes dry matter and nutrients from the paddock; and using pasture phases where practical. Introducing the best ‘profitable’ practices as soon as possible, not waiting until soils suffer major declines will be important, both in younger country and to prolong the gains after pasture phases that are used to rebuild SOM and SOC.
References
Hoyle, FC, Baldock, JA & Murphy, DV (2011) Soil Organic Carbon – Role in Rainfed Farming Systems In, P. Tow et al. (eds.), Rainfed Farming Systems, Springer
Acknowledgements
The research undertaken as part of this project is made possible by the significant contributions of growers through both trial cooperation and the past financial support of the GRDC, Land & Water Australia and the Australian Department of Agriculture, Water, and the Environment; the authors would like to thank them for their continued support.
Contact details
David Lawrence
Queensland Department of Agriculture & Fisheries
PO Box 102 (203 Tor Street), Toowoomba, 4350
Ph: 0429 001 759
Email: david.lawrence@daf.qld.gov.au

