Farming Systems Research Update – Trangie the first five years (grain production, soil water, soil nitrogen, diseases)
Author: Greg Brooke & Kathi Hertel, NSW DPI, Trangie | Date: 28 Feb 2021
Take home messages
- The first five years (2016 to 2020) of experimental work on both hard setting red loams and heavy grey vertosols at Trangie have shown soil type to be a major contributor to systems performance.
- The red soil site has given more consistent productivity and achieved higher cumulative grain yields than the grey soil site.
- The Lower intensity system (long fallow) has provided a lower risk strategy than continuous cropping in the years 2016–2018 due to drought.
- Lucerne dry matter production has been higher on the red soil compared with the grey soil. It is showing significant benefits in reducing some important soil borne diseases.
- Soil water is a major driver of crop performance in low rainfall areas. However, the red soil, despite having inherently lower soil water holding capacity and less plant available water than the grey soil site, has achieved more reliable crop yields particularly in low rainfall seasons.
Research questions
- Can systems performance be improved by modifying farming systems in the northern grains region?
- What are the trends that are expected in our farming systems?
- How will these changes impact on the performance and status of our farming systems?
Site history and characteristics
Trangie Agricultural Research Centre (TARC) is situated within the lower Macquarie Valley of the central west slopes and plains of NSW, 80 km NW of Dubbo NSW on the Mitchell Highway. Rainfall (average annual rainfall: 492 mm) is variable and classified as non-seasonal (historically slightly less rain in winter than summer).
Soils vary from heavy grey cracking clays to sandy loams, with many of the grey and red brown earths being calcic (relatively rich in calcium). The red soils are by nature very hard setting.
Agricultural enterprises include livestock and crops (wheat dominant, followed by barley, canola and chickpea with limited area of field pea, faba bean and lupin). Irrigation water is primarily reserved for cotton.
Controlled traffic, minimum till and continuous cropping systems were adopted extensively in the region during the late 1990’s to mid-2000’s when cropping was comparatively more profitable than livestock enterprises. Fertiliser (phosphorus and nitrogen) use during this time was higher than current. Due to drought and comparatively safer returns from livestock, livestock and mixed farming enterprises have seen a resurgence. Difficult to control weeds such as windmill grass have partly necessitated a return to cultivation.
Baling of cereal crop residues has become more common practice as a livestock feed source, drought reserve and also to reduce excessive straw without the need for burning or cultivation.
Lucerne has been a very important part of mixed farming enterprises due to its suitability in a phase farming system and adaptation to red soils, being able to extract more soil water than annual crops. Mixed enterprises often utilise dryland lucerne as a grazing option in their crop rotations and often also graze stubble paddocks during dry periods.
It has not been clearly understood how effective lucerne is by comparison with annual break crops in reducing important soil borne diseases and pathogens, however results from this project show some suppression of several key crop diseases.
Low-input pastures consist of native grasses and herbs with introduced naturalised species such as medics and barley grass. Little if any fertiliser or herbicide is ever applied.
Major weeds present in dryland cropping paddocks include annual ryegrass, wild oats, sow thistle, spiny emex, fleabane, windmill grass and medics. Group A herbicide resistance is becoming widespread in populations of annual ryegrass, wild oats and to a lesser extent Group B resistance in several brassica weeds.
Two farming systems sites are located at TARC, established in August 2015. One on a hard-setting red and a sister site on a grey-cracking clay. The two experimental sites are 2.3 km apart (Figure 1). The red soil site was traditionally used for dryland winter cropping and grazing, and the grey soil site was used for irrigated (flood) pasture production and crop (from the mid-1970’s). Both sites had a long history of traditional tillage practices.
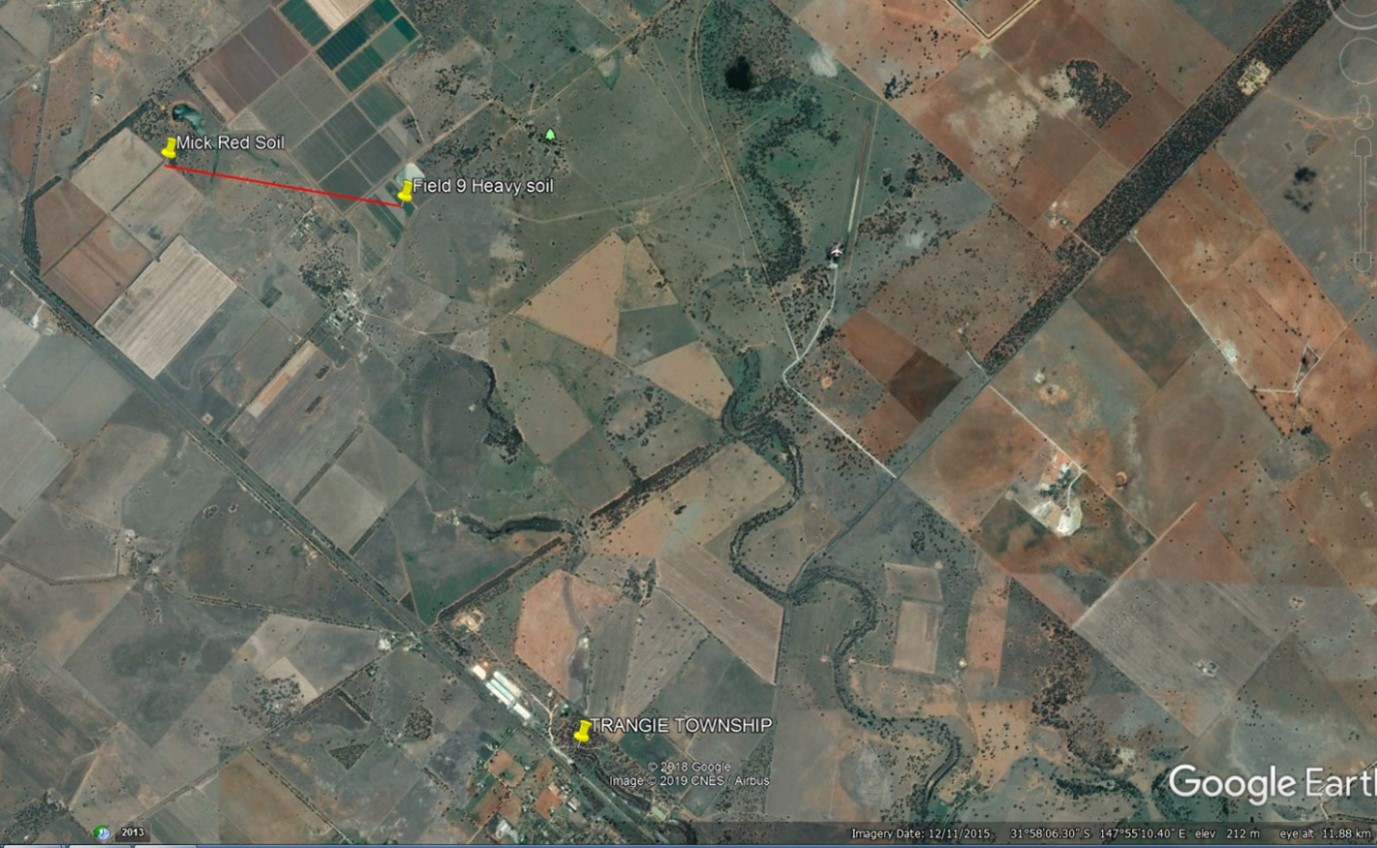
Figure 1. Red and grey soil farming system sites on TARC (proximal distance 2.3 km)
Red soil description
This experimental site is on a red hard-setting loam. The site has moderate background fertility levels and no subsoil constraints (Table 1). Phosphorus levels are considered moderate for the red soils of this region at 29 mg/kg Colwell P. These soils respond well to applied P fertiliser and crops grow poorly without P application.
The plant available water holding capacity (PAWC) calculated at the site is 141 mm for wheat to a depth of 150 cm (Source: APSIM #683).
Organic carbon is low (1%) and pHCa is borderline acidic in the surface layers but increases to being closer to neutral at the 30–60 cm layer.
Table 1. Red soil characteristics
Depth | Colwell-P | BSES-P | Colwell-K | Sulphur | Organic carbon | pH | Bulk density | Crop Lower limit |
|---|---|---|---|---|---|---|---|---|
0–10 | 29 | 53 | 427 | 7.3 | 1.0 | 5.3 | 1.58 | 0.07 |
10–30 | 9 | 15 | 268 | 1.4 | 0.4 | 6.0 | 1.61 | 0.16 |
30–60 | - | - | - | 1 | - | 6.7 | 1.6 | 0.23 |
60–90 | - | - | - | 1 | - | 6.9 | 1.64 | 0.22 |
90–120 | - | - | - | 1.2 | - | 6.9 | 1.64 | 0.21 |
Grey soil description
The grey soil is a vertosol locally known as a ’Myall grey‘. Phosphorus levels are high in the surface layers (Table 2). Organic carbon is moderate at 1.5%. The site has a calculated PAWC of 192 mm to 150cm (Source: APSIM).
Table 2. Grey soil characteristics
Depth | Colwell-P | BSES-P | Colwell-K | Sulphur | Organic carbon | pH | Bulk density | Crop Lower limit |
|---|---|---|---|---|---|---|---|---|
0–10 | 50 | 62.1 | 506 | 10 | 1.48 | 7.6 | 1.42 | 0.21 |
10–30 | 6.3 | 9.9 | 235 | 16 | 0.70 | 7.7 | 1.47 | 0.21 |
30–60 | - | - | - | - | - | 8.1 | 1.35 | 0.21 |
60–90 | - | - | - | - | - | 8.1 | 1.42 | 0.25 |
90–120 | - | - | - | - | - | 8.1 | 1.42 | 0.24 |
Project design and treatments
Trangie is the most southern site in this project and system water trigger planting rules were moderated to fit in with the Trangie 50:50 summer:winter rainfall split and winter rainfall being typically more than northern sites. Some reliance on expected in-crop rainfall is accepted and less dependence on the ‘planting water triggers’ approach.
Reference group members agreed a 30 percent soil water profile is adequate for planting winter crops in a moderate intensity system.
Experimental treatments include:
- 4 replicates
- Large plots. 5 × 2 m seeder passes 24 m in length giving an effective plot area of 24m × 10 m
- Knife point/press-wheel seeding
- Stubble retention
- Nil burning or routine cultivation
- Nitrogen applied as urea 50% at sowing, 50% top-dress
- All sown crop plots fertilised annually with 70 kg/ha Granulock® 12 Z Extra.
- Varieties used to date: LRPB_Spitfire wheat, Sunmax wheat, LRPB_Lancer wheat, LaTrobe barley, PBA_Seamer chickpea, PBA_Wharton field pea, Titan 7 lucerne, PBA_Warda faba bean.
Six systems from the core set of systems have been implemented at Trangie.
- Baseline. The Baseline system was designed to represent a standard dryland cropping system for the central western plains. The area is winter dominant with the four main crops in sequence being wheat, canola, barley and chickpea. The typical crop sowing window for Trangie is from very late April until late May. Back to back wheat e.g. two wheat crops in consecutive years is also common district practice.
- Higher nutrient. This system aims to provide artificial nitrogen targeting a 90th percentile season but matched to sowing date and PAW at sowing. Fertiliser is applied for a higher yield target than the Baseline (i.e.90% of seasonal yield potential for nitrogen compared to 50th percentile in the Baseline system). Crop choice is determined by the Baseline system so that the two treatments can be compared.
- Higher legume. The Higher legume system focuses on soil fertility and reducing the amount of nitrogen input required through fertiliser (50% of seasonal yield potential for nitrogen and 100% replacement of phosphorus). One in every two crops is a legume and the suite of crops include: wheat, chickpea, field pea, barley, lupins and faba bean.
- Higher diversity. This system investigates an increase in alternative crop options to help manage and reduce soil pathogens, disease and herbicide resistance. A wider range of crops may enable growers to maintain soil health and sustainability as the age of their cropping lands increase. Crop options for this system include wheat, barley, chickpeas, sorghum, canola, mustard, lupins, field pea, fababean and mungbeans.
- Lower crop intensity - This Lower intensity (grain only) system is designed to plant at a lower frequency when the profile is at least three-quarters full. The rotation includes wheat, barley, chickpeas, sorghum or mungbean and the option of a cover crop. Sorghum and mungbeans have been included as options to enable a summer cropping opportunity (more applicable to the grey soil site).
- Ley pasture - The Ley pasture system involving chiefly lucerne is a common regional system comprising 3 to 4 years of lucerne pasture which is grazed, followed by 3 to 4 years of non-legume winter crops on a rotational basis. This system was estimated by local agronomists to be important to approximately 30–40% of farmers. Crops would include wheat, canola and barley but generally no pulses. The dedicated 3 to 4 year phase break from crops will also provide a comparison with annual break crops and their effect on soil pathogens, nitrogen, weeds and soil water.
The same experiment design and farming systems crop choices were applied to both sites allowing for comparison between soil types from 2016 to 2019. After this time systems diverged between sites.
Seasonal conditions and implications on farming systems treatments
Late seasonal breaks (sowing rainfall) have significantly influenced crop sowing time and species selection in systems treatments (Table 3)
Table 3. Monthly rainfall at Trangie Agricultural Research Centre 2016 to 18 May 2021
Year | Jan | Feb | Mar | Apr | May | Jun | Jul | Aug | Sept | Oct | Nov | Dec | Annual |
|---|---|---|---|---|---|---|---|---|---|---|---|---|---|
2021 | 38.8 | 135.8 | 200.4 | 0.6 | 375.6* | ||||||||
2020 | 5.4 | 96.4 | 113.4 | 117.6 | 18 | 16.4 | 68.2 | 38.4 | 40 | 28.8 | 11.6 | 76.8 | 631 |
2019 | 58 | 16.8 | 17.6 | 0 | 18.6 | 5.8 | 9.8 | 3.2 | 5.4 | 2.2 | 20.2 | 2.4 | 160 |
2018 | 26.2 | 13 | 7.8 | 3.0 | 14.2 | 27.2 | 0.8 | 23.8 | 9.2 | 59 | 50 | 28.8 | 263 |
2017 | 20.4 | 0.0 | 86.2 | 3.6 | 12.4 | 9.0 | 4.8 | 19 | 5.2 | 90 | 11.4 | 87.6 | 349.6 |
2016 | 86.0 | 2.6 | 7.0 | 39.0 | 41.4 | 142.0 | 59.6 | 62.8 | 131.6 | 54.2 | 23.6 | 101.2 | 751 |
Mean | 53.3 | 50.4 | 46.9 | 40 | 36.9 | 37.5 | 34.7 | 32.1 | 32.4 | 44.7 | 45 | 42.3 | 492.9 |
In 2016 due to both paddocks being bare from cultivation it was decided to sow 5 of the 6 system treatments with wheat (LRPB Spitfire) to bring all systems plots into line with a common background stubble level to springboard future treatments. The exception was the Ley pasture system which was direct sown with 4 kg/ha Titan 7
lucerne.
In 2017 autumn was very dry and an overhead irrigation of 2 × 15 mm was implemented to provide a sowing opportunity in late May. This mimicked other storm activity in the local area. Late May was too late for sowing canola, so wheat was sown in the Baseline and Higher nutrient systems and chickpeas were selected for the Higher legume and Higher intensity and Higher diversity systems. The Lower intensity system was left in fallow during the summer of 2016 until sowing of 2018.
In 2018 the decision was made to NOT augment sowing opportunities with irrigation as the seasonal outlook was for drought and if a planting rain did not eventuate the site would be ’parked’ for the season. On the heavy soil this would possibly have given options for summer crop on some systems on these better PAW soils.
In 2018 the first effective sowing rain for 2018 was not until 28 June when 20.2 mm was received. This allowed the red soil site to be sown on the 3 July (field peas and barley) and establish quite well but was insufficient to establish the heavy soil well. Residual ground cover was low after both chickpeas and winter fallow and early plant establishment and vigour were impeded. The late sowing opportunity in 2018 saw widespread local sowing activity also.
2019 was again a very dry autumn and drought season. The grey soil site was left fallow for the year however the red soil site was sown to canola, wheat and field peas as shown in figure 4 below.
2020 was a much better season with substantial autumn rainfall and close to average in crop rainfall.
Crop sequences on the two sites are shown in Tables 4 and 5.
Table 4. Red soil farming systems and species selection
| 2016 | 2017 | 2018 | 2019 | 2020 | 2021 |
|---|---|---|---|---|---|---|
Baseline | wheat | wheat | barley | canola | wheat | barley |
Higher nutrient | wheat | wheat | barley | canola | wheat | barley |
Higher legume | wheat | chickpea | barley | fieldpea | wheat | chickpea |
Higher diversity | wheat | chickpea | fieldpea | wheat | canola | barley |
Lower intensity | wheat | fallow | barley | fallow | canola | wheat |
Ley pasture | lucerne | lucerne | lucerne | fallow | wheat | canola |
Table 5. Grey soil farming systems and species selection
System | 2016 | 2017 | 2018 | 2019 | 2020 | 2021 |
|---|---|---|---|---|---|---|
Baseline | wheat | wheat | barley | fallow | canola | wheat |
Higher nutrient | wheat | wheat | barley | fallow | canola | wheat |
Higher legume | wheat | chickpea | barley | fallow | faba bean | wheat |
Higher diversity | wheat | chickpea | field pea | fallow | wheat | canola |
Lower intensity | wheat | fallow | barley | fallow | canola | wheat |
Ley pasture | lucerne | lucerne | fallow | fallow | wheat | canola |
Results
In 2016, the first year of the experimental program at Trangie being a ‘wet year’ (750 mm total) the red soil site out yielded the grey soil yield mainly due to the grey soil being waterlogged mid-season.
In 2017 (a very dry year with only 350 mm total rainfall) the grey soil site had higher yields due to good establishment and better PAW.
In 2018 (a drought year with only 263 mm) following minimal sowing rain of 20 mm the red soil site outperformed the grey soil by allowing quicker, more even plant establishment and early growth. This was despite having approximately half the PAW (50 mm vs 100 mm PAW). On the grey soil a dry soil band from 15 cm to 30 cm was present all season until October and plant roots could not access deeper moisture. This resulted in total failure of the field peas and almost complete failure of barley in four systems. The systems that previously had a greater cereal presence in the previous two years held more soil moisture for longer in the seeding band and these plots established better than those that followed 2017 chickpeas which had less groundcover.
Lucerne performed very well on the red soil but not nearly so well on the grey soil. Soil cracking on the grey soil in summer caused an early decline in plant numbers and stand failure within two years. Over three years, lucerne on the red soil produced a total of 15,200 kg DM/ha. This lucerne was chemically removed in August 2019 with a follow up scarifying to remove stock compaction in February 2020.
Soil nitrogen dynamics
The Higher nutrient and Lower intensity systems have a higher target yield than other systems and are fertilised to achieve maximum yield for a 90th percentile season but with consideration to species choice, sowing date and PAW. Crop yields for different N demanding species from a given sowing date have been modelled by Jeremy Whish (CSIRO) and are used to calculate artificial N inputs.
Red soil. The Higher nutrient system on the red soil (Figure 2) shows a relatively higher background N level at several points over the five years of the project. In effect this has provided excess N supply for this system relative to other systems. On the red soil site this has translated to higher grain yields and grain protein in all years compared with the Baseline system. Importantly this has not led to a yield suppression or decline in grain quality e.g. screenings (data not shown) even in extreme drought years.
The Lower intensity system has also had a higher background N level compared to the Baseline system due primarily to N accumulation in fallow periods. The low yielding chickpea and field pea crops in the Higher diversity and Higher legume systems have done little to improve background N levels compared to the Baseline which has had a dominance of cereal and canola phases.
Grey soil. Available soil nitrogen levels increased in all farming systems throughout the first 3 seasons on the grey soil (Figure 3), the Lower intensity system showing a five-fold increase. Levels stabilised during the dry 2019 period. High yields in 2020 removed half the soil N reserves in some systems. The faba bean crop accounting for the greatest decrease (264 kg N/ha), a reflection of the grain’s high protein content and subsequent N exported out the farm gate. At harvest in 2020, total soil N levels in all systems were within a 50 kg/ha range.
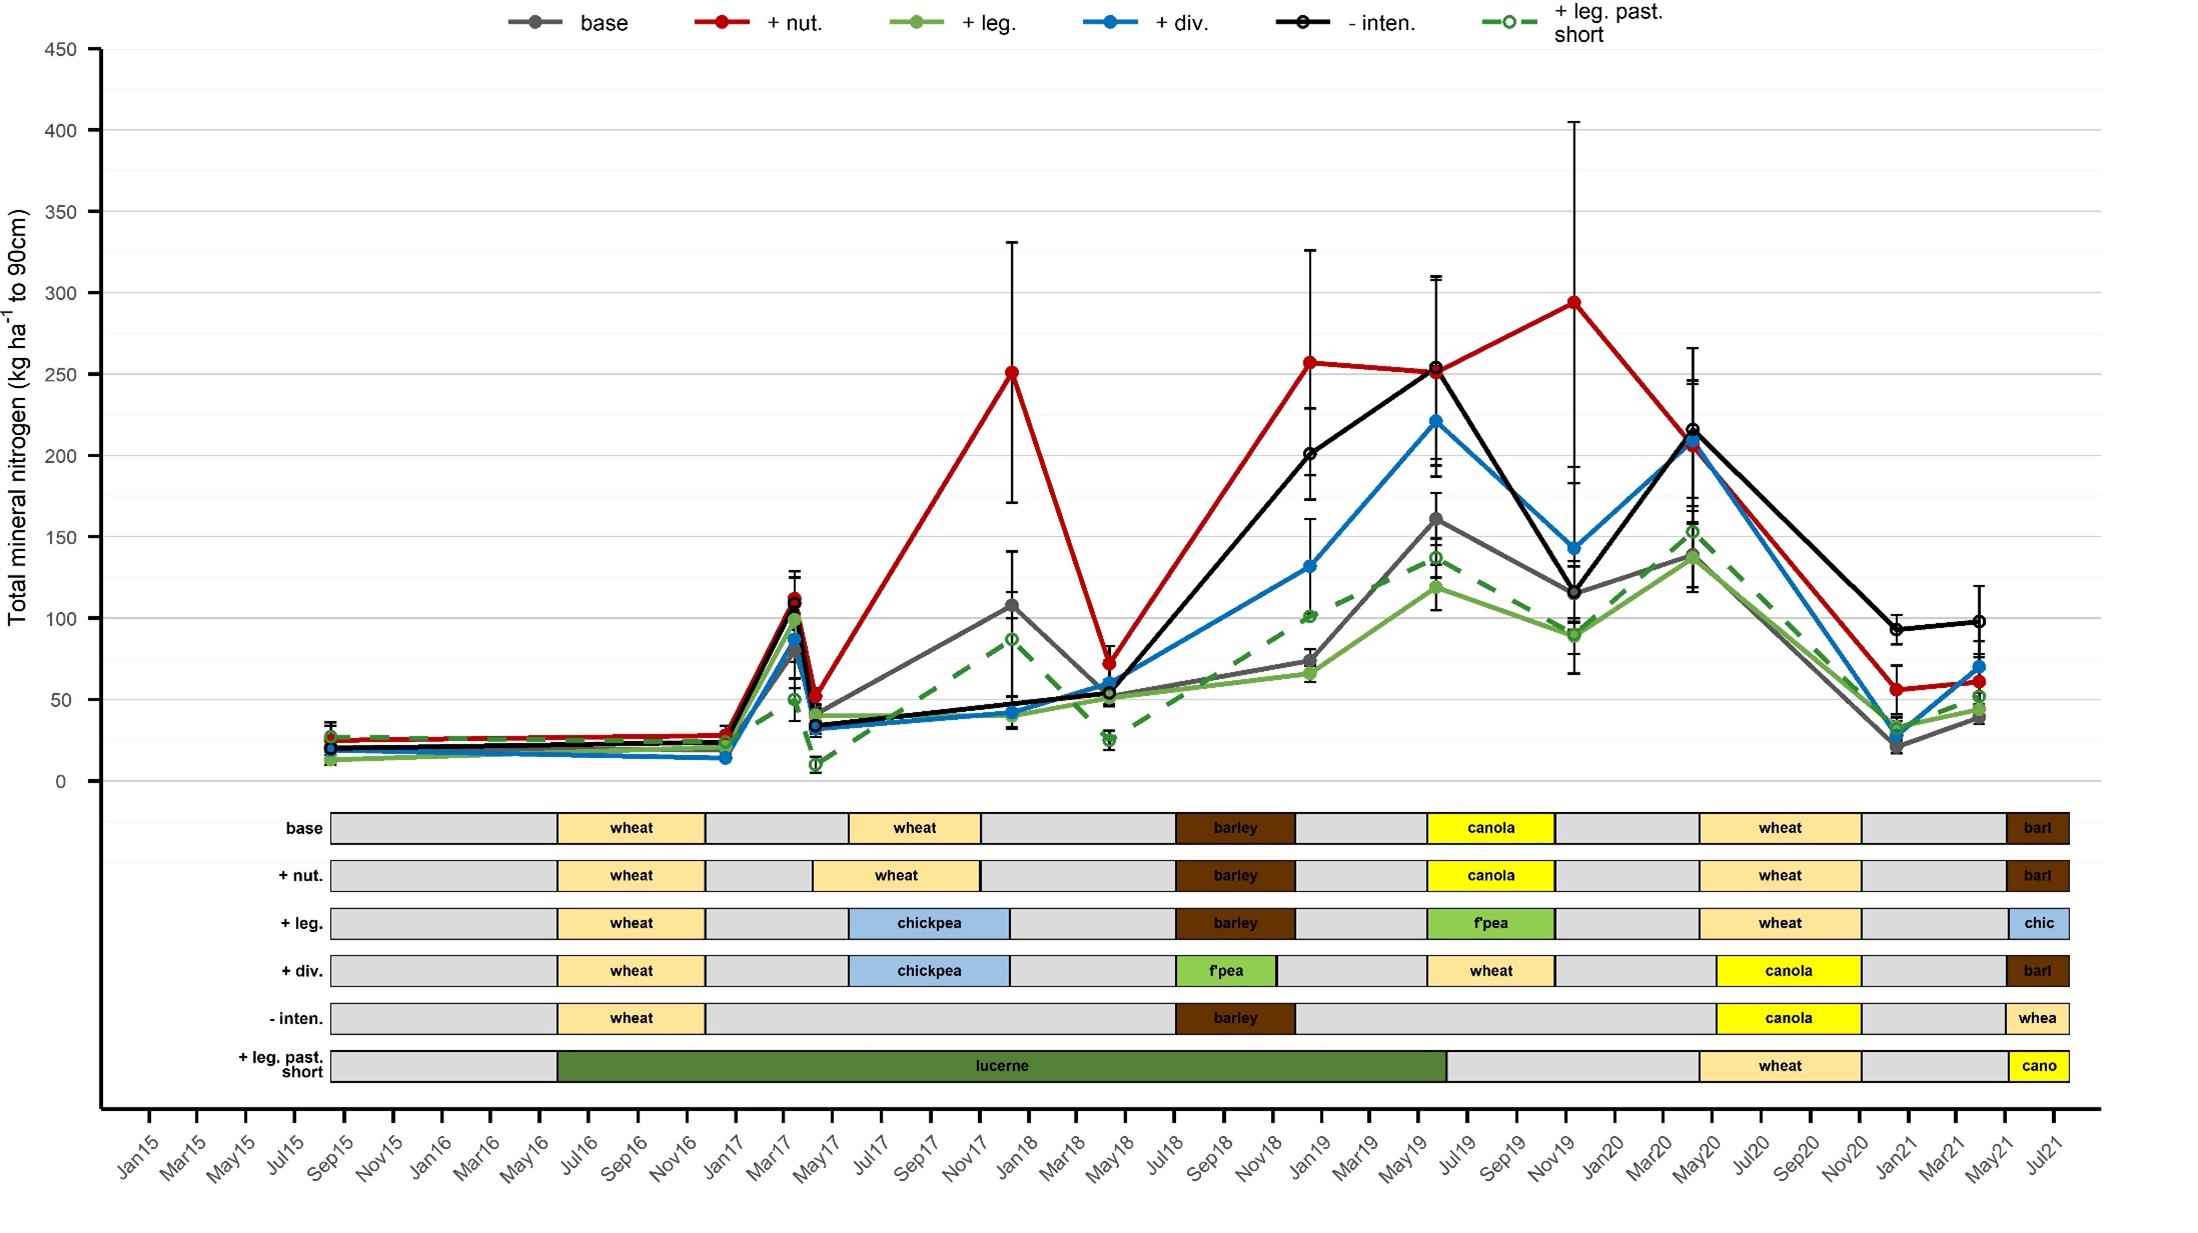
Figure 2. Total soil nitrogen dynamics to 90 cm soil depth in red soil (August 2015–March 2021)

Figure 3. Total soil nitrogen dynamics to 90 cm soil depth in Grey soil (August 2015–May 2021)
Plant Available Water (PAW)
Lucerne dried the soil profile to levels below the capacity of wheat to access soil water (Figure 4 and Figure 5). In real terms the PAW levels of the lucerne plots reached a level 40 mm below what wheat can extract in both red and grey soil. Due to lucerne’s perennial growth habit, it used soil water continually which whilst drying down the soil profile, allowed it to continue to produce valuable forage even in the drought periods experienced over the life of the project.
Red soil. The importance ground cover for storing soil moisture was highlighted in the summer fallow periods of 2016/17 and 2017/18. Retained crop residues after the 2016 barley crop in all crop-only systems conserved most of fallow soil moisture and rainfall over the fallow period. Where crop residues were greatest in the Higher nutrient system, PAW increased by 13 mm (Figure 4).
Following the 2018 winter crop season, fallow PAW decreased on average by ≈20 mm after chickpeas in the Higher legume and Higher diversity systems, similar to the losses in the Lower intensity system. In contrast, after wheat (Baseline and Higher nutrient systems), accumulated fallow PAW increased by an average of 16 mm.
The failed field pea crop (0.2 t/ha) in 2018 used minimal soil water. Consequently, the Higher diversity system had 20–30mm more PAW at harvest in 2018 than the other systems sown to barley.. Soil water profile recharge of the Ley pasture system after lucerne removal was rapid. Stored soil water increased during the 2018/19 fallow to 60 mm PAW, equal to the crop-based farming systems.
Due to drought years soil water storage in the Lower intensity system were not markedly higher than the Baseline system. PAW measurements showed that the Lower intensity system stored only an additional 20 mm over a fallow than did the Baseline system.
Grey soil. The grey soil has held considerably more PAW than the red soil at any time during the project phase, a reflection of its higher clay content. The lucerne phase in the Ley pasture system produced 5.3 t DM/ha on the grey soil compared to 15.2 t DM/ha on the red soil site. Soil water extraction was rapid, reaching levels below the crop lower limit for wheat within the first 12 months and a lower limit of -40 mm PAW at both grey and red soil sites (Figure 4 and Figure 5).
In the 2018 season a dry soil band between 15 and 30 cm was present at sowing across all treatments and persisted for the duration of the season until October. This dry band of soil stopped deeper root exploration and denied root access to water stored deeper in the profile. Field peas failed and died prior to flowering and the barley almost died, with a very quick period of growth in spring afforded only low yields between 300 to 500 kg/ha.
The Higher legume system was penalised further and only yielded 30 kg/ha. This was primarily due to poorer surface moisture through lower crop residue and ground cover following chickpeas in 2017 than the Baseline (wheat) and the low intensity (wheat 2016/fallow 2017). The Lower intensity system used little soil water in the 2018 season. It was sown to barley and yielded only 300 kg/ha. The Lower intensity system has held significantly more PAW than any other system due to fallow moisture accumulation and capacity of this soil type to hold and store soil water (Figure 5).
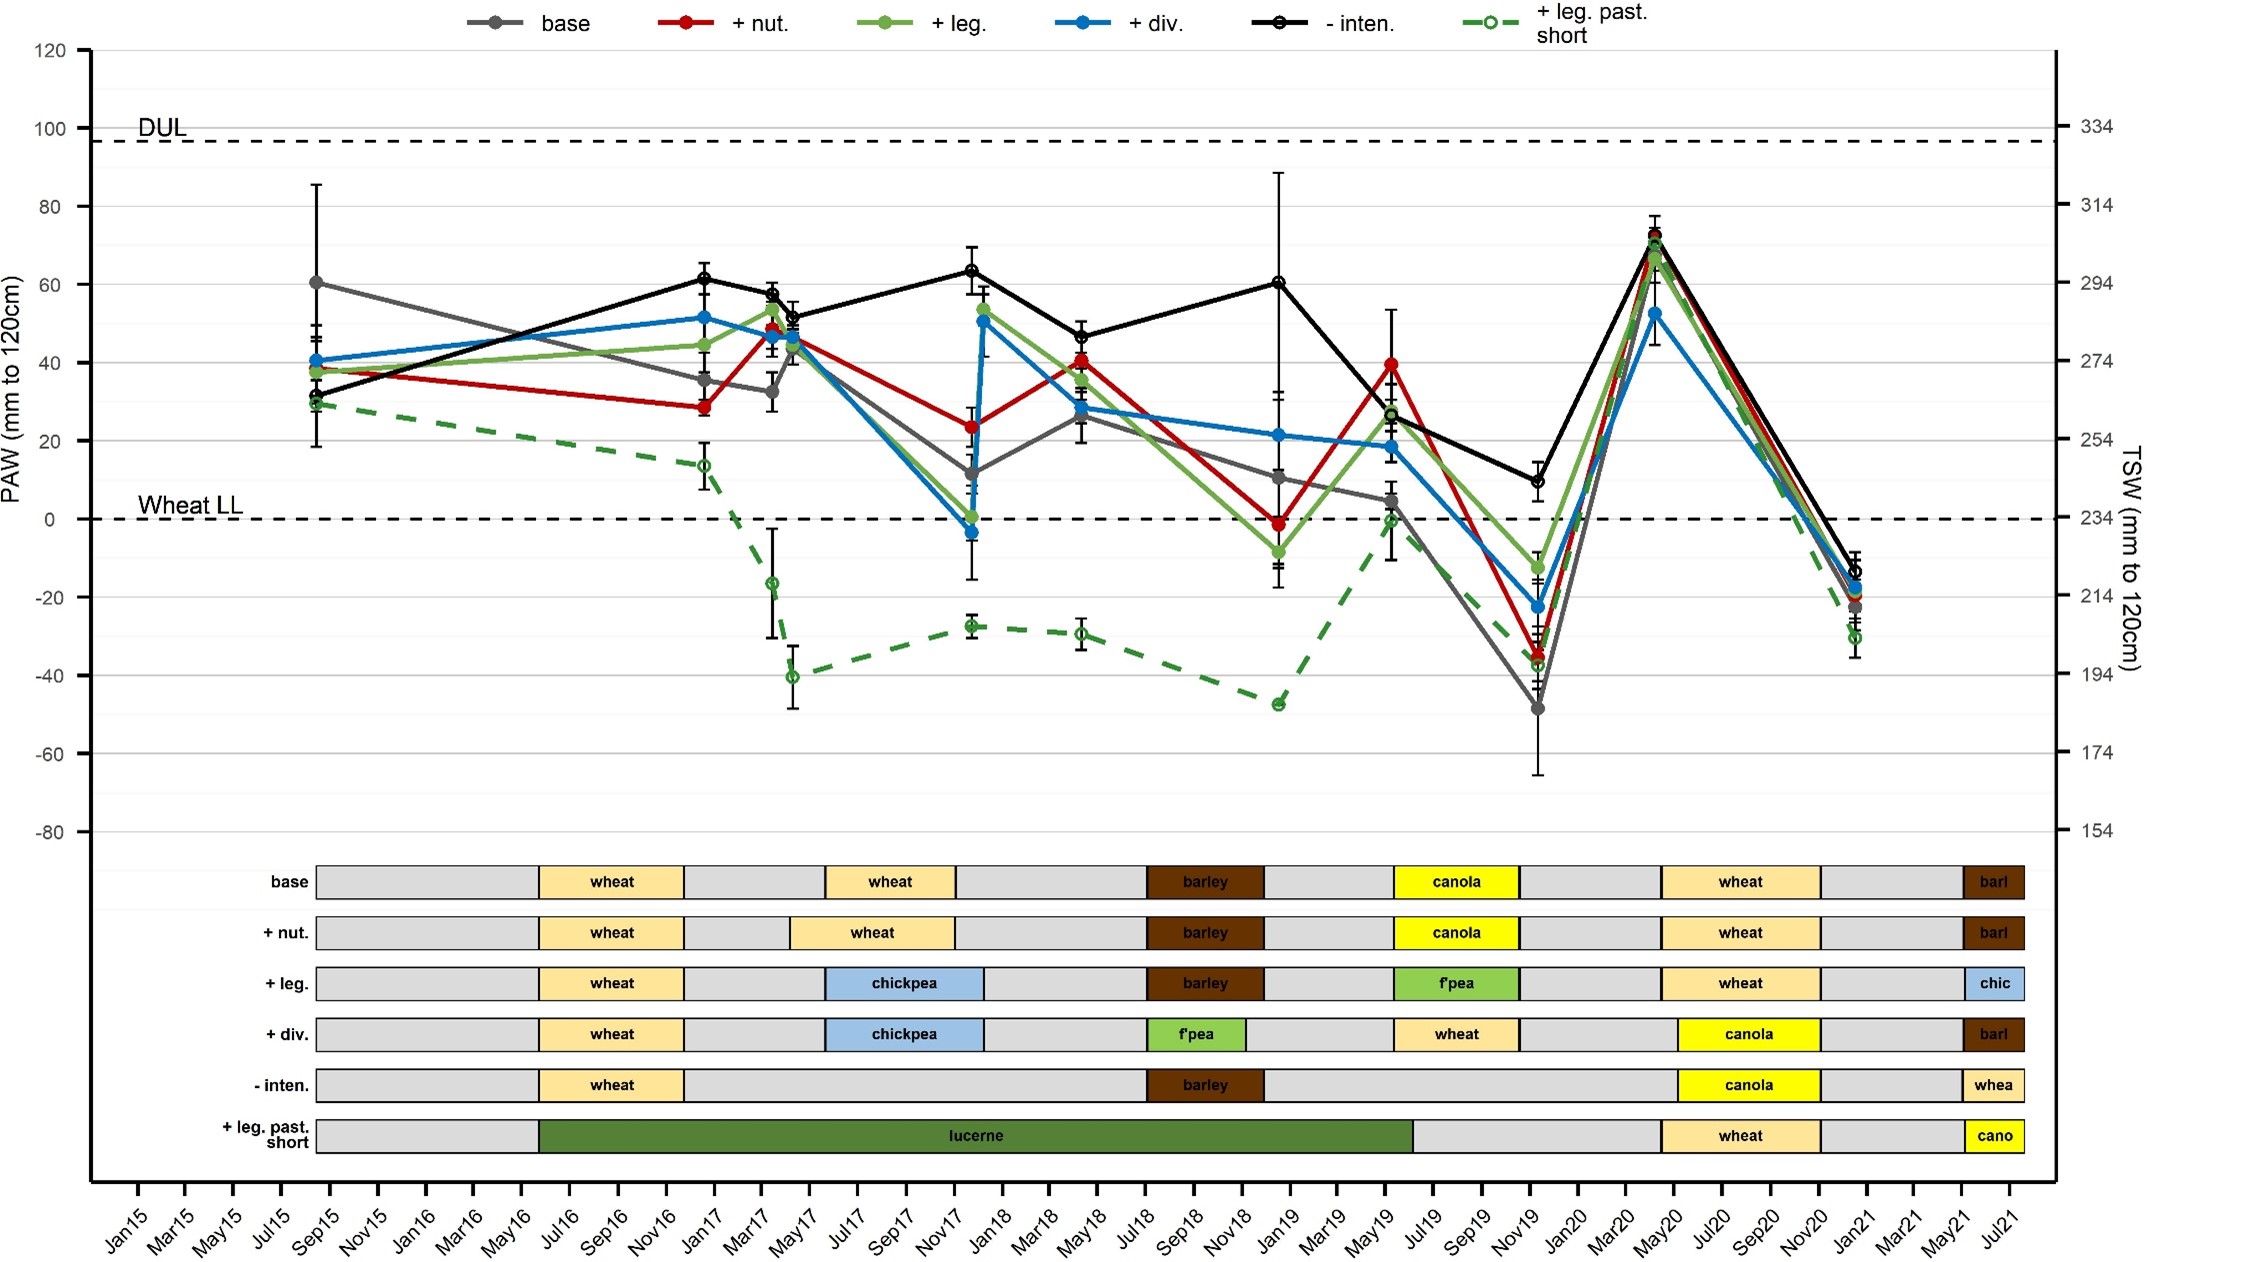
Figure 4. Plant available water to 120 cm soil depth on red soil
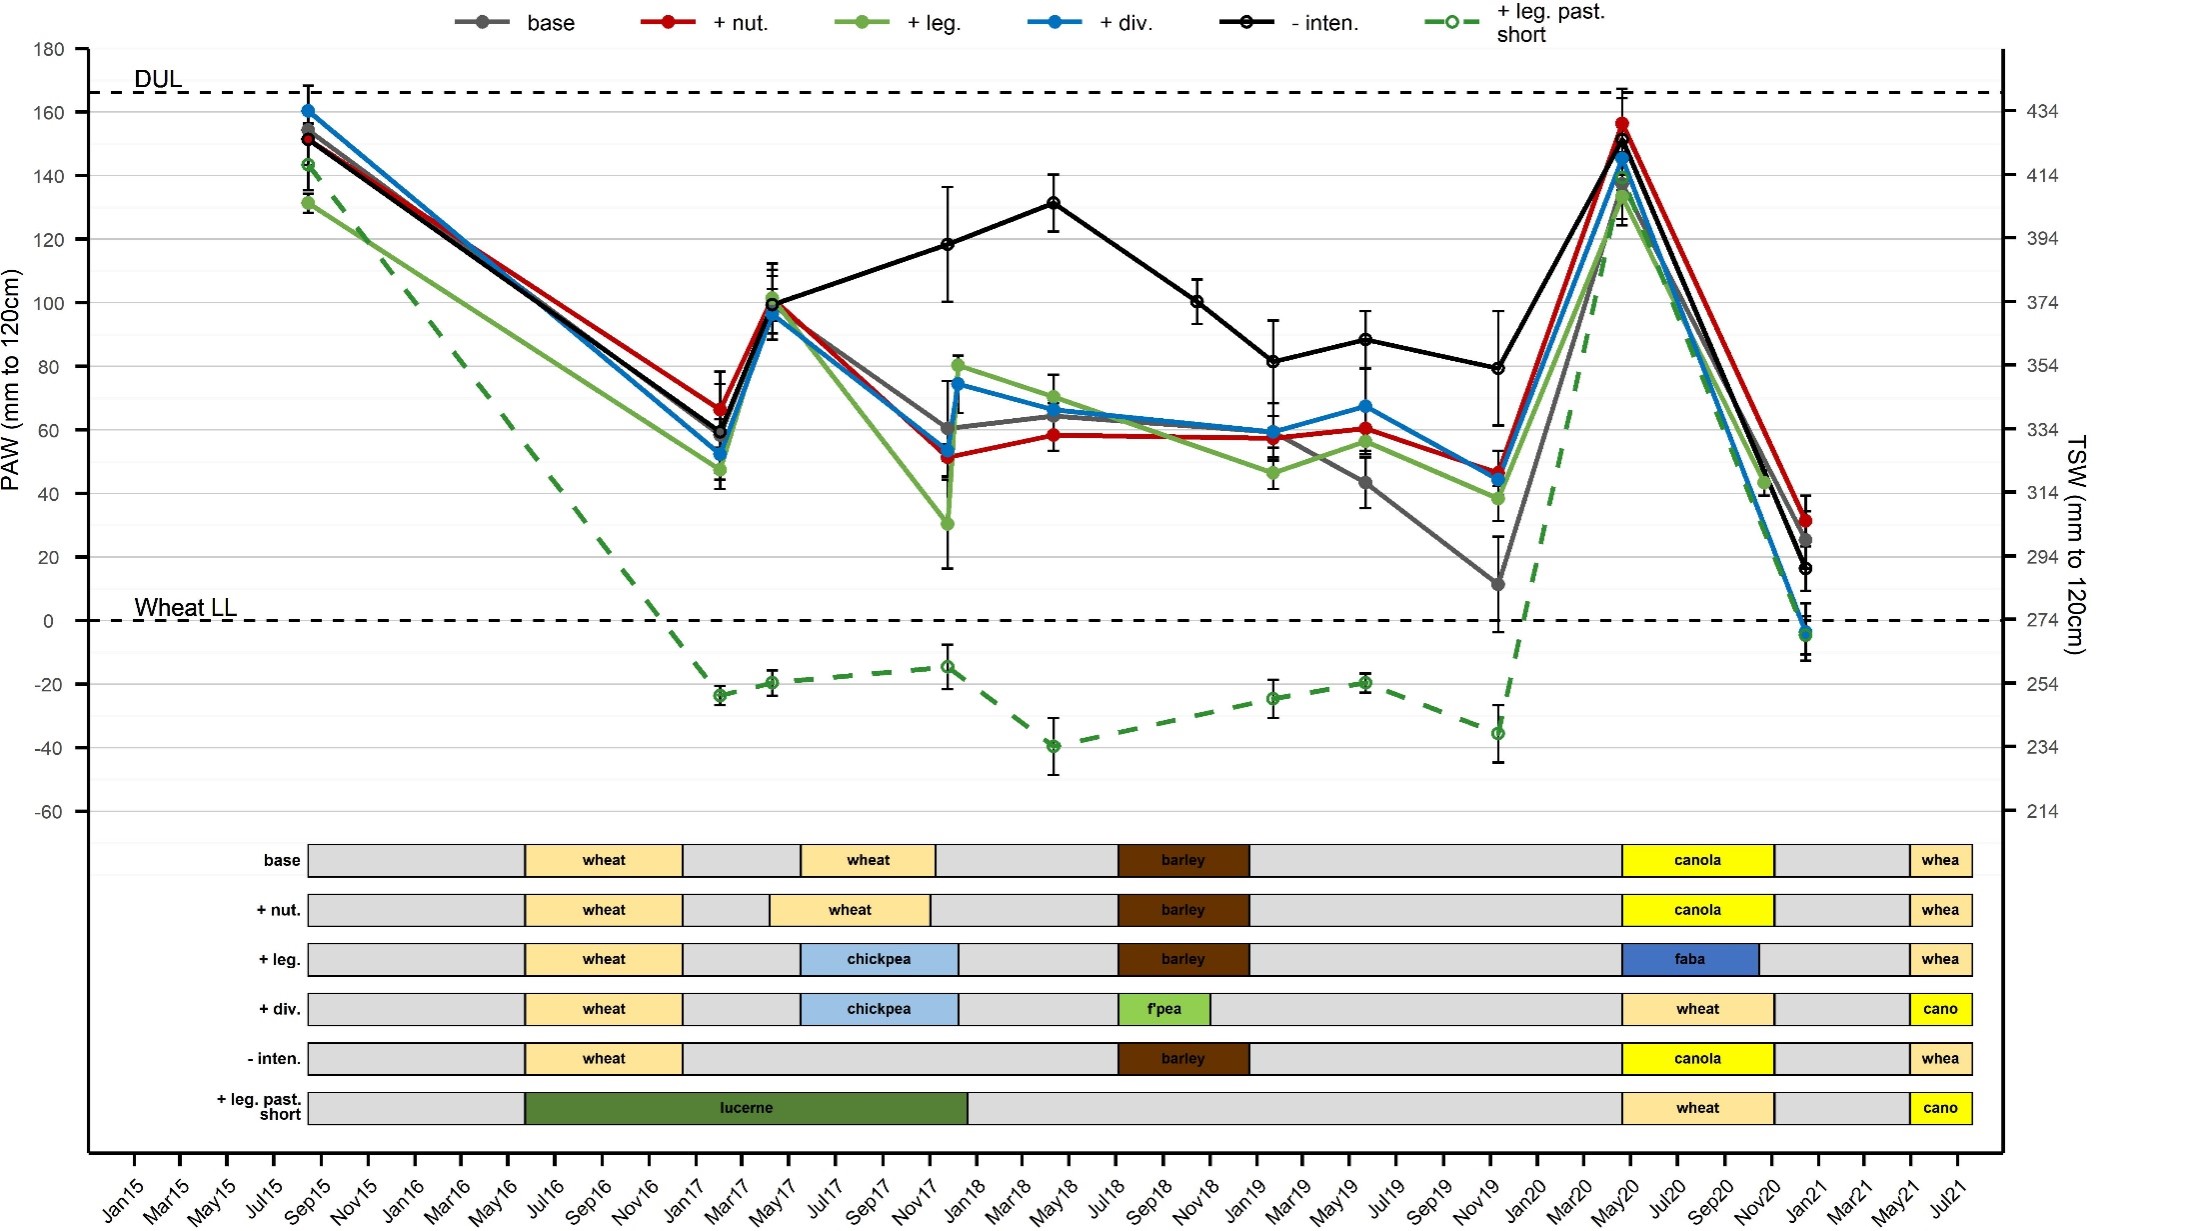
Figure 5. Plant available water to 120 cm soil depth on grey soil
Grain production
Red soil. The Higher nutrient system has out yielded the Baseline system in all years resulting in close to a 2 t/ha cumulative system benefit (Figure 6). The Lower intensity system has performed similarly to the Baseline system in the 2 years it has had crop.
The Higher diversity system in 2018 had field peas that yielded only 0.2 t/ha compared with the Baseline system that had barley that yielded 1.2 t/ha and the Higher legume system that also had barley and yielded 0.83 t/ha.
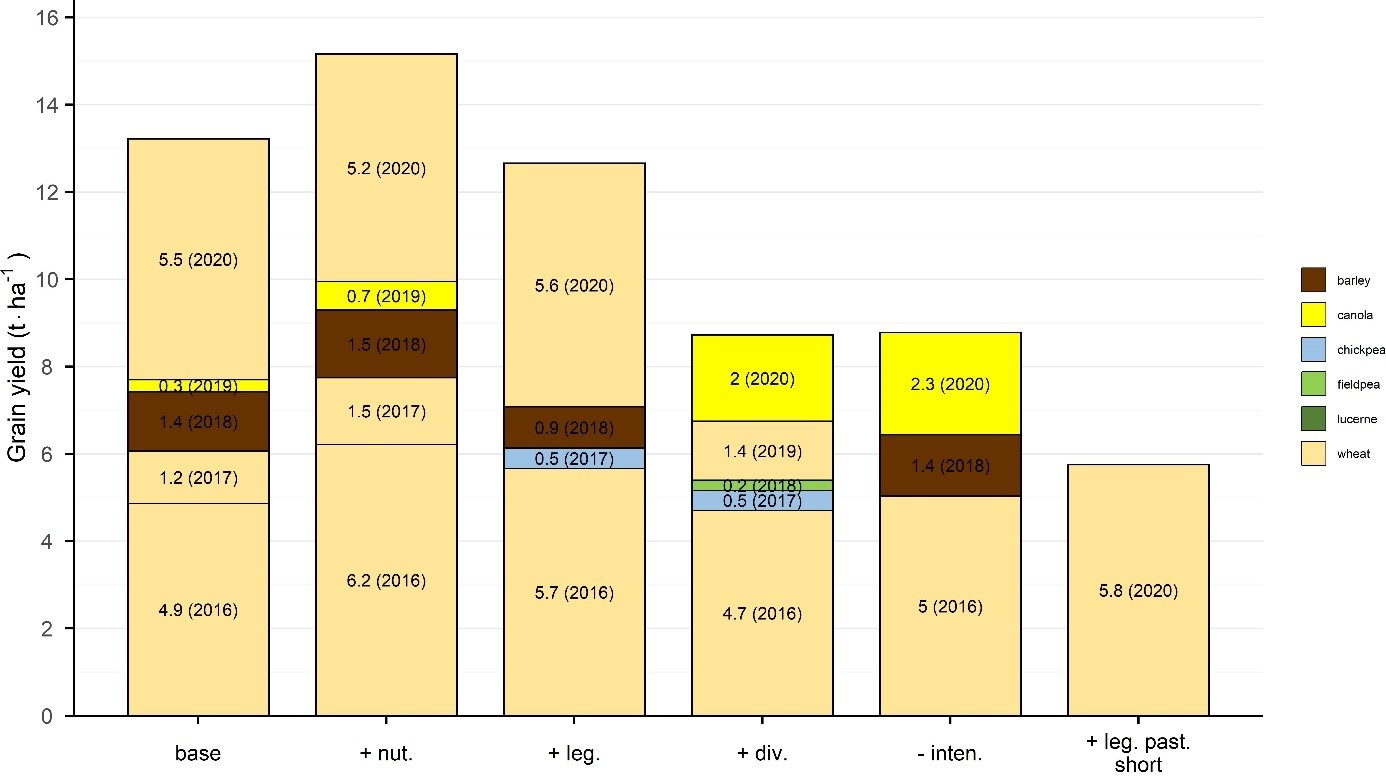
Figure 6. Cumulative grain yield of farming systems on red soil
Grey soil. Baseline yields have consistently out yielded those in the Higher nutrient system (Figure 7). In drier seasons, cereal crops have proven to be more consistent than pulse crops. In the Higher legume system, faba beans in 2020 produced more than the combined grain production from the 3 previous crops.
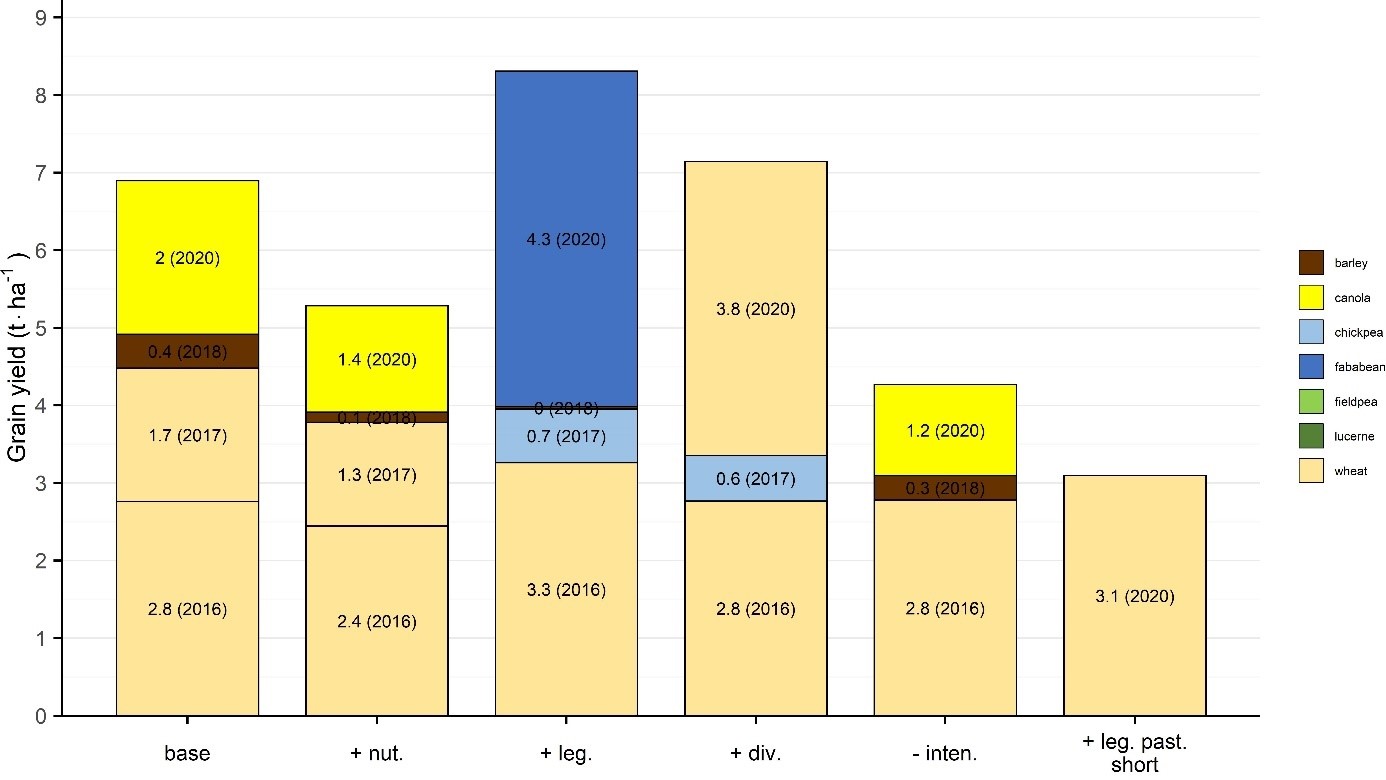
Figure 7. Cumulative grain yield of farming systems on grey soil
Root lesion nematodes (Pratylenchus thornei)
Red soil. Levels of Pratylenchus thornei (Pt) were low at project commencement (Figure 8). During the lucerne phase, the lack of suitable host plants is reflected in the consistently low levels. Despite some responses to various crop types and sequences, overall levels remain in the ’Low’ category.
Grey soil. Lucerne pasture rapidly reduced Pt levels to barely detectable levels where levels have remained since (Figure 9). After the 2018 barley crops, Pt levels rapidly increased to ’High category’ in the Baseline, Higher nutrient and Higher legume systems. The movement of Pt deeper into the soil profile during dry seasons, at depths below soil sampling as well as lack of a host crop is reflected in the decrease to ‘Low to moderate’ levels during the 2019 fallow. In 2020, faba beans, a susceptible host crop, resulted in the highest Pt population of any treatment over the first 5 years of the project.
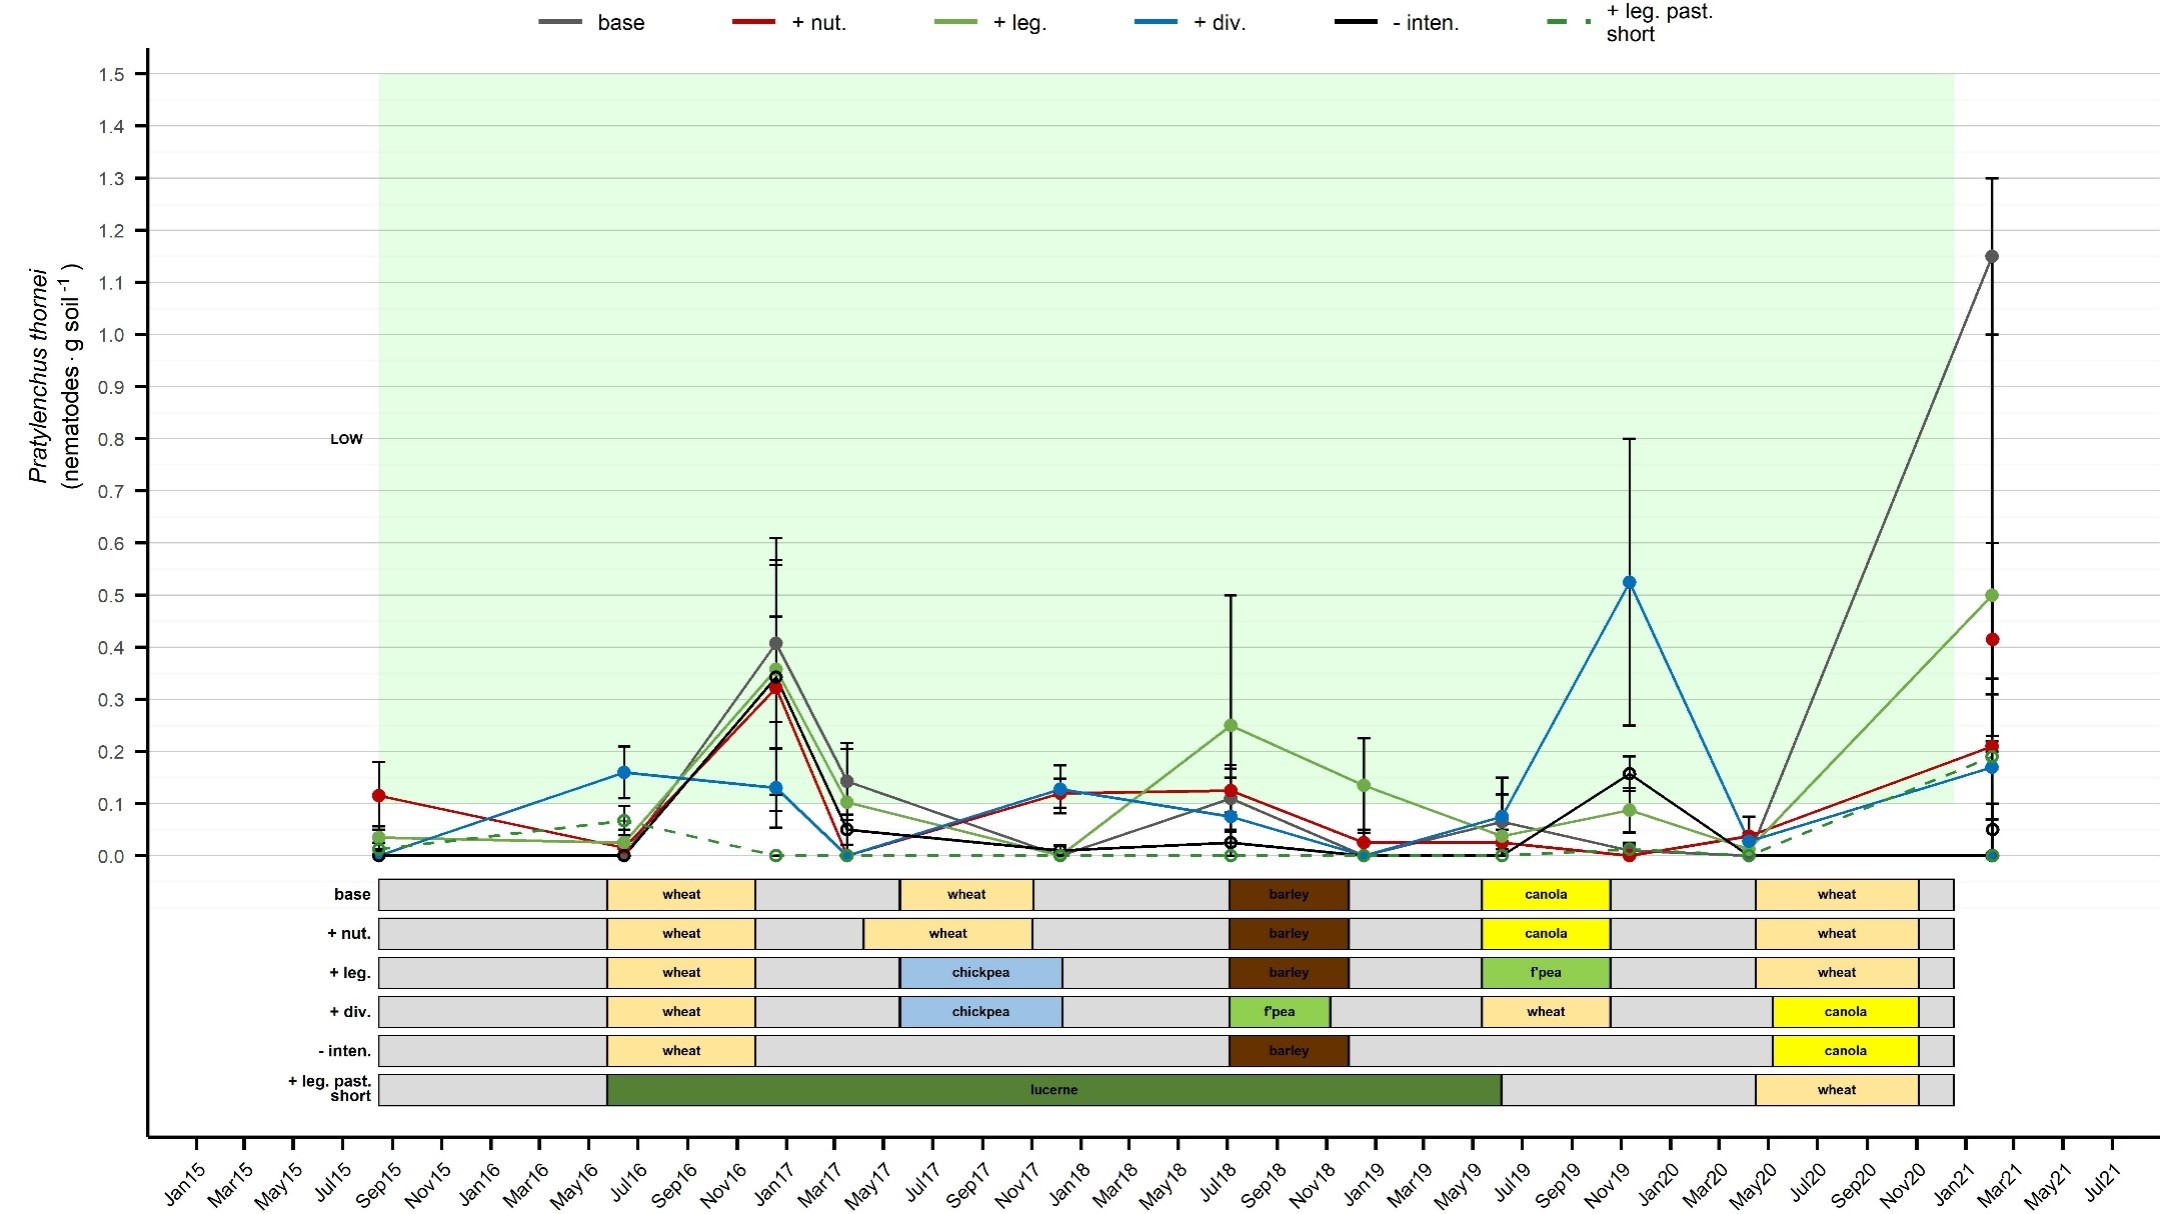
Figure 8. Pratylenchus thornei nematode population response to farming systems on red soil (August 2015–May 2021)
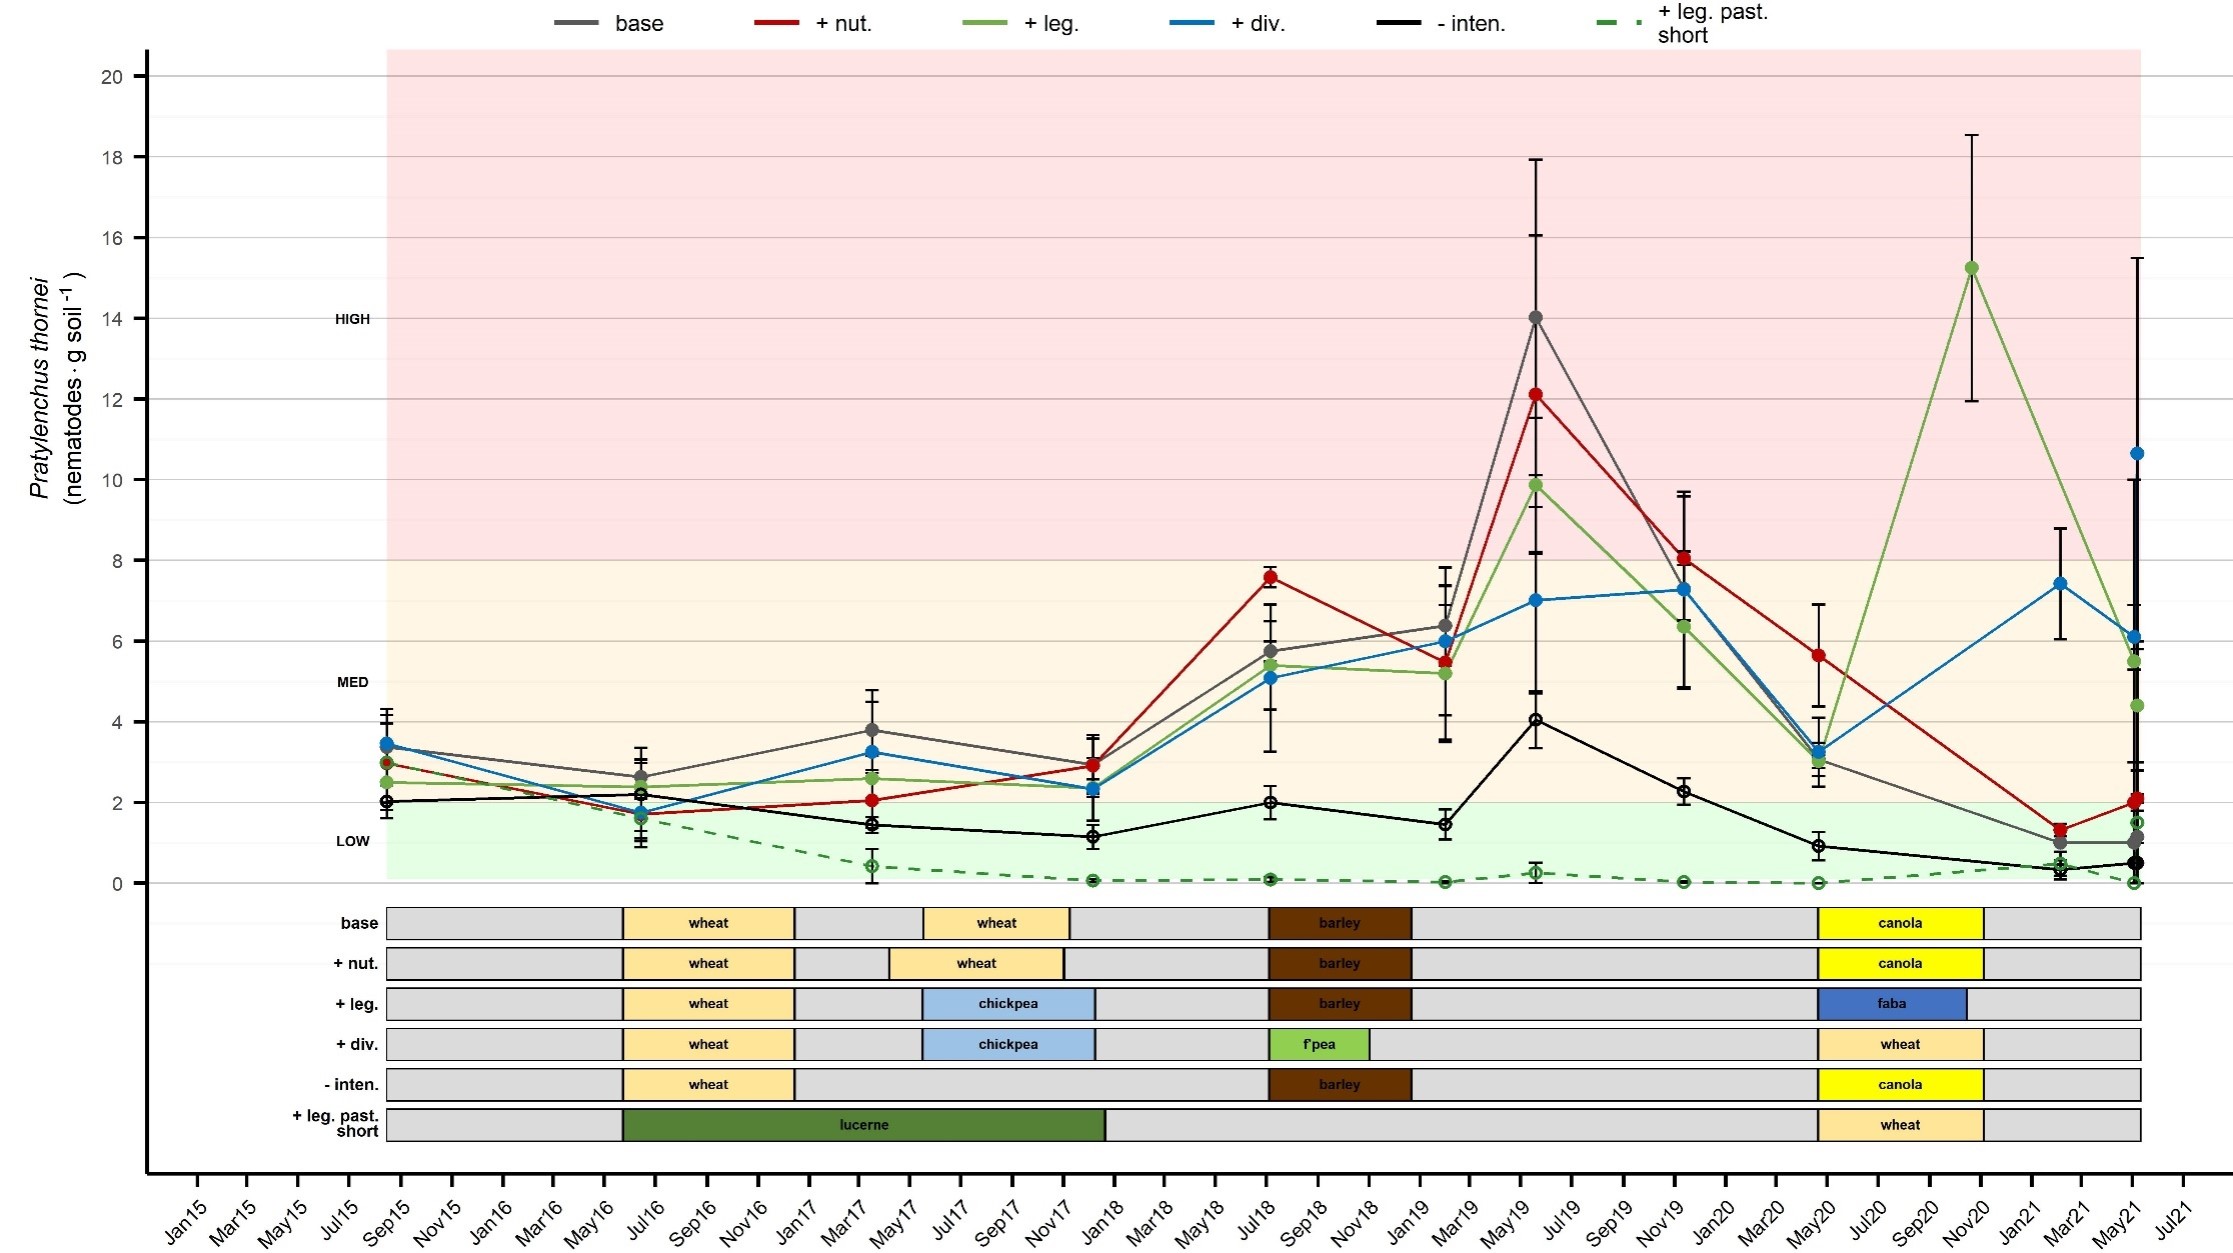
Figure 9. Pratylenchus thornei nematode population response to farming systems on grey soil (August 2015–May 2021)
Crown rot
Red soil. The most consistent low numbers have been under the Ley pasture system (Figure 10). During the winter fallow in 2017 the Lower intensity system also showed a declining trend in crown rot levels. Both these observations reflect the absence of a suitable crown rot host.
The Baseline and Higher nutrient systems mirror each other regarding crop types, the only difference being higher rates of N used in the Higher nutrient system. The additional N in the Higher nutrient system caused a rapid build-up of crown rot inoculum to ‘High’ levels, particularly in 2018 after two successive wheat crops. This increase is attributed to the larger (high biomass) crop that was grown, compared with the Baseline system. The pattern of changes generally tracks the Baseline system when identical crop types are grown.
Grey soil. Lucerne again shows the greatest decline in crown rot levels (Figure 11). Baseline and Higher nutrient systems which were sown to wheat in 2018 showed a sharp rise in crown rot levels. This response is due to the greater biomass of susceptible crops, that can increase inoculum levels quickly.
Crown-rot levels in the Higher legume and Higher diversity systems which were both sown to chickpea in 2017 declined that year. In 2018, the Higher legume system was sown to barley and the Higher diversity to field pea. The field peas died prior to anthesis from terminal drought stress and crown rot levels have remained low at an equal level with the Lower intensity system. Crown-rot levels increased slightly in the Higher legume system that was sown to barley in 2018.
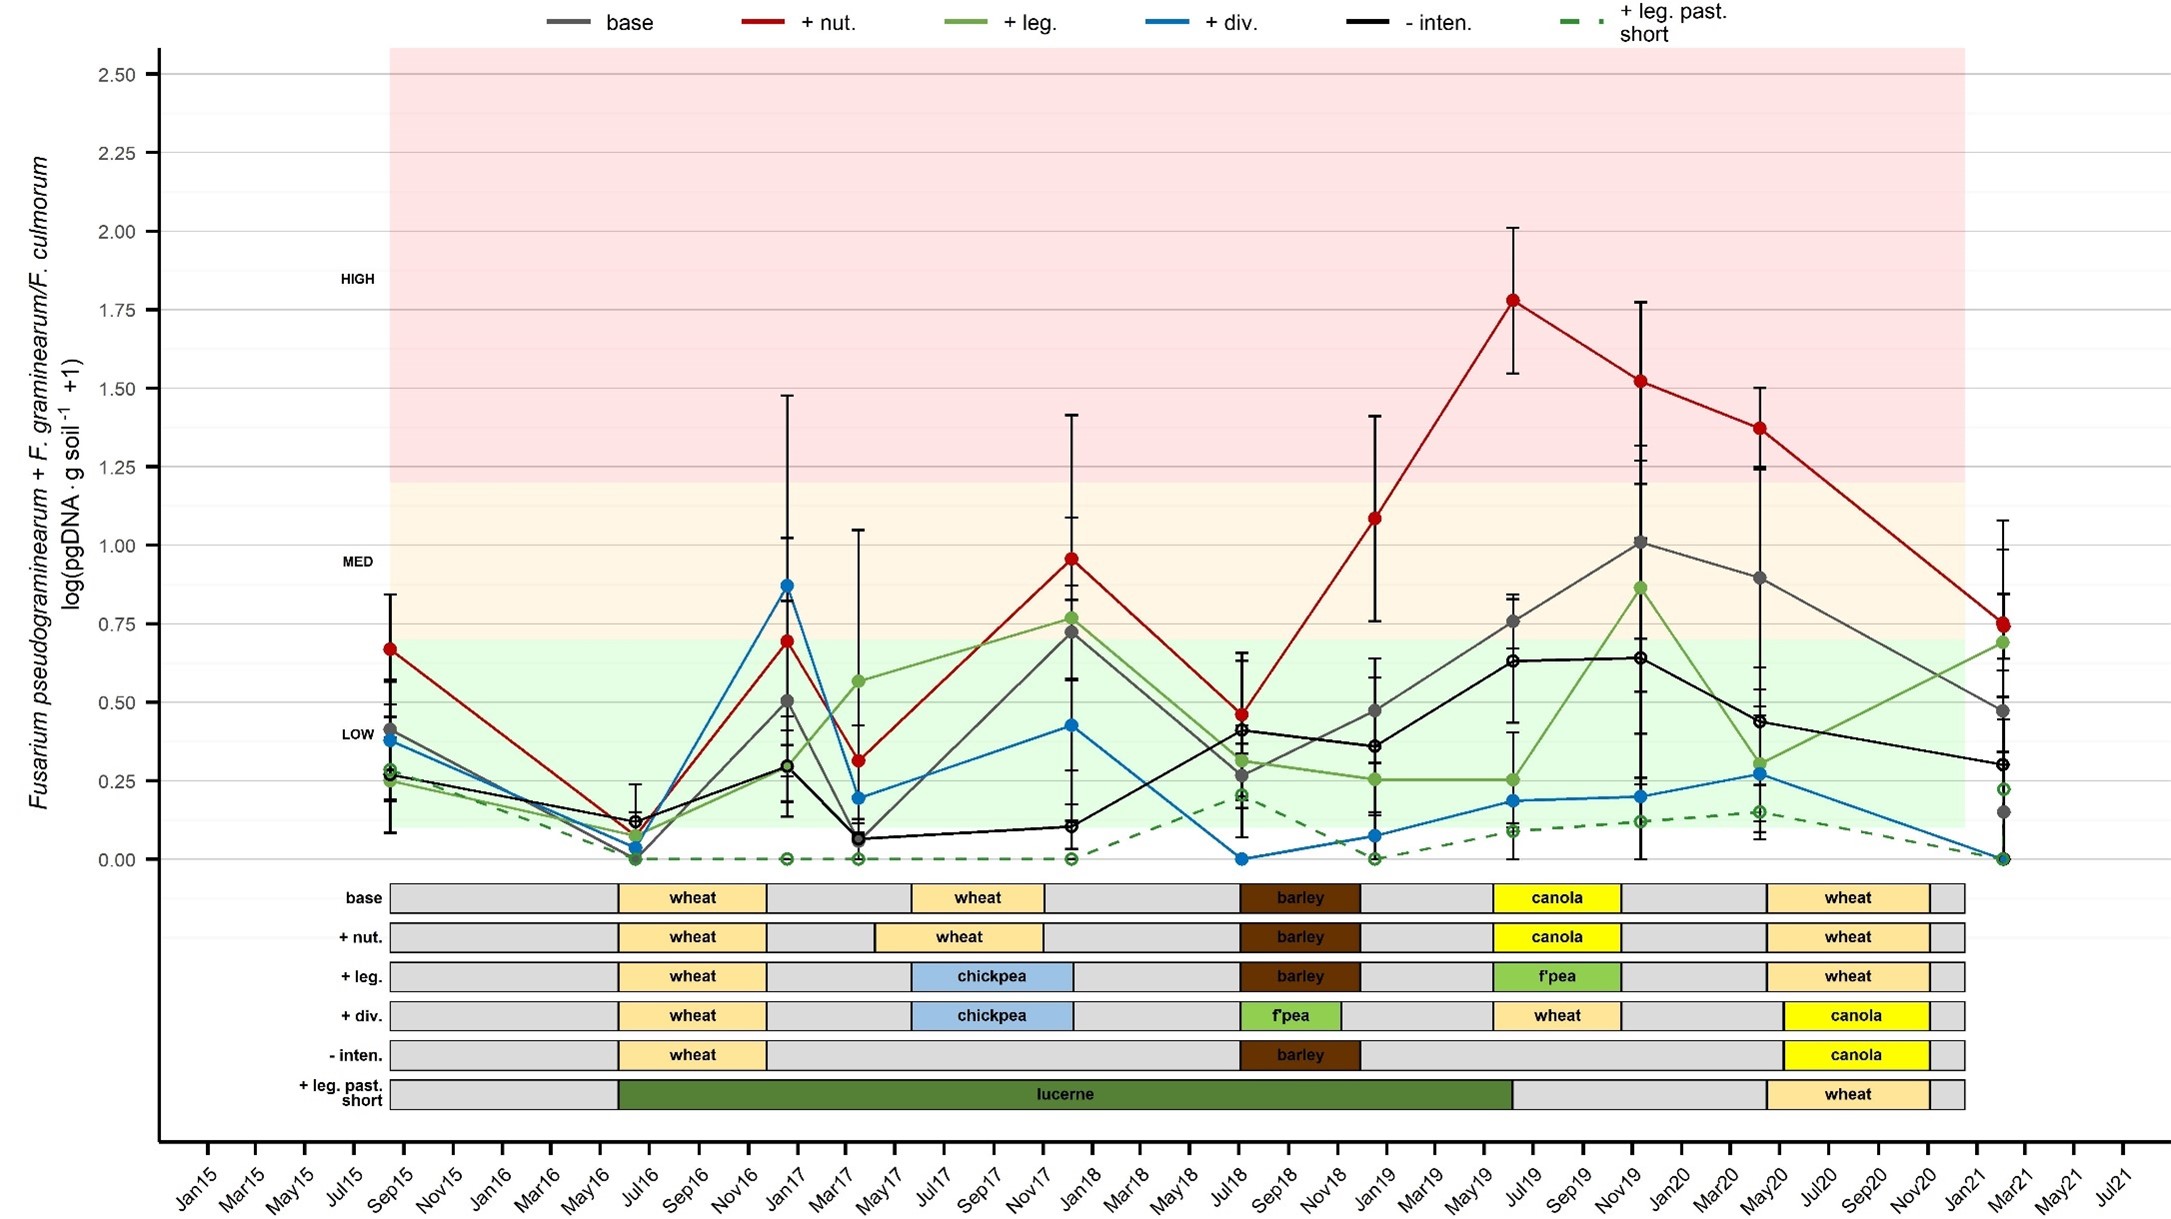
Figure 10. Crown rot dynamics on red soil farming systems (August 2015–May 2021)
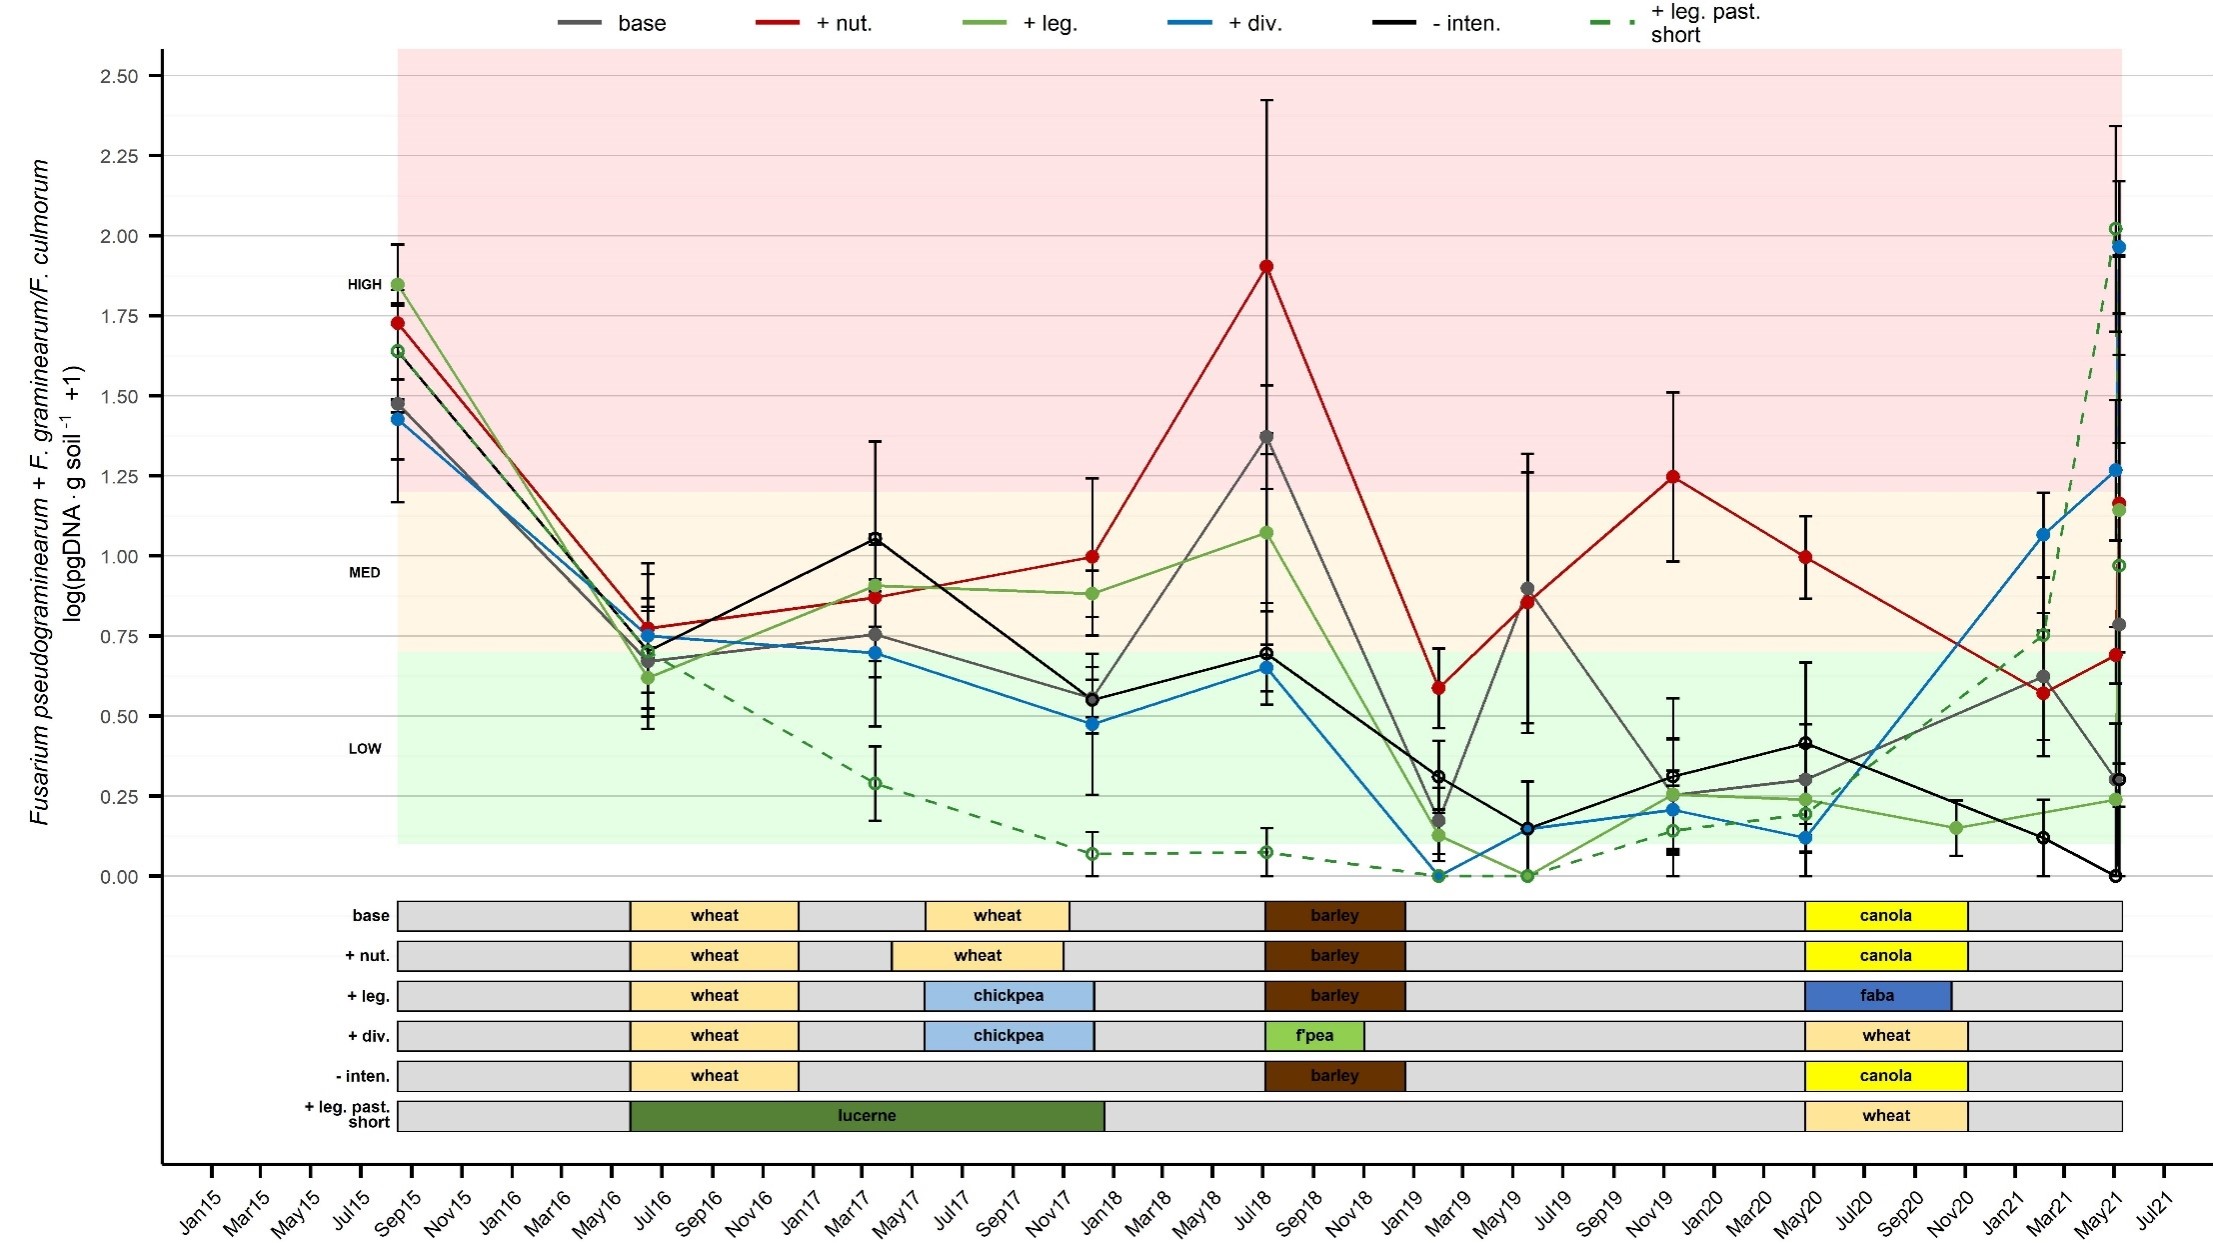
Figure 11. Crown rot dynamics on grey soil farming systems (August 2015–May 2021)
Acknowledgements
The research undertaken as part of this project is made possible by the significant contributions of growers through both trial cooperation and the support of the GRDC, the author would like to thank them for their continued support. We would also specifically like to thank all the technical staff contributing to the implementation and management of these experiments.
Contact details
Greg Brooke
NSW DPI
Trangie Agricultural Research Centre
Mb: 0437 140 577
Email: greg.brooke@dpi.nsw.gov.au
Varieties displaying this symbol beside them are protected under the Plant Breeders Rights Act 1994
GRDC Project Code: DAQ1406-003RTX,
Was this page helpful?
YOUR FEEDBACK
