Matching canola variety with environment and management - time of sowing, flowering windows and drivers of phenology
Matching canola variety with environment and management - time of sowing, flowering windows and drivers of phenology
Author: Jeremy Whish (CSIRO), Julianne Lilley (CSIRO), Shannon Dillon (CSIRO), Chris Helliwell (CSIRO) | Date: 22 Feb 2023
Take home message
- Avoiding stress during the critical period of yield formation improves productivity
- Identifying optimal time of flowering for an environment helps avoid stress during the critical period
- Knowing the phenology of a cultivar helps target flowering to the optimal time.
- Tools like the flowering predictor use probability to show the risk of different genetics in different environments.
Background
Canola’s diverse genetics allows it to be grown as a short-season spring crop or a long-season winter crop. In Australian cropping regions, avoiding damaging frosts or high temperatures during flowering and early podding and minimising stress during the critical period for yield formation is the key to maximising yield and oil quality (Kirkegaard et al., 2018). Having confidence that a cultivar will flower when expected, ensures timely management and that crops will flower at the optimal time (Lilley et al., 2019). Recent climatic changes and the logistics of planting large areas have resulted in canola being sown outside the traditional window. This has seen some cultivars behave unpredictably with flowering occurring earlier or later than expected. Phenology is the term used to describe the development or lifecycle of a plant. Understanding the phenological mechanisms within each canola cultivar allows us to predict when it will flower in different environments (Whish et al., 2020) or different sowing dates, allowing growers to choose better adapted cultivars and management strategies for different environments.
What do we mean by critical period?
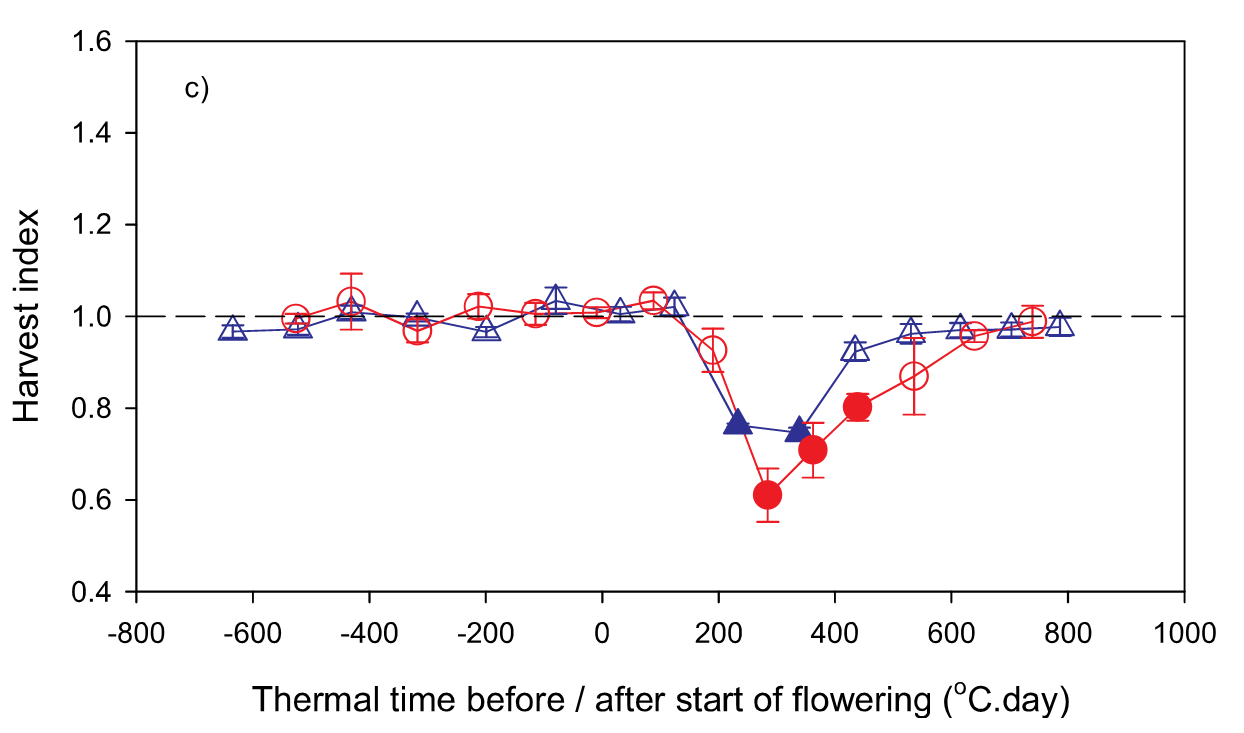
The critical period of yield determination is defined as the physiological stage in which abiotic stresses have the largest impact on yield determination. The critical periods for many crops have been determined over the years (Fischer, 1985; Lake and Sadras, 2014; Kirkegaard et al., 2018; Lake et al., 2019) and the value of reducing stress during these yield formation periods has been demonstrated (Dreccer et al., 2018). For canola, Kirkegaard et al. (2018) demonstrated that the critical period for canola is centred around 300-degree days (°Cd) following the start of flowering (Figure 1), growth stage 60 BBCH (Meier, 2001). At this point the indeterminant nature of the canola plant means it is producing new flowers, while developing pods and filling seed. Any stress at this time affects the supply of resources to the yield components of the plant. Critical periods are usually depicted as a u shape (Figure 1) because the plastic nature of many plants mean that if the stress occurs before the critical period the plant can compensate. To determine the critical period researchers apply stress for short periods then remove the stress and compare the results to an unstressed control.
Figure 1. The impact of stress during the critical period on harvest index for canola crops sown at Wagga Wagga (triangles) and Riverton (circles). Filled symbols represent a significant difference from the control. Reproduced from Kirkegaard et al. (2018).
How do you reduce stress during the critical period?
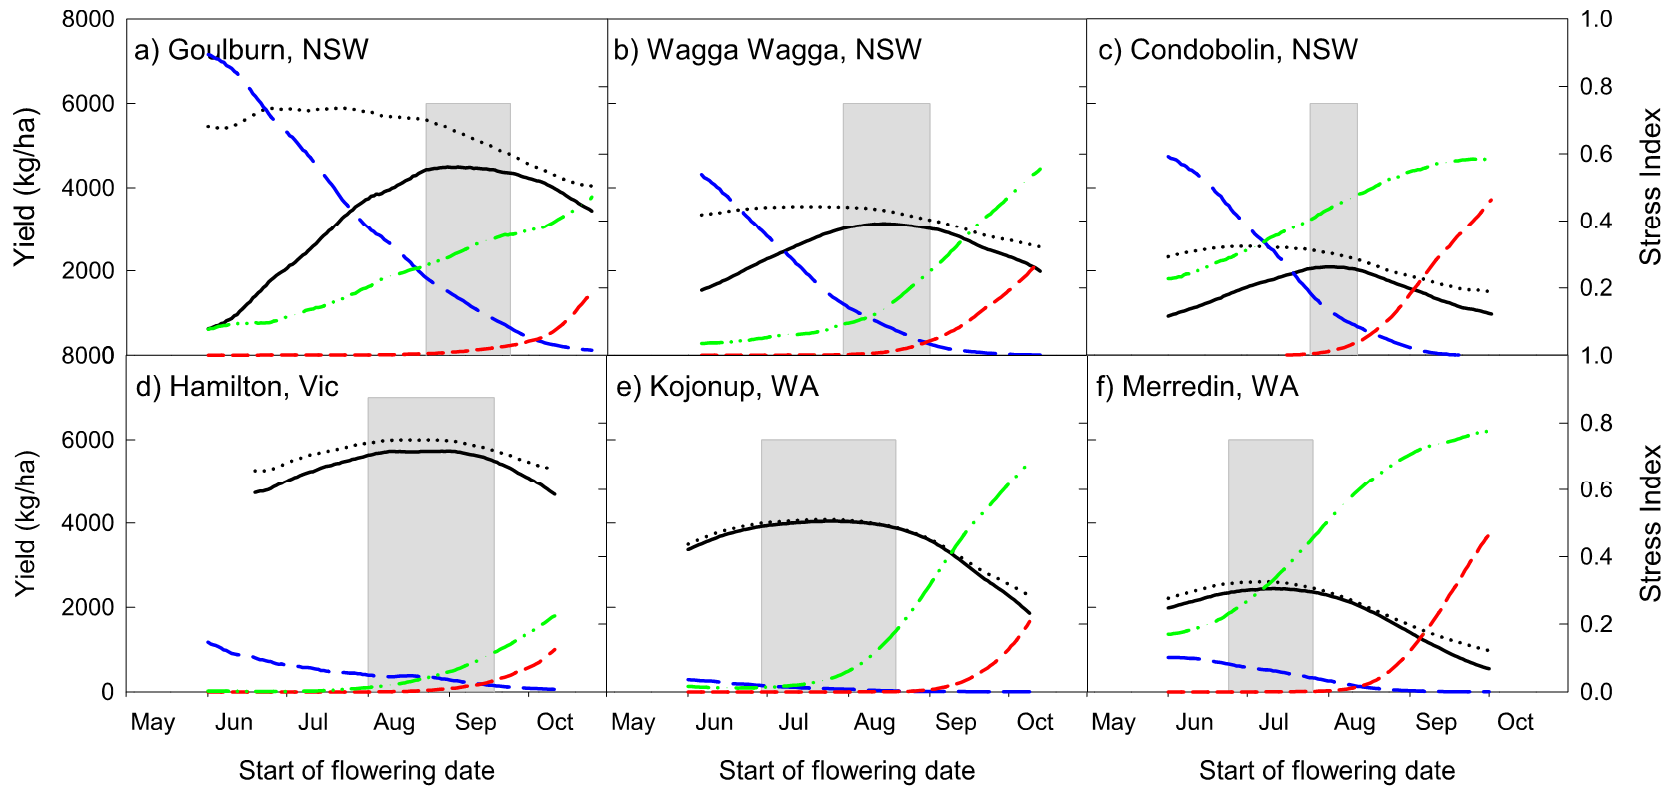
Stresses on plants take different forms (disease, lack of water, high temperatures, low nutrition, low temperatures and pathogens). Some stresses can be controlled but most have to be avoided. In canola, the critical period for yield formation is 300°Cd after flowering. If we can identify periods within the season when the probability of frost is low, the risk of heat is low and there is a high probability of good soil water then we have the optimal time to flower and form yield (Figure 2). Simulation models are useful for identifying these periods because simulations can be run for many years beyond the average grower’s life experience and can identify the optimal flowering time with a higher degree of accuracy.
Figure 2. The optimal time to start flowering in different regions around Australia. Showing the simulated potential yield: no frost or heat limitation (black dotted), with frost or heat limitation (solid black). Frost potential (blue long dash), heat stress potential (red short dash) and water limited potential (green dash-dot-dot). The grey box represents the optimum time to start flowering to achieve 95% of the water limited yield potential. (Reproduced from Lilley et al., 2019).
How do we get a cultivar to flower in our environment at the right time?
Understanding the developmental processes of a plant, its phenology, allows the plants development to be predicted based on the daily temperatures and day length experienced within an area. Using this knowledge allows a matching of genetics to the environment and helps ensure flowering at the correct time.
Identifying canola phenology
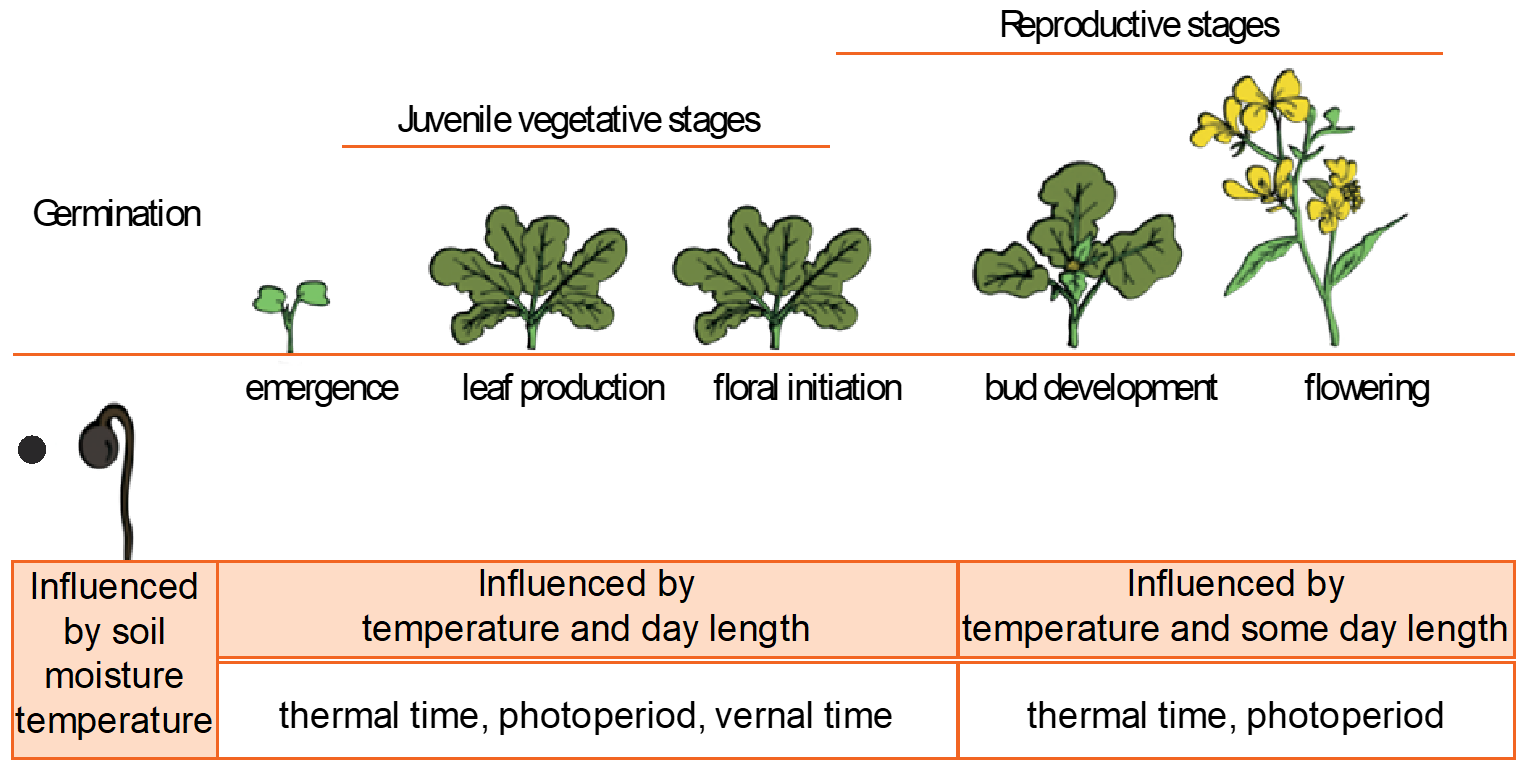
Plants have distinct stages of development, and these describe the phenology of the plant. The most common and easily recognised canola stages are emergence, green bud, flowering, podding and maturity (Figure 3).
Figure 3. Growth stages for canola and the dominant environmental signals that influence growth in each stage.
Plants respond to environmental signals such as temperature to determine when they move from one developmental stage to another. At the biochemical level, this is caused by specific temperatures inducing the production of plant hormones until a critical concentration triggers the change within the plant. A simpler way to think of this is as a biological clock that accumulates average daily temperatures (day degrees) until a specific target (thermal time target) is achieved.
Why would we want to know this?
Understanding how the environment affects the growth of a plant assists in crop management and enables a grower to match the available canola cultivars to sowing times so that they start to flower at the optimal period. Flowering at this time helps reduce stress during the critical period of yield formation. In addition, many management decisions are time critical, that is, for optimum results the intervention (spray application, defoliation, stop grazing, add fertiliser) needs to occur before a plant reaches a particular growth stage. Identifying these stages can be difficult, for example, floral initiation can occur well before any visible sign appears in the plant. If the crops are grazed or stressed during this floral initiation period, then a yield penalty can occur (Kirkegaard et al 2008; Sprague et al 2014). Knowing the developmental stage of a plant can often help prevent yield loss or ensure that untimely management does not occur.
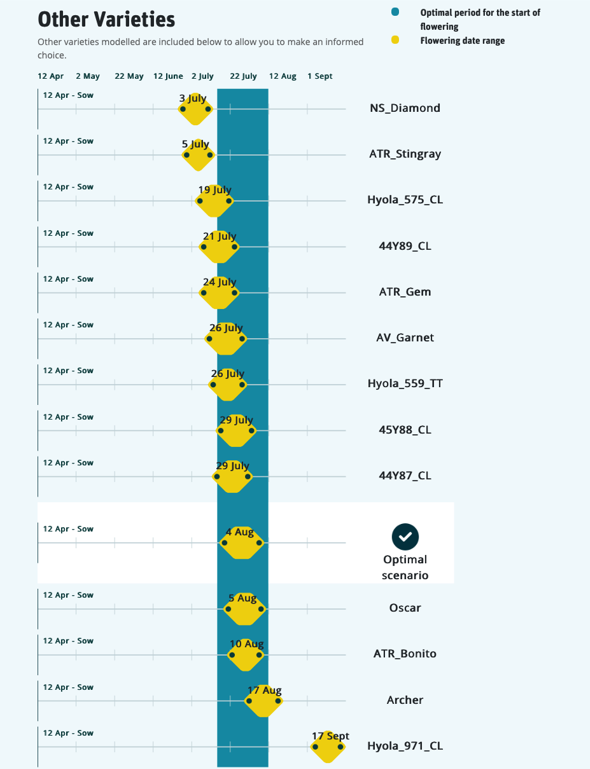
Rainfall at sowing time is generally unpredictable and may occur early or late. Understanding the phenology of different varieties allows selection of specific varieties to match the sowing time and ensure flowering occurs at the optimum time and the risk of crop loss is reduced (Figure 4).
Figure 4. A screen shot from the Canola Flowering Calculator showing flowering data for several cultivars sown at Trangie, NSW on 12 April. At this sowing, short season cultivars Nuseed® Diamond, ATR Stingray and Hyola® 575CL all start flowering before the optimal starting window while slightly longer-season cultivars like ATR Bonito start flowering at the optimal time.
Several GRDC projects have contributed to our understanding of canola flowering in the Australian environment. More recently, this work has investigated the gene combinations that produce different flowering responses. The goal is to develop a simple PCR test to predict flowering of new cultivars in any environment. While this genetics work is progressing, breeding companies are adopting the same phenological testing procedures to ensure they recommend cultivars ideally suited to each region, sowing date and purpose.
How do you calculate the phenological response for a cultivar?
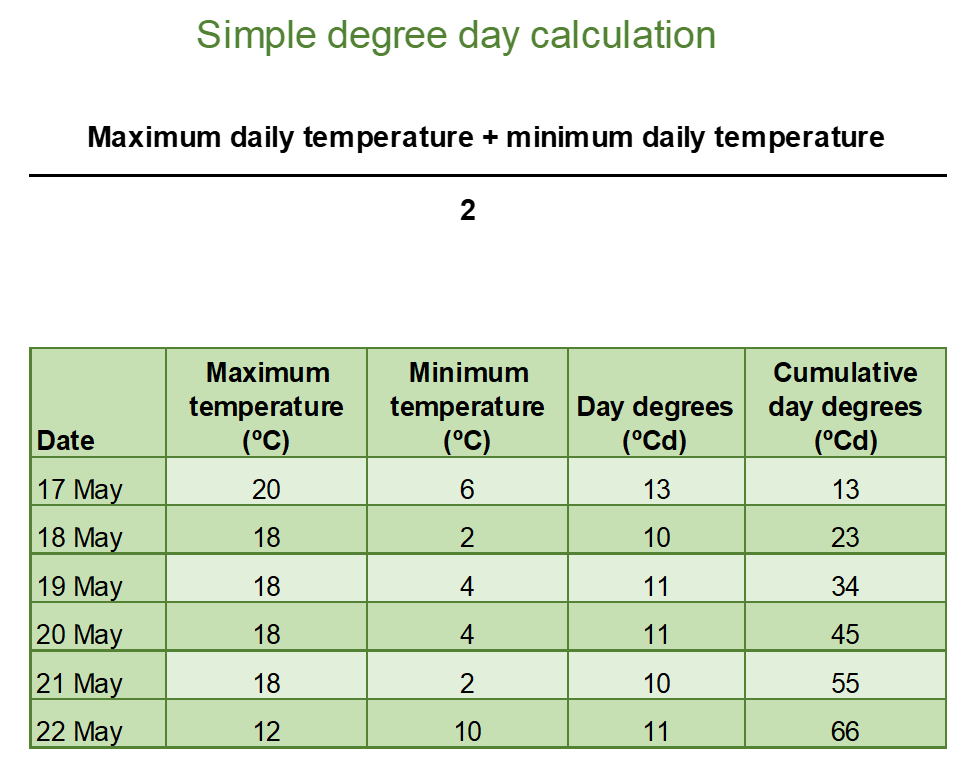
Day degrees, growing degree days, degree days or thermal time are the terms used to describe the units of a plant’s biological clock. They are a way of combining time and temperature into a single number. In their simplest form, day degrees are based on the average temperature recorded during a day (Figure 5). To calculate the thermal time target for a plant’s development stage, the day degrees are accumulated until a specific target is reached, e.g., variety X accumulates 500-degree days between emergence and flowering.
Figure 5. Simple calculation of day degrees (average daily temperature) and accumulation of day degrees over time to calculate a thermal time target.
This example is the simplest form and assumes that the plant has a base temperature of 0°C with no growth or development occurring below this temperature. It also assumes that growth and development will continue at high temperatures (>35°C) but this is not always the case.
The simple day degree calculation can be made more complex by identifying those temperatures where plant growth and development occurs and only calculating day degree temperatures when they are within this range. For this paper we use the average daily temperature, but more information and detail on calculating thermal time can be found here.
For some plants, development can be described using thermal time alone, as they will flower after accumulating the same thermal time no matter where they are planted. However, canola is more complicated than this, because in addition to accumulating thermal time, it has two other mechanisms — vernalisation and photoperiod, that influence the time to flowering. The combination and interaction of these three mechanisms complicate the process of estimating when canola crops will flower.
Photoperiod (day length)
Photoperiodism describes the response of plants to increasing or shortening day lengths. Long day plants (canola) respond to increasing day length by reducing the thermal time required to flower.
For example, if it takes an accumulated total of 800-degree days to flower during a 12-hour daylight day it would take only 700-degree days if there are 16 hours of daylight. However, in Australia, canola is generally grown with <12-hour daylengths, so daylength does not influence flowering in most commercial crops.
Vernalisation
Vernalisation is described as low temperature promotion of flowering (Salisbury and Ross, 1969). It is similar to photoperiod, in that vernally sensitive cultivars require less thermal time to flower when grown in a cold environment. However, there are two types of vernalisation ‘facultative’ and ‘obligate’. Facultative vernalisation is when canola grown in cooler climates require less thermal time to flower than when grown in warmer environments. Obligate vernalisation occurs in winter canola and works like a switch with the plants remaining in a juvenile or vegetative state until about 13 days of vernal time have accumulated (this is 13 days with an average temperature of 2°C or 52 days at 12°C). Obligate vernalisation is the mechanism that keeps plants dormant during European winters, or in Australia make this type of canola good for forage or as a dual-purpose crop. Once the obligate vernalisation trigger occurs, the plant behaves similarly to a spring type often displaying a facultative vernal response to additional cold.
How do we know this?
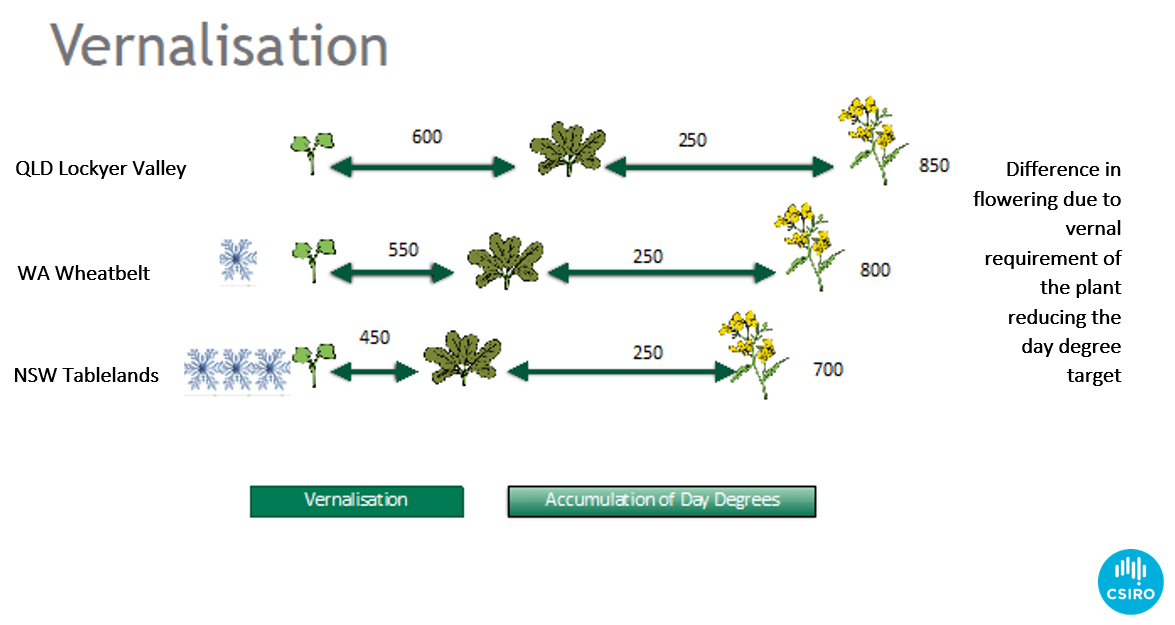
By studying the climate of different regions, we can build a set of key environments to test for vernal responses in canola cultivars (Figure 6).
Figure 6. The influence of different rates of vernal accumulation from three sites across Australia on canola flowering time. Cooler regions require less thermal time than warmer regions to achieve flowering.
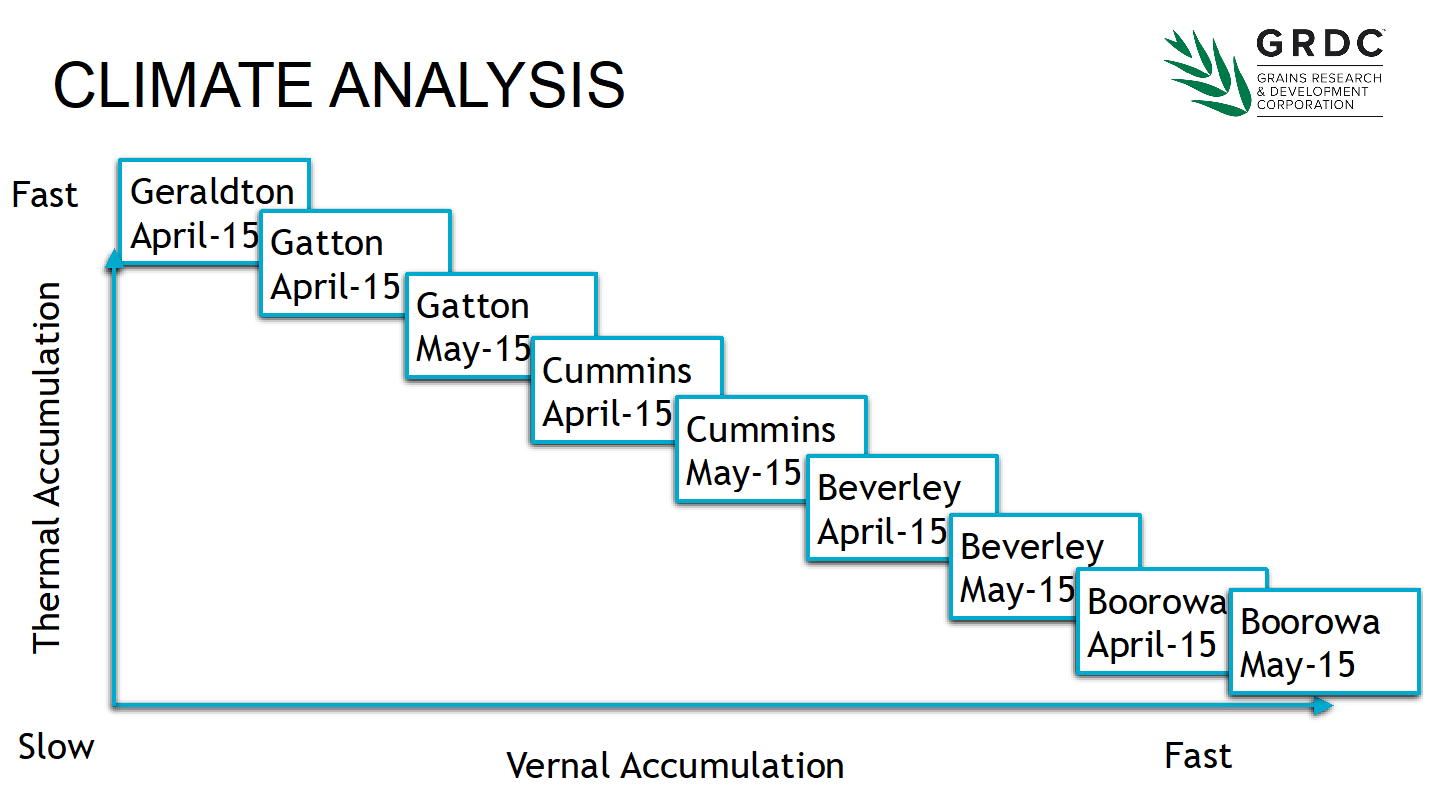
By strategically choosing sowing dates and sites that accumulate thermal and vernal time differently, we can calculate how each cultivar will behave in any environment (Figure 7). This selection of sites extends from the very cold extremes of the eastern tablelands, to areas with minimal cold, to capture all of Australia’s canola growing regions.
Figure 7. A selection of sowing dates and sites used to characterise the vernal to thermal ratio for Australian canola cultivars.
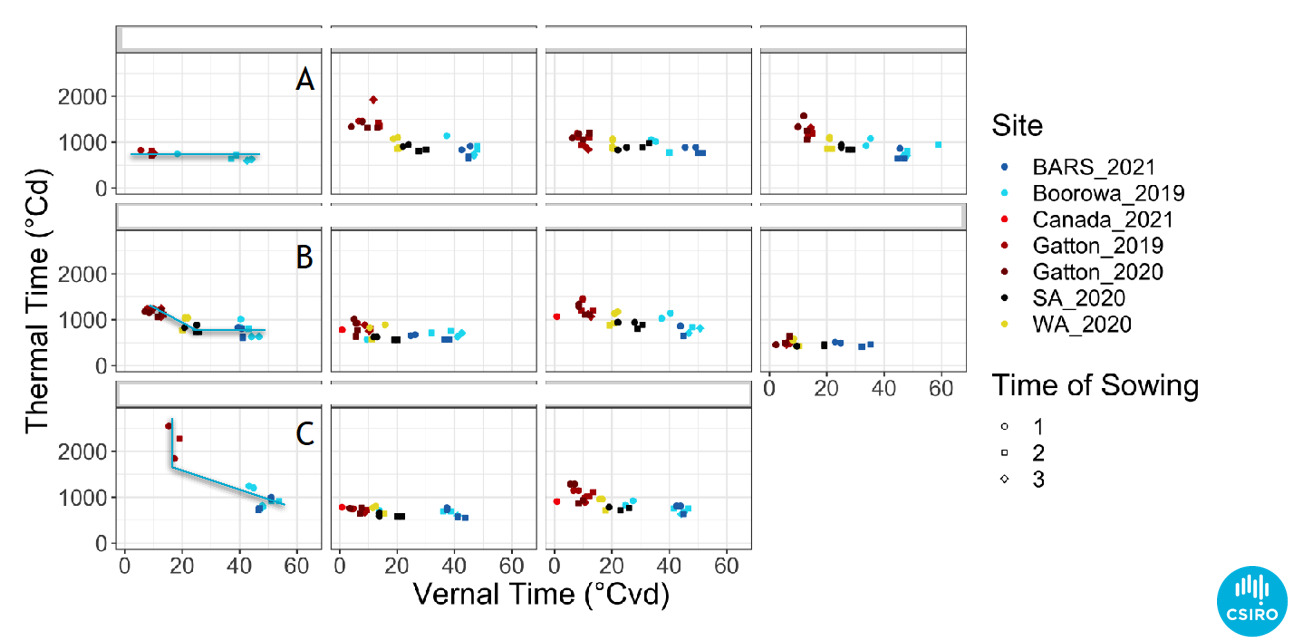
CSIRO’s GRDC funded canola genetics project (Optimising Canola Production in Diverse Australian Growing Environments: CSP1901-002RTX) has used this approach to examine more than 300 different cultivars from around the world. The results demonstrate it is possible to identify different vernal responses (Figure 8).
Figure 8. Data from the canola genetics project CSP1901-002RTX detailing three different vernal responses: A. no vernal response, B. facultative vernal response C. obligate vernal response.
Conclusion
Determining a cultivar’s phenological characteristics suitable for simulation in APSIM by using the traditional approach of field-based assessment in a range of environments, as described here, is expensive and time consuming. As a result, few current or newly released varieties are ever listed or included within flowering support systems, such as the flowering calculator. At best new cultivars are compared to old cultivars at a few sites and a best guess is applied.
The ability to predict a cultivars time of flowering in many environments, helps refine management decisions (e.g., variety selection, sowing time, fop or dim sub class herbicide timing and nitrogen application timing) and reduces potential yield gaps. Over the last 5 years GRDC and CSIRO have been working to match the phenological parameters required by APSIM canola to gene combinations. The results reported in the next paper (Dillon 2023, Optimisation of canola phenology in diverse Australian growing environments using genomics), demonstrates a new approach to determining a cultivars phenological response. Based on the success of this approach a new GRDC-CSIRO project (CSP1901-002RTX) will deliver a new flowering predictor within the next 12 months. This predictor will work like the canola flowering calculator and will include wheat and barley.
References
Dreccer, M.F., Fainges, J., Whish, J., Ogbonnaya, F.C., Sadras, V.O., (2018). Comparison of sensitive stages of wheat, barley, canola, chickpea and field pea to temperature and water stress across Australia. Agric. For. Meteorol. 248, 275–294.
Fischer, R.A., (1985). Number of kernels in wheat crops and the influence of solar radiation and temperature. J. Agric. Sci. 105, 447–461.
Kirkegaard JA, Lilley JM, Brill RD, Ware AH and Walela CK (2018) The critical period for yield and quality determination in canola (Brassica napus L.). Field Crops Res. 222, 180–188.
Kirkegaard JA, Sprague SJ, Dove H, Kelman WM, Marcroft SJ, Lieschke A, Howe GN and Graham JM (2008) Dual-purpose canola—a new opportunity in mixed farming systems. Aust. J. Agric. Res. 59, 291.
Lake, L., Godoy-Kutchartt, D.E., Calderini, D.F., Verrell, A., Sadras, V.O., (2019). Yield determination and the critical period of faba bean (Vicia faba L.). Field Crops Res. 241, 107575.
Lake, L., Sadras, V.O., (2014). The critical period for yield determination in chickpea (Cicer arietinum L.). Field Crops Res. 168, 1–7.
Lilley JM, Flohr BM, Whish JPM, Farre I and Kirkegaard JA (2019) Defining optimal sowing and flowering periods for canola in Australia. Field Crops Res. 235, 118–128.
Meier, U., (2001). Growth stages of mono-and dicotyledonous plants., Edition. Federal Biological Research Centre for Agriculture and Forestry.
Salisbury FB and Ross CW (1969) Plant physiology, The Wadsworth botany series. Wadsworth, Belmont, Calif.
Sprague SJ, Kirkegaard JA, Graham JM, Dove H and Kelman WM (2014) Crop and livestock production for dual-purpose winter canola (Brassica napus) in the high-rainfall zone of south-eastern Australia. Field Crops Res. 156, 30–39.
Whish JPM, Lilley JM, Morrison MJ, Cocks B and Bullock M (2020) Vernalisation in Australian spring canola explains variable flowering responses. Field Crops Res. 258, 107968.
Acknowledgements
This work builds on work conducted as part of the GRDC, CSIRO funded Optimising Canola Production in Diverse Australian Growing Environments: CSP1901-002RTX
Contact details
Jeremy Whish
CSIRO, St Lucia Qld
Ph: 0428 763 426
Email: Jeremy.Whish@CSIRO.au
Date published: February 2023
Varieties displaying this symbol beside them are protected under the Plant Breeders Rights Act 1994.
® Registered trademark
GRDC Project Code: CSP2206012RTX, CSP1901-002RTX,

