K responses on loamy soils: an emerging issue for grain crops
K responses on loamy soils: an emerging issue for grain crops
Author: Richard Bell, Craig Scanlan, James Easton, Tim Boyes and Qifu Ma | Date: 27 Feb 2023
Key messages
- Yield responses to K fertiliser now demonstrated on loamy soils due to run down in soil K levels.
- On loamy soils, topdressed K rates of 20 kg K/ha gave maximum wheat grain yield.
- Soil test K levels required to avoid K deficiency on loamy soils appear to be higher than those used for sands and sandy duplex soils.
- Sampling to 0–30cm depth gave more reliable predictions of wheat response to K than 0–10cm.
Introduction
There is emerging evidence of K responses on heavier-textured soils where the risk of K deficiency was previously not considered likely (Ma et al 2022). Our preliminary results showed that windrowing effects on wheat grown on loam soils at York and Meckering in 2019 were attributed to increased K availability in 2/3 cases studied, whereas poor growth off the windrows was mainly due to low K levels likely due to soil K depletion. At one site, wheat K response occurred with soil Colwell K above the current critical Colwell K concentrations. In the 2020 season, an oat crop on sandy clay loam at Brookton also grew much better on the windrows than off the windrows. Applying 100 or 200kg K/ha as a topdressing increased shoot dry weight by 10% on the windrows and by 60% off the windrows. The windrowing effects warranted further field experiments to test crop K response on heavier soils and further examination of whether the Colwell K test remains the most suitable for these soils. In 2021 and 2022, a total of eight K experiments on wheat were conducted on loam soils differing in K levels and the effects of K supply were assessed by measuring K uptake, shoot weight and grain yield.
Materials and methods
Eight farm sites were selected between Northam and Beverley. Site locations, soil types and chemical properties are shown in Tables 1 and 2. Each experiment was planted with wheat cv. Scepter. Potassium treatments were applied by topdressing with KCl before sowing at the rates of 0, 25, 50, 100 and 200kg K/ha. An additional treatment received 25kg K/ha at sowing and a second topdressing of 25kg K/ha at 8 weeks.
Wheat cv. Scepter was sown on 13–19 May at in 2021 and 9–27 May in 2022. Basal fertilisers included 68kg/ha monoammonium phosphate drilled, 40kg N/ha as urea top-dressed at sowing, 20kg N/ha as UAN 4 weeks after sowing, 20kg N/ha as urea 8 weeks after sowing and an additional 40kg N /ha as urea at 10 weeks after sowing for the 2021 trials.
Table 1. Site locations and soil types of K experiments in and east of the Avon Valley
Location | Year | Soil type (WA Soil Group)* |
Burges Siding, north of York | 2021, 2022 | red loamy earth |
East of Greenhills | 2021 | brown loamy earth |
South of Greenhills | 2021 | red loamy earth |
East Beverley | 2021 | red loamy earth |
Northwest Quairading | 2022 | Yellow brown deep sandy duplex |
East Beverley | 2022 | Red deep sandy duplex |
South of York | 2022 | Reticulate deep sandy duplex |
*Soil classification by Shahab Pathan, DPIRD
All experiments had six K treatments in a randomised block design with six replications. Individual plots had an area of 1.54m by 20m and seven rows at 0.22m row spacing.
We assessed crop K responses by measuring shoot K concentration at the beginning of stem elongation (Z30), shoot dry weight and K concentration at mid-anthesis (Z65), and grain yield. All the data of six K treatments were subjected to one-way analysis of variance. Treatment differences were separated by Fisher’s protected l.s.d. test and accepted at P = 0.05.
Table 2(a) Pre-sowing soil properties of K experiments in Avon Valley in 2021
Soil depth (cm) | N York | E Greenhills | S Greenhills | E Beverley | N York | E Greenhills | S Greenhills | E Beverley |
Colwell K (mg/kg) | pHca | |||||||
0–10 | 80 | 231 | 161 | 74 | 5.7 | 6.0 | 4.5 | 5.6 |
10–20 | 41 | 117 | 62 | 41 | 4.9 | 5.8 | 4.5 | 4.8 |
20– 30 | 35 | 116 | 68 | 34 | 5.4 | 6.0 | 4.8 | 5.8 |
30–40 | 33 | 113 | 41 | 31 | 5.5 | 6.3 | 5.2 | 5.7 |
40–50 | 27 | 124 | 32 | 27 | 5.6 | 6.0 | 5.6 | 6.0 |
0–30 | 52 | 155 | 97 | 50 | 5.3 | 5.9 | 4.6 | 5.4 |
Organic C% | Colwell P (mg/kg) | |||||||
0–10 | 2.2 | 1.9 | 1.3 | 1.3 | 41 | 39 | 44 | 38 |
10–20 | 1.2 | 1.4 | 0.6 | 0.6 | 25 | 29 | 21 | 14 |
20–30 | 0.8 | 0.7 | 0.5 | 0.4 | 12 | 13 | 18 | 6 |
30–40 | 0.6 | 0.5 | 0.4 | 0.2 | 11 | 7 | 9 | 4 |
40–50 | 0.3 | 0.4 | 0.3 | 0.2 | 7 | 5 | 5 | 5 |
0–30 | 1.4 | 1.3 | 0.8 | 0.8 | 26 | 27 | 28 | 19 |
Ammonium N (mg/kg) | Nitrate N (mg/kg) | |||||||
0–10 | 7 | 3 | 9 | 5 | 76 | 11 | 31 | 43 |
10– 20 | 4 | 3 | 5 | 2 | 18 | 16 | 13 | 10 |
20–30 | 3 | 3 | 5 | 1 | 14 | 8 | 10 | 7 |
30–40 | 2 | 3 | 3 | 1 | 9 | 6 | 6 | 5 |
40–50 | 2 | 3 | 2 | 2 | 5 | 4 | 3 | 5 |
0–30 | 5 | 3 | 6 | 3 | 36 | 12 | 18 | 20 |
Table 2(b) Pre-sowing soil properties of K experiments in Avon Valley in 2021
N York | NW Quairading | S York | E Beverley | N York | NW Quairading | S York | E Beverley | |
Colwell K (mg/kg) | pHCaCl2 | |||||||
0–10 | 53 | 42 | 25 | 105 | 5.1 | 6.0 | 5.9 | 5.6 |
10–20 | 31 | 32 | 21 | 63 | 4.8 | 5.4 | 4.7 | 5.3 |
20–30 | 26 | 43 | 24 | 57 | 5.4 | 5.3 | 4.6 | 6.0 |
30–40 | 20 | 64 | 30 | 36 | 5.6 | 5.3 | 4.8 | 6.0 |
40–50 | 18 | 62 | 27 | 38 | 5.8 | 5.2 | 5.1 | 6.3 |
0–30 | 37 | 39 | 23 | 75 | 5.1 | 5.6 | 5.1 | 5.6 |
Organic C% | Colwell P (mg/kg) | |||||||
0–10 | 1.6 | 0.8 | 1.0 | 1.0 | 42 | 25 | 31 | 42 |
10–20 | 1.1 | 0.4 | 0.5 | 0.7 | 18 | 15 | 28 | 24 |
20–30 | 0.9 | 0.3 | 0.2 | 0.8 | 8 | 15 | 15 | 9 |
30–40 | 0.6 | 0.3 | 0.1 | 0.3 | 5 | 8 | 9 | 6 |
40–50 | 0.5 | 0.3 | 0.2 | 0.3 | 6 | 7 | 5 | 6 |
0–30 | 1.2 | 0.5 | 0.6 | 0.8 | 23 | 18 | 25 | 25 |
Ammonium N (mg/kg) | Nitrate N (mg/kg) | |||||||
0–10 | 8 | 4 | 2 | 4 | 22 | 10 | 16 | 28 |
10–20 | 4 | 2 | 3 | 2 | 11 | 5 | 8 | 11 |
20–30 | 2 | 2 | 5 | 1 | 9 | 6 | 7 | 8 |
30–40 | 1 | 1 | 4 | 1 | 8 | 4 | 7 | 6 |
40–50 | 1 | 1 | 2 | 1 | 5 | 4 | 6 | 5 |
0–30 | 5 | 3 | 3 | 2 | 14 | 7 | 10 | 16 |
Results
Shoot K concentration at Z30
At Z30, shoot K concentrations differed between soil K treatments at N York, S Greenhills and E Beverley but not at E Greenhills (Table 3). Compared with nil K supply, shoot K% was significantly increased by 100 or 200kg K/ha at N York and by 25/25, 100 or 200kg K/ha at S Greenhills and E Beverley.
Table 3. Shoot K% at Z30 of four K experiments in Avon Valley in 2021
kg K/ha | N York | E Greenhills | S Greenhills | E Beverley |
nil | 2.20 a | 3.02 | 3.71 a | 2.58 a |
25 | 2.31 a | 3.05 | 3.84 ab | 2.75 ab |
50 | 2.38 a | 2.86 | 3.89 ab | 2.93 abc |
25/25 | 2.45 a | 2.89 | 4.06 bc | 3.07 bc |
100 | 3.12 b | 3.15 | 4.19 cd | 3.26 c |
200 | 3.67 c | 3.07 | 4.32 d | 3.87 d |
At each site, means (n = 6) with different letters in the same column differ significantly (P = 0.05)
Shoot dry weight at Z65
In 2021, shoot dry weight at N York was similar among the treatments of nil, 25, 50 and 25/25kg K/ha, but significantly increased at 100 and 200kg K/ha (Table 4). In contrast, there was no effect of the K treatments on shoot growth at the other three sites.
In 2022, shoot dry matter responded at Z65 to split application of 25 + 25kg K/ha at N. York and S. York, but the largest response was to 100 and 200 kg/ha, which increased shoot dry matter by more than 50 %. At S. York in 2022, all K rates increased shoot dry matter, but at 100-200kg K/ha the shoot mass doubled. At E. Beverley, the responses to K were only significant at 100kg K/ha, but otherwise, the effects were erratic and non-significant.
Table 4. Shoot dry weight (kg/ha) at Z65 of four K experiments in Avon Valley in 2021 and 2022
2021
kg K/ha | N York | E Greenhills | S Greenhills | E Beverley |
nil | 5948 ab | 9071 | 5896 | 8079 |
25 | 5717 a | 9487 | 6172 | 7488 |
50 | 6376 abc | 9203 | 6543 | 8408 |
25/25 | 6655 bc | 9583 | 5899 | 7621 |
100 | 6940 c | 9992 | 6718 | 7457 |
200 | 6950 c | 9520 | 6882 | 8026 |
2022
kg K/ha | N York | NW Quairading | S York | E Beverley |
nil | 6122 a | 5931 | 4204 a | 7724 ab |
25 | 6729 ab | 6060 | 6261 b | 8401 bc |
50 | 6922 ab | 5941 | 6517 bc | 8173 abc |
25/25 | 7604 b | 6381 | 6750 bc | 7524 a |
100 | 9436 c | 6111 | 7380 cd | 8702 c |
200 | 9890 c | 5931 | 8293 d | 8302 bc |
At each site, means (n = 6) with different letters in the same column differ significantly (P = 0.05)
Shoot K uptake at Z65
Shoot K uptake is the product of shoot K concentration and dry weight. Shoot K% at Z65 was increased by high K application e.g., 200kg K/ha at N York and 100, 200kg K/ha at E Beverley (Table 5), while shoot K uptake was increased by 100, 200kg K/ha at all four sites (Table 6).
Table 5. Shoot K concentration (%) at Z65 of four K experiments in Avon Valley in 2021
kg K/ha | N York | E Greenhills | S Greenhills | E Beverley |
nil | 0.97 a | 1.44 | 1.29 | 1.22 a |
25 | 1.22 a | 1.45 | 1.31 | 1.26 ab |
50 | 1.28 a | 1.32 | 1.36 | 1.50 b |
25/25 | 1.23 a | 1.47 | 1.41 | 1.42 ab |
100 | 1.28 a | 1.38 | 1.42 | 1.85 c |
200 | 1.78 b | 1.64 | 1.56 | 1.84 c |
At each site, means (n = 6) with different letters differ significantly (P = 0.05)
Table 6. Shoot K uptake (kg/ha) at Z65 of four K experiments in Avon Valley in 2021
kg K/ha | N York | E Greenhills | S Greenhills | E Beverley |
nil | 57.5 a | 130.1 a | 76.0 a | 97.4 a |
25 | 69.7 ab | 137.6 a | 80.3 ab | 95.4 a |
50 | 81.6 ab | 121.1 a | 89.1 ab | 125.9 bc |
25/25 | 81.4 ab | 141.3 a | 83.1 ab | 108.6 ab |
100 | 90.1 b | 137.1 a | 95.4 b | 136.9 c |
200 | 124.9 c | 169.4 b | 106.1 c | 148.7 c |
At each site, means (n = 6) with different letters in the same column differ significantly (P = 0.05)
Grain yield
Compared with nil-K supply, the treatments in 2021 of 25/25 split, 100 and 200kg K/ha significantly increased grain yield at N York and E Beverley, but there was no yield response at E Greenhills and S Greenhills (Table 7). In 2022, all K rates increased wheat grain yield at N York and S York, but not at the other sites. At S York on the sandy duplex soil, 25kg K/ha, the lowest rate applied was sufficient to achieve the maximum K response. By contrast, on the Red loamy earth soil at N York, the maximum grain yield required 200kg K/ha.
Table 7. Grain yield (t/ha) of K experiments in Avon Valley in 2021 and 2022.
2021
kg K/ha | N York | E Greenhills | S Greenhills | E Beverley |
nil | 4.84 a | 6.13 | 4.38 | 4.38 a |
25 | 4.92 ab | 6.05 | 4.40 | 4.51 ab |
50 | 5.0 ab | 6.18 | 4.51 | 4.64 abc |
25/25 | 5.11 b | 6.10 | 4.27 | 4.76 bc |
100 | 5.14 b | 6.12 | 4.45 | 4.89 c |
200 | 5.53 c | 6.16 | 4.50 | 5.27 |
2022
kg K/ha | N York | NW Quairading | S York | E Beverley |
nil | 5.4 a | 4.9 | 3.1 a | 5.7 |
25 | 5.8 b | 5.0 | 3.8 b | 5.9 |
50 | 6.2 c | 5.0 | 3.7 b | 5.8 |
25/25 | 6.1 c | 5.1 | 3.8 b | 5.7 |
100 | 6.5 d | 5.1 | 3.9 b | 5.8 |
200 | 6.7 d | 5.1 | 3.8 b | 5.8 |
At each site, means (n = 6) with different letters in the same column differ significantly (P = 0.05)
Conclusions
Soil test calibration curves were used to calculate critical ranges for Colwell K for the sites in this data set. For individual soil depths, the best calibration curve was for 20–30 cm (r2=0.94, critical range = 35–46mg/kg). The mean values for different soil sampling depths were also assessed with calibration curves, and using 0–30cm (r2=0.69, critical range = 39–66mg/kg) provided a better calibration than 0–10cm (r2=0.55, critical range = 47–102mg/kg).
The soils of all four sites in 2021 were loamy earths, classified as Kandosols or Dermosols, and contained >75mg K/kg Colwell K at 0–10cm, which is above the critical range of 43–57mg K/kg for Kandosols (yield >3t/ha; Brennan and Bell 2013). The new sites in 2022 have sandy duplex profiles, and soils had Colwell K in the 0–10cm layer in the range 25–53mg/kg apart from the value of 105mg/kg at East Beverley. Hence the 2022 sites were outside the critical Colwell K range suggested by wheat grain yield responses in the 2021 experiments.
A series of field trials have confirmed that K deficiency is now occurring in loam and duplex soils in WA (Ma et al 2022). Our analysis of trials completed so far indicates that testing below 10cm is required; in this data set, the mean Colwell K for 0–30cm provided a reasonable calibration with relative yield. The 0–30cm sampling depth also provides a good prediction of response to sulphur, phosphorus and lime (Anderson et al 2013, Neuhaus et al 2018, Anderson and Bell 2019).
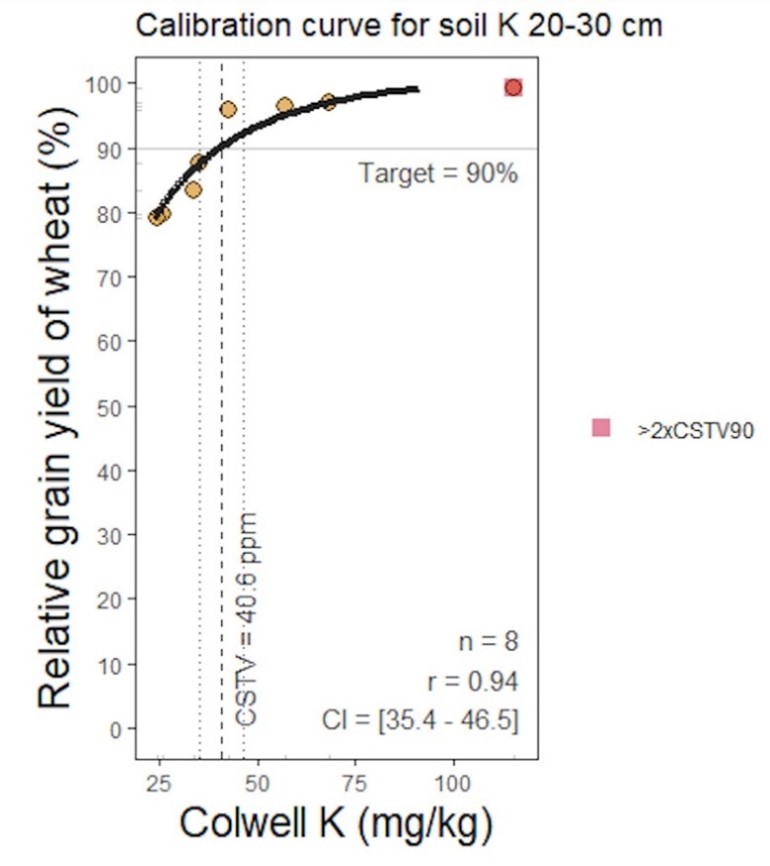
Figure 1. Relationship between relative grain yield of wheat and Colwell K at 20–30cm depth from K rates experiments between Northam and Beverley.
Acknowledgements
Field experiments were supported and managed by DPIRD and CSBP. They were part of the GRDC project ‘Increasing profit from N, P and K fertiliser inputs into the evolving cropping sequences in the Western Region’ (UWA1801-002RTX).
References
Anderson GC, Bell RW (2019) Wheat grain-yield response to lime application: relationships with soil pH and aluminium in Western Australia. Crop Pasture Sci. 70, 295–305.
Anderson G, Peverill K, Brennan R (2013) Soil sulfur – crop response calibration relationships and criteria for field crops grown in Australia. Crop and Pasture Sciences 64, 523–530.
Brennan RF, Bell MJ (2013) Soil potassium – crop response calibration relationships and criteria for field crops grown in Australia. Crop & Pasture Science 64, 514–522.
Ma Q, Bell R, Scanlan C, Neuhaus A (2022) Long-term rundown of plant-available potassium in Western Australia requires a re-evaluation of potassium management for grain production: a review. Crop Pasture Science 73, 981–996
Neuhaus A, Anderson G, Easton J (2018) Increasing sampling depth for phosphorus correlated more accurately with wheat yield responses in Western Australia. In 'Proceedings of the National Soil Science Conference Canberra 2018' (Eds N Hulugalle, T Biswas, R Greene and P Bacon) pp. 109–1110 (Soil Science Australia: Bridgewater, South Australia).
GRDC Project Code: UWA1801-002RTX,