Winter sown 100 day wheats for a changing Australian climate
Winter sown 100 day wheats for a changing Australian climate
Author: Timothy Green (CSU), Juan Sergio Moroni (CSU), Felicity Harris (CSU), Jim Pratley (CSU), Daniel Mullan (InterGrain), Greg Rebetzke (CSIRO) | Date: 14 Feb 2023
Take home messages
- Australian climate is changing, less autumn rainfall is shifting later in the season
- Implementation of double knock weed strategies, soil amelioration, and double cropping are all factors that could lead to sowing delays
- No commercial wheat varieties are available for mid to late winter sowing
- A short duration, 100-day wheat for mid-winter sowing needs to be developmentally fast to optimise anthesis timing and have high early vigour to grow adequate biomass before anthesis.
Background
Traditionally in southern Australia, wheat is sown after the autumn break, a period when rainfall is greater than pan evaporation over 7 days (Unkovich 2010), ensuring good germination, emergence, and subsequent early growth of the crop. It also ensures the plant’s requirements of vernalisation, photoperiod, and earliness per se are met so as to time flowering during the optimal flowering window in spring (Davidson et al. 1985; Trevaskis 2010; Sukumaran et al. 2016). However, since 1951, April-May rainfall has decreased by 38%, and the remaining seasonal rainfall is occurring later in the season (Cai et al. 2012). Growers are therefore faced with the decision either to sow dry and risk poor germination, or sow later and risk heat damage at flowering. Climate change is also increasing heat shocks and growers often choose the former (Ababaei and Chenu 2020).
Double knock herbicide strategies, soil amelioration, double cropping, and pest and disease control all take considerable time to complete prior to sowing. Time pressure is often highest when very short fallows associated with double cropping are implemented. The option to sow later in the season would allow growers more time to remediate soils and implement the control strategies. While growing wheat in a shorter timeframe has often been viewed as detrimental to yields, mostly due to insufficient time to build biomass, a factor in this perception is a lack of dedicated short season wheats. Rather, wheats are sown outside their optimum window, yields are comparatively poor, and the later sowing window is dismissed as non-profitable. This PhD project aims to investigate what characteristics a short season ‘100-day’ wheat would need to possess to be sown mid-winter, rapidly build biomass, flower within the optimum window, and still produce profitable yield. A ‘100-day’ wheat is defined as capable of being sown and reach anthesis within 100 days.
2021 field experiment methods
A field experiment was sown in 2021 at the NSW DPI Wagga Wagga field site. The aim was to investigate the impact of mid-winter sowing on wheat growth and development. It was hypothesised that wheat lines with greater early biomass and shorter time to flowering would out yield slower growing and developing lines. Ninety-six cereal lines provided by CSIRO, NSW DPI, and InterGrain included commercial wheat and barley varieties, international lines, and breeding lines. Two sowing times (TOS) occurred, June 7 (TOS1) and July 12 (TOS2). Plots were sampled throughout the season for biomass at key growth stages, in addition to final yield, tiller number and other derived measurements. A subset of the lines sown in 2021 were sown in June 2022 to continue the analysis of the key characteristics required for a winter sown wheat, although at the time of writing, final harvest results had not been analysed.
2021 field experiment key results
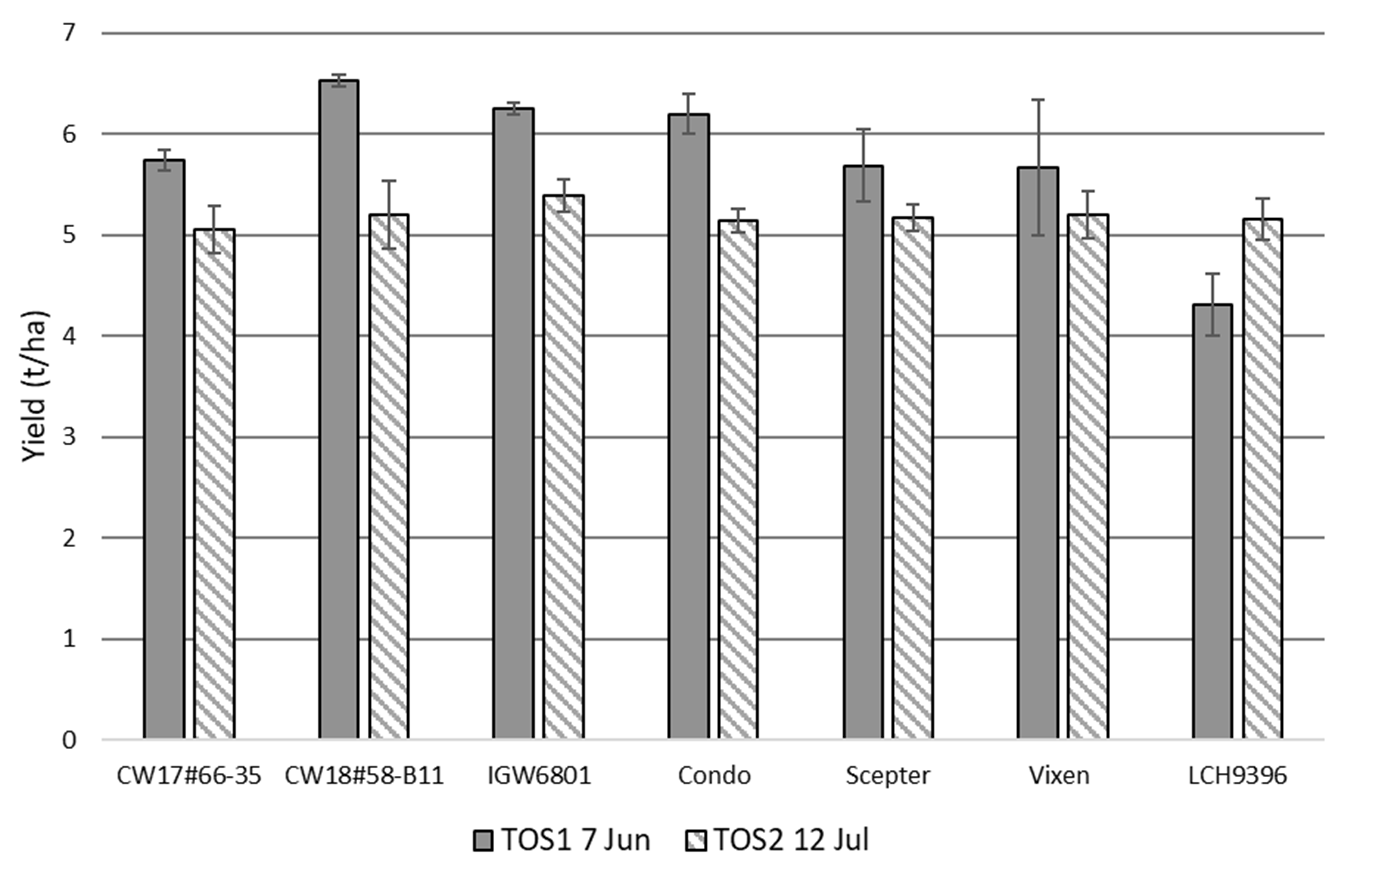
Sowing later in the season significantly (P<0.001) reduced yields from an average of 5.16t/ha in TOS1 to 4.46t/ha in TOS2 (-14.6%). Furthermore, later sowing reduced time to anthesis from an average of 133 to 107 days (P<0.001). Despite having been sown 35 days apart flowering occurred on October 18and October 27 respectively, only 11 days apart. Of the lines that yielded greater than 5t/ha in TOS2, the majority had higher yields in TOS1, although some, such as LCH9396, significantly out yielded their earlier sowing (Figure 1). That said, performance with later sowing was excellent given the shorter period for pre- and post-anthesis growth.
Figure 1. Harvest yields of a selection of wheat lines sown at two times in Wagga Wagga 2021. Error bars represent standard errors of the mean (n=2). LSD0.05 (Genotype) = 0.75t/ha, LSD (TOS) = 0.11t/ha, LSD (Genotype x TOS) = 1.07t/ha.
Condo, Scepter and Vixen in the above graph are protected under the Plant Breeders Rights Act 1994.
The plant characteristics with the greatest Pearson correlation (a measure of linear correlation of two data sets) with yield differed between times of sowing. The characteristics with greater impact on yield in TOS2 compared to TOS1 were plant height, anthesis biomass, first node biomass, and ground cover at booting (Table 1).
Table 1. Pearson correlation coefficients of wheat plant characteristics with yield at two times of sowing (June 7 and July 12) in Wagga 2021.
Characteristic | Pearson correlation coefficient to yield (t/ha) | ||
|---|---|---|---|
TOS1 | TOS2 | Change to TOS2 | |
Plant height | -0.151 | -0.02 | +0.132 |
Anthesis biomass | -0.059 | 0.109 | +0.167 |
First node biomass | -0.077 | 0.117 | +0.194 |
Harvest stem biomass | 0.591 | 0.387 | -0.204 |
Ground cover mid-booting | 0.176 | 0.407 | +0.231 |
Number of tillers | 0.481 | 0.457 | -0.025 |
Harvest index | 0.625 | 0.611 | -0.014 |
Grain number | 0.814 | 0.713 | -0.100 |
Controlled environment experiment methods
A growth room experiment is being conducted in the controlled environment facilities at Charles Sturt University, Wagga Wagga. The aim is to understand the impact of vernalisation and photoperiod alleles on the growth and development of wheat at low air temperatures. It is hypothesised that wheats possessing the spring alleles of key vernalisation genes would display less of a growth penalty under low temperatures than their winter counterparts due to their ability to maintain growth rates. This experiment is using 20 wheat lines including a set of near genetically identical ‘isogenic’ lines (NILs). The plant growth chambers were set as follows: 16h/8h light day/night, relative humidity 75%, light intensity (PPFD) 750 µmol m2 s1. Three treatments of constant temperature were applied, two ‘low temperatures’, 10°C and 16°C, and one ‘optimum’, 21°C.
With only three chambers available, the experiment was conducted as a split plot over time with each chamber acting as a replicate of a temperature treatment. At the time of writing only the 10°C and 21°C treatments have been conducted and as such only results from these treatments are presented. Plants were destructively sampled at 300, 400, 500, and 600 growing degree days (GDD) for leaf area, tiller and leaf number and biomass. Additionally, plants were scored for development throughout the experiment. The vernalisation and photoperiod alleles of the NILs are presented in Table 2.
Table 2. Photoperiod and vernalisation genes of the NILs. In the photoperiod columns ‘a’ denotes insensitivity, and ’b’ sensitivity. In the vernalisation columns, ‘a’ denotes insensitivity, and ‘v’ sensitivity.
Wheat | Maturity | Photoperiod | Photoperiod genes | Vernalisation genes | |||
|---|---|---|---|---|---|---|---|
PPD-B1 | PPD-D1 | VRN1-a | VRN1-b | VRN-d | |||
CSIROW077 | Fast spring | Insensitive | a | a | a | a | a |
CSIROW001 | Spring | Insensitive | a | a | v | a | a |
CSIROW005 | Weak spring | Insensitive | a | a | v | a | v |
CSIROW007 | Winter | Insensitive | a | a | v | v | v |
CSIROW046 | Winter | Sensitive | b | b | v | v | v |
Controlled environment experiment current results
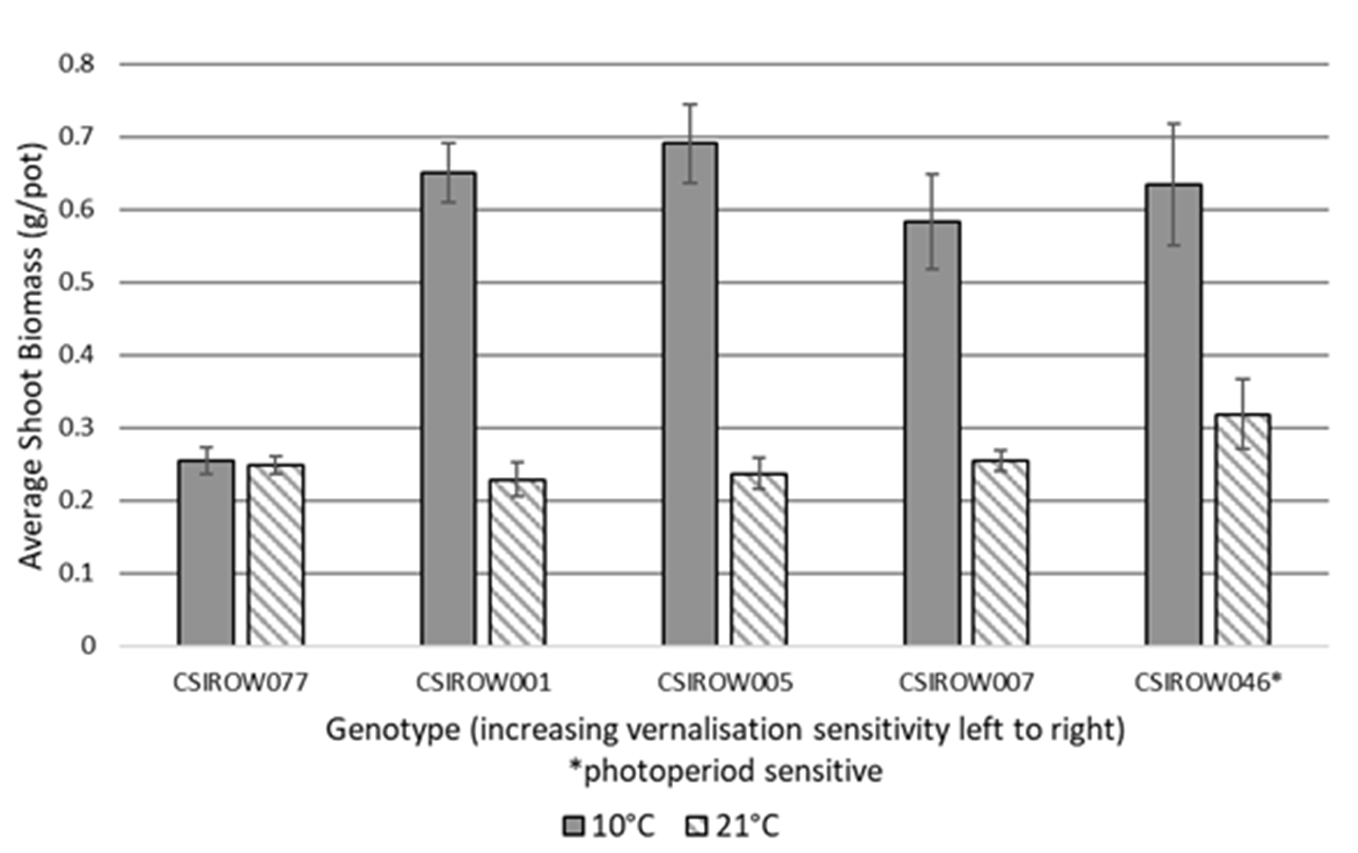
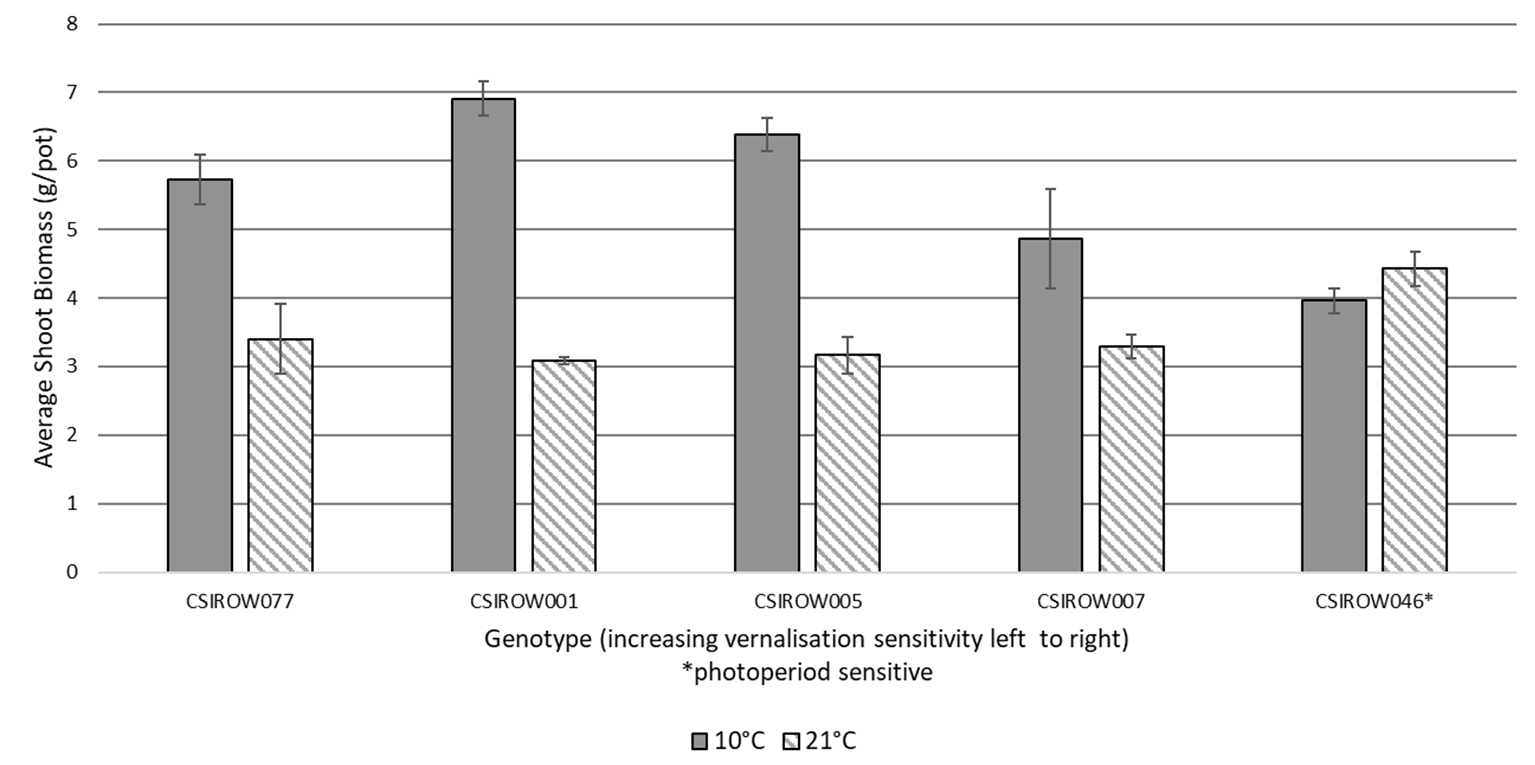
After 300GDD at a constant 10°C the full spring NIL CSIROW077 had significantly less biomass than the 4 NILs with increased vernalisation sensitivity (Figure 2). However, after 600GDD at 10°C only CSIROW001 had significantly greater biomass than CSIROW077 (Figure 3). This suggests CSIROW077 grew at a faster rate than the others between these growing degree days. When grown at a constant 21°C, after 300GDD no NIL produced significantly more biomass than another (Figure 2). After 600GDD CSIROW046 had significantly greater biomass than all NILs presented except for CISROW077 (Figure 3), but the differences between biomass production were not as large as when grown at a constant 10°C.
At 300GDD, all lines were phenologically similar, with approximately 1 extra leaf when grown at 10°C compared to 21°C. However, after 600GDD there were considerable differences between temperatures and lines. CSIROW077 progressed well past the others, especially at 21°C where the vernalisation sensitive lines had yet to switch to reproductive development (Table 3).
Table 3. Zadoks score of the controlled environment NILs after 300GDD and 600GDD at constant temperatures of 10°C and 21°C.
Growing degree days | 300 | 600 | ||
|---|---|---|---|---|
Constant temperature | 10°C | 21°C | 10°C | 21°C |
NIL | Mean Zadoks growth stage score | |||
CSIROW077 | 3.3 | 3.4 | 44 | 45 |
CSIROW001 | 4.1 | 3.1 | 32 | 30 |
CSIROW005 | 4.1 | 3.4 | 32 | 30 |
CSIROW007 | 3.9 | 3.3 | 31 | 30 |
CSIROW046 | 3.8 | 3.4 | 31 | 30 |
Figure 2. Shoot biomass of controlled environment grown wheat NILs after 300GDD at constant 10°C and 21°C. Error bars represent standard errors of the mean(n=3). LSD0.05 (genotype) = 0.139g/pot, LSD (treatment) = 0.044g/pot, LSD (genotype x treatment) = 0.197.
Figure 3. Shoot biomass of controlled environment grown wheat NILs after 600GDD at constant 10°C and 21°C. Error bars represent standard errors of the mean (n=3). LSD0.05 (genotype) = 1.092g/pot, LSD (treatment) = 0.345g/pot, LSD (genotype x treatment) = 1.544.
Conclusions
At Wagga Wagga in 2021, sowing in July compared to June reduced the grain yield by 14% (p<0.05), on average 0.7t/ha. However, in a commercial growing scenario with released varieties this yield reduction would likely be greater (Figure 1). It is possible that in a commercial setting, yield penalties associated with later sowing could be offset by improved weed control, reduced frost risk, and lower fertiliser requirements. Delaying sowing by 35 days shifted average anthesis date by only 11 days, likely due to rapid satisfying of vernalisation and photoperiod requirements. In breeding a 100-day wheat to suit this later sowing date, selections of characteristics such as greater early biomass and ground cover should be prioritised to maximise biomass and yield. Field experiments conducted in 2022 will add further validity to these claims.
In the controlled environment experiment, the more vernalisation sensitive NILs (CSIROW001, CSIROW005, CSIROW007, and CSIROW046), initially had greater growth under low temperatures compared to the NIL with no vernalisation sensitivity (CSIROW077). This effect was essentially non-existent when the same lines were grown in warmer temperatures. While it has been hypothesised that a 100-day wheat would need to possess the least possible vernalisation requirements in order to reach anthesis as quickly as possible, these results indicate this may result in a growth penalty in the low temperatures of mid-winter when they would be sown. In this controlled environment experiment, the fast-spring line had produced equivalent amounts of biomass by 600GDD.
Further work is required to validate these findings in field conditions, and to establish whether a fast-spring line such as CSIROW077 would be capable of offsetting an early growth penalty with optimum timing of anthesis and faster growth later in the growing cycle.
Acknowledgments
The authors thank Charles Sturt University for the use of the controlled environment facilities and the provision of the Australian Government Research Training Program stipend scholarship. The research undertaken as part of this project is made possible by the significant contributions and the support of the GRDC, the authors thank them for their continued support. Finally, the authors acknowledge the in-kind support of the NSW Department of Primary Industries for seed, trial space and operation, and all the technical staff who aided the completion of this research. Additionally, the authors thank CSIRO and InterGrain for their in-kind support and the provision of breeding lines.
References
Davidson J, Christian K, Jones D, Bremner P (1985) Responses of wheat to vernalization and photoperiod. Australian Journal of Agricultural Research 36, 347-359.
Sukumaran S, Lopes MS, Dreisigacker S, Dixon LE, Zikhali M, Griffiths S, Zheng B, Chapman S, Reynolds MP (2016) Identification of earliness per se flowering time locus in spring wheat through a genome‐wide association study. Crop Science 56, 2962-2672.
Trevaskis B (2010) The central role of the VERNALIZATION1 gene in the vernalization response of cereals. Functional Plant Biology 37, 479-487.
Unkovich M (2010) 'A simple, self adjusting rule for identifying seasonal breaks for crop models, Proceedings of 15th Australian Agronomy Conference.'
Contact details
Timothy Green
Charles Sturt University
Wagga, Wagga
Mb: 0477 497114
Email: tigreen@csu.edu.au
Date published: February 2023
GRDC Project Code: UCS2105-002RSX,


