Early plant sorghum – is it worth it? An economic comparison of two case studies from the Warra area
Early plant sorghum – is it worth it? An economic comparison of two case studies from the Warra area
Take home message
Rainfed grain cropping systems are complex and there are many reasons that growers may decide to adopt an early-sown sorghum strategy. We investigated with two case studies, each with and without early-sown sorghum, (1) sorghum followed by barley and (2) sorghum followed by chickpea.
- Early-sown sorghum tends to outperform traditionally sown sorghum under poorer climatic conditions but tends to underperform in better seasonal conditions
- Early-sown sorghum increased the likelihood of double-cropping into barley by 12.5% and chickpea by 23%
- Analysis showed:
* Case-study 1. Sorghum yields decreased by 95 kg/ha/year and barley increased by 115 kg/ha/year, and with similar commodity prices gross margins decreased by $3/ha/year.
* Case-study 2, sorghum yields decreased by 6 kg/ha/year and chickpea increased by 227 kg/ha/year, and due to higher chickpea prices gross margin increased by $153/ha/year. - Overall production risk did not increase with early-sown sorghum and was the best option 53% and 85% of the time in Case-study 1 and 2, respectively.
Introduction
In the Northern Grains Region (NGR) sorghum is typically sown in spring and summer, followed by a winter break-crop to reduce the impacts of pests and diseases. Therefore, when evaluating innovative crop options, the interaction between crops and the effects on profitability and risks across the rotation is important, in contrast to just comparing the yield of individual crops. The transition from summer sorghum to a winter chickpea crop can be achieved with long or very-short fallows, the latter often called ‘double cropping’. The former tends to increase the chickpea crop yields at the cost of lower cropping intensity (fewer crops overall), and the latter tends to have the cost of reduced winter crop yields. There may be an opportunity to sow sorghum in late winter, which risks reducing sorghum yields but provides more double-cropping opportunities, increasing cropping intensity. The expected annual gross margins of this strategy and risk of missed sowing opportunities are not well understood and require investigation.
This is a preliminary bio-economic modelling investigation into the potential use of early-planted sorghum (sown in late winter or very early spring) on two case study farms in the Western Downs, Qld. Crop modelling was undertaken with APSIM (Holzworth et al., 2014) based on Warra in Qld.
Case-study 1: seeks to increase cropping intensity whilst decreasing economic risk by being frugal on production input costs, including fertiliser. Barley is often grown after sorghum and double cropped if seasonal conditions permit.
Case-Study 2: seeks to increase farm profits by achieving high yields through high fertiliser rate. Commodity prices affect crop selection, therefore chickpea is often grown after sorghum and double cropped if seasonal conditions permit.
In these case studies we use APSIM to investigate the effects of using early sown sorghum within a cropping system on:
- Sorghum yields,
- Likelihood of double-cropping barley (Case-study 1) or chickpea (Case-study 2),
- Double-cropped barley and chickpea yields, and
- Economic returns and risk of early sown sorghum within the rainfed cropping system.
Methods
Biophysical modelling parameters
The modelling was performed at the system level to investigate the effects of adopting early-sown sorghum and the effects on the following crops. The water-limited crop yields of the rainfed cropping sequences with and without the early-sown sorghum option were estimated with the Agricultural Production System sIMulator (APSIM Version 7.10; Holzworth et al., 2014) crop modelling software using local climatic and soil data (26.9°S, 150.9°E). Simulations were run over 82 years (1940–2022) using daily climate data, including rainfall, evaporation, radiation, and maximum and minimum temperature, retrieved from the Bureau of Meteorology (BoM) Silo data set for the Brigalow Post Office (26.843°S, 150.789°E) weather station (BoM, 2022). The study site soil is characterised as a grey-vertosol in APSIM (APSoil: 37) for Warra (Western Downs, Qld; 26.922°S, 150.937°E) with a plant available water capacity (PAWC) of 209 mm. The crop sowing windows, varieties and fertiliser rates for the barley (B), chickpea (Ch) and sorghum (S) crops are provided in Table 1.
Table 1. Agronomic management rules and parameters of individual crops within the rainfed cropping system used in the APSIM crop simulation.
| Crop | Sowing rules | Sowing details | Nitrogen at sowing (N kg/ha) | |
|---|---|---|---|---|
Barley | Sow if PAW ≥100 mm from Must sow if 1st crop in rotation | Cv = Grimmett at | 30 | |
Chickpea | Sow if PAW ≥100 mm from Must sow if 1st crop in rotation | Cv = PBA Boundary at | 0 | |
Sorghum | Sow if PAW ≥150 mm | Cv = MR-Buster at | Case-study 1: 70 for system total N of 100 Case-study 2: 220 for system total N of 250 | |
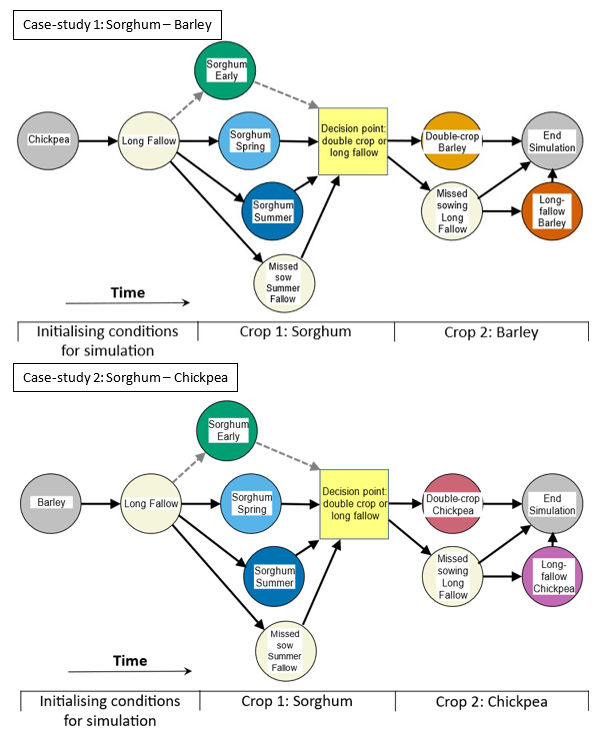
We based the analysis on two case studies, each with and without the early-sown sorghum option; called ‘traditional’ and the ‘early sown sorghum option’ cropping systems, respectively (Figure 1). The first crop is a ‘must sow’ and is used to generate random starting soil water and will be ignored with respect to yields and economic returns. The analysis will focus on the sorghum and the following grain or pulse crop.
Figure 1. Schematic representation of a cropping sequences including sorghum commonly used on the Western Downs, Qld.
Case-study 1
The traditional sequence (S-B) [excludes the dashed line in Figure 1] seeks to sow sorghum (S) in spring (based on Table 1 sowing rules), then summer, then goes into a missed sow summer fallow if neither of the spring or summer plants are possible. After which it seeks to double crop barley (B) or goes into a missed sowing long fallow and then seeks to sow a long-fallow barley crop or ends the simulation. The early sow sorghum option (ES-B) [includes the dashed line] with either early, spring, or summer sorghum (ES) crop then goes into a missed sowing long fallow if none of the sorghum sowings are possible, followed by barley (B).
Case-study 2
The traditional sequence (S-Ch) [excludes the dashed line] with either a spring or then summer sorghum (S) crop followed by a chickpea (Ch) crop. The early sow sorghum option (ES-Ch) [includes the dashed line] with either early, spring, or summer sorghum (ES) crop followed by chickpea (Ch).
Economic modelling parameters
The focus of this analysis is at the system level of sorghum and the following crop. Due to differing timelines with different cropping decisions, the economic returns in Australian dollars will be reported as average annual gross margin (GM; $/ha/year) (Eq.1). The average annual GM of each cropping sequence was calculated using simulated outputs of grain yield, N requirements and other variable costs as per AgMargins (2020) using the equation below (Eq 1). We used the 10-year average farm-gate grain prices and current variable cost for each crop (Table 2). The APSIM model estimates the amount of N required for plant growth, and we used this value to estimate the replacement N required for crop production and the associated cost. The long-term cost of N fertiliser is assumed to be $1.00/kg. Not all the N fertiliser is available to the plant and some is expected to be lost to the environment; we have budgeted on an average 30% N loss. Therefore, every unit of N fertiliser was set to cost $1.30/kg.
(Eq.1)
Table 2. Real 10-year median farmgate crop commodity prices (2011–2020) used in the economic analysis. The variable production costs (excluding N fertiliser and fallow sprays) were based on AgMargins (2020; Darling Downs), as were the estimated fallow management costs.
| Crop | Commodity price | Failed crop yield limit (kg/ha) | Harvested crop variable costs | Failed crop variable costs ($/ha) |
|---|---|---|---|---|
Barley | 266 | 190 | 241 | 100 |
Chickpea | 609 | 290 | 157 | 171 |
Sorghum | 263 | 226 | 408 | 124 |
Winter fallow | 38 | |||
Summer fallow | 67 | |||
Long fallow | - | 105 |
Growers will not invest in harvesting very low yielding crops. The yield threshold of a failed crop was set to be when the yield revenue is less than twice the harvesting cost. The failed crop yield limit (kg/ha) are provided in Table 2. The gross margins of failed crops include the sowing and fertiliser costs, and half the crop protection costs, as the crop may have been deemed a failed crop before or after crop protection is applied.
Results
Sorghum phenology
Although early sown sorghum is sown on average about a month earlier (24 August) than spring-sown sorghum (23 September) it only matures around 16 days earlier, 9 January vs 25 January (Table 3). That is, the early-sown sorghum crop is in the ground nearly two weeks longer than the spring-sown sorghum and over three weeks longer than the summer-sown sorghum.
Table 3. Average sorghum sowing and maturity dates and days from sowing for early-, spring- and summer-sown sorghum crops from 312 simulations (1940–2022) using the APSIM-Sorghum model on the Darling Downs, Qld.
| Sorghum | Sowing date | Maturity date | Days from sowing to maturity |
|---|---|---|---|
Early-sown | 24 Aug | 9 Jan | 137 |
Spring-sown | 23 Sep | 25 Jan | 124 |
Summer-sown | 21 Dec | 12 Apr | 112 |
Cropping intensity and yields
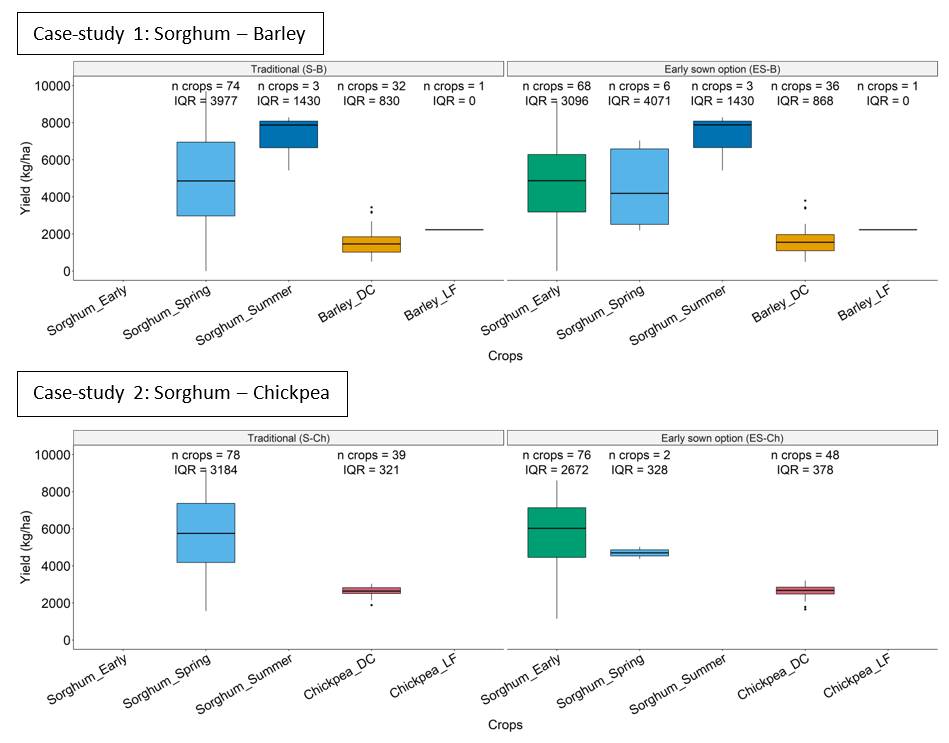
The adoption of early-sown sorghum had no effect on the number of sorghum crops grown, but it did increase the number of barley (33 vs 37) and chickpea (39 vs 48) crops grown (Figure 2). Although the early-sown sorghum crops tended to have higher median crop yield than the spring sorghum, the adoption of early sown sorghum still resulted in some sorghum being sown in spring which had lower median yields. Therefore, crop yields need to be evaluated at the system level, i.e. the change in long-term average yield for each crop with the adoption of early-sown sorghum.
Figure 2: Boxplots of (top) sorghum and barley grain yields for Case-study 1 with the traditional cropping system (S-B) and the introduction of the early-sown sorghum options (ES-B); and (bottom) Case-study 2 sorghum and chickpea grain yields with the traditional cropping system (S-Ch) and the introduction of the early-sown sorghum options (ES-Ch), simulated with the APSIM-Sorghum model on the Western Downs, Qld. The number of crops grown over the simulation period (1940–2022) is given by ‘n crops’. The whiskers are the minimum and maximum yields, and the box represents the 1st quartile, median and 3rd quartile. The interquartile range (IQR; range between the 1st and 3rd quartile) provides a method of quantifying yield variability.
The long-term average yield can be evaluated on the total number of crops and the cumulative yield for all of those crops over the 78 simulations for traditional and early-sown sorghum options in Case-study 1 and 2 (Table 4). The adoption of early-sown sorghum tended to decrease cumulative sorghum yield by 95 kg/ha/year (-2.0%) and 6 kg/ha/year (-0.1%) for Case-study 1 and 2, respectively. However, the cumulative grain yields for barley and chickpea increased by 115 kg/ha/year (19.9%) and 277 kg/ha/year (21.0%) for Case-study 1 and 2, respectively. As the yields of the post-sorghum crops appear similar (Figure 2), the long-term average yield increase (t/ha/year) with the adoption of early-sown sorghum is most likely due to more crops being planted. Therefore, this indicates an interaction between the sorghum sowing time and the following crop.
Table 4. Case-study 1 and 2 total crop yields (t/ha) from 78 simulations (1940–2022) for each of the crops with traditional sorghum sowing within a sorghum-barley (S-B) and sorghum-chickpea (S-Ch) cropping system and the introduction of the early-sown sorghum options (ES-B) and (ES-Ch), simulated using the APSIM-Sorghum model on the Western Downs, Qld. The average long-term yield changes (kg/ha/year) are also presented.
Cumulative yield (t/ha) | Case-study 1 | Case-study 2 | |||||
|---|---|---|---|---|---|---|---|
Sorghum | Barley | Sorghum | Chickpea | ||||
Traditional | S-B | 381 | 53 | S-Ch | 435 | 103 | |
Early-sown sorghum | ES-B | 374 | 62 | ES-Ch | 434 | 124 | |
Change | -7.4 | 9.0 | -0.5 | 21.6 | |||
Long-term average yield change | -95 kg/ha/yr | 115 kg/ha/yr | -6 kg/ha/yr | 277 kg/ha/yr | |||
Interactions between sorghum and the following crop
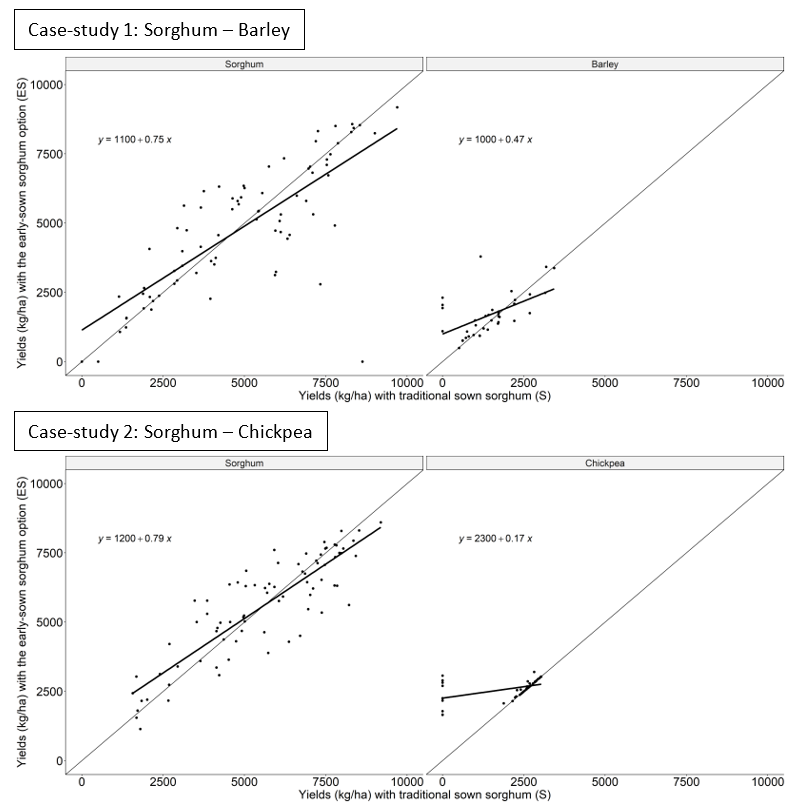
Although the adoption of early-sown sorghum tended to have only a slight decrease in the long-term average sorghum yield (Table 4), crop yields in individual years can vary greatly (Figure 3). There are years where the use of early-sown sorghum can result in higher crop yields than the traditional cropping systems (above the one-to-one line Figure 3), and other years where it greatly underperforms, 8.6 t/ha with traditional sorghum (x-axis) vs 0 t/ha with early-sown sorghum (y-axis) in Case-study 1. In both Case-study 1 and 2, the sorghum regression analysis (trend line) indicates that early-sown sorghum tends to do better than the traditional system in poor years (lower yields) but tends to underperform in better years (higher yields). At the system level this can have implications on the following crop with respect to carry over soil moisture and nutrients.
The flattening of the trend line in the crop post sorghum is primarily driven by the additional crops grown with the adoption of early-sown sorghum practices. These occurrences are shown as 0 t/h on the x-axis against the crop harvested on the y-axis in both Case-study 1 for barley and Case-study 2 chickpea crops (Figure 3). There were a couple of instances where barley yields had decreased with the adoption of early-sown sorghum – being those years below the one-to-one line. However, with the adoption of early-sown sorghum, all chickpea crop yields remained the same or increased, being on or above the one-to-one line. The system effect of adopting early-sown sorghum and the interactions between crop yields with differing crop values is best evaluated with economic analysis.
Figure 3. Crop yields of individual years of Case-study 1 with sorghum and barley (S-B) and Case-study 2 sorghum with chickpea (S-Ch) in individual years with the traditional cropping system (S; x-axis) and the introduction of the early-sown sorghum options (ES; y-axis), simulated using the APSIM-Sorghum model on the Western Downs, Qld. The solid diagonal line is the 1:1 line, and the bold line represents the linear regression.
Economic returns and risk associated with adopting early-sown sorghum
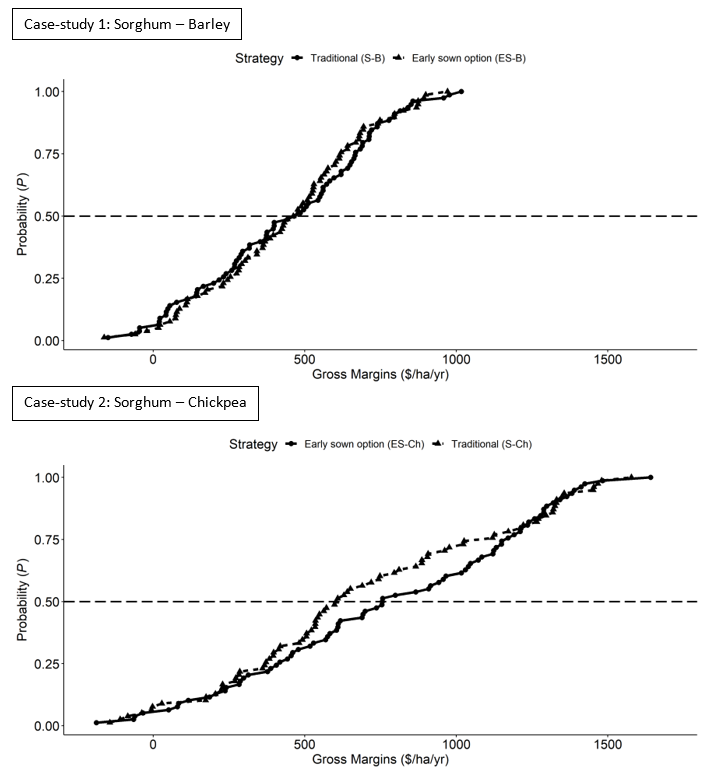
The cumulative distribution function for the range of total gross margins for each crop simulation (Figure 1) divided the crop duration is the average gross margin per hectare per year (Eq.1) for Case-study 1 and 2. In Case-study 1, although the adoption of early-sown sorghum tended to decrease sorghum yield and increase barley yield it had little impact on the economic outcomes (Figure 4). Early-sown sorghum adoption tended to result in higher gross margins in poor conditions (P<0.5) and lower gross margins in better climatic conditions (P>0.5), but only marginally. Early sown sorghum decreased the expected gross margin by $3/ha/year and was the best option 54% of the time offering a higher gross margin (Table 5). Therefore, adoption did not affect system risk. In Case-study 2, the adoption of early-sown sorghum had clear economic benefits (Figure 4). It increases the expected gross margin by $153/ha/year and offered higher gross margins 85% of the time (Table 5). Additionally, this adoption did not increase downside risk (worst-case scenario) or affect upside risk (best-case scenario). That is, it increased expected returns without any additional risk.
Table 5. The expected (median P = 0.5, Figure 4) gross margin averaged per year (GM; $/ha/year), expected change in gross margins, and frequency of being the best option Case-study 1 (sorghum- barley) with the traditional cropping system (S-B) and the introduction of the early-sown sorghum options (ES-B). As well as Case-study 2 (sorghum-chickpea) with the traditional cropping system (S-Ch) and the introduction of the early-sown sorghum options (ES-Ch). Using 78 simulations (1940–2022) with APSIM-Sorghum model on the western Downs, Qld.
Case study | Expected average gross margins ($/ha/year) | Expected change in GM with early sorghum ($/ha/year) | Frequency | |
|---|---|---|---|---|
Traditional | Early-sown sorghum | |||
1: Sorghum-barley | 465 | 462 | -3 | 53% |
2: Sorghum–chickpea | 603 | 756 | 153 | 85% |
Figure 4. The probability of gross margins averaged per year for Case-study 1 (sorghum–barley) with the traditional cropping system (S-B) and the introduction of the early-sown sorghum options (ES-B). As well as Case-study 2 (sorghum–chickpea) with the traditional cropping system (S-Ch) and the introduction of the early-sown sorghum options (ES-Ch). The expected or median gross margin (x-axis) is at P=0.5 (y-axis), the minimum gross margin is at P=0.0 and the maximum is at P=1.0 from 78 simulations (1940–2022) for each APSIM-Sorghum model run on the Western Downs, Qld.
Conclusion
Rainfed grain cropping systems in the NGR are complex and there are many reasons that growers may decide to adopt an early-sown sorghum strategy into their system, including improving financial returns, risk mitigation or from an operational management perspective. Early-sown sorghum tends to outperform traditionally sown sorghum under poorer climatic conditions but tends to underperform in better seasonal conditions. Although sorghum yield can change significantly from year-to-year between the traditional sowing times and the early-sown sorghum strategy, the sorghum yield distributions and average crop yields only changed marginally (<2.0%) at the system level in both Case-study 1 (sorghum-barley) and Case-study 2 (sorghum-chickpea) (Table 4). However, early-sown sorghum increased the likelihood of double-cropping barley by 12.5% and chickpea by 23% (Table 2). The net effect was that in Case-study 1 the average sorghum yield decreased by 95 kg/ha/year but barley increased by 115 kg/ha/year over the 78 simulations (Table 4). As sorghum and barley have similar commodity prices (Table 2), the average gross margin had only decreased by $3/ha/year (Table 5). In Case-study 2, the average sorghum yield had only decreased by 6 kg/ha/year, but average chickpea yield increased by 277 kg/ha/year; and as chickpea prices are 2.6 times greater than sorghum (Table 2), the average gross margin over time had increased by $153/ha/year or 25% (Table 5). The overall production risk had not increased in either case study with the adoption of early sown sorghum (Figure 4) and was the best option 53% and 85% of the time in Case-study 1 and 2, respectively (Figure 4 and Table 5).
Although the Case-study 2 sorghum-chickpea gross margins appeared substantially greater than the Case-study 1 sorghum-barley rotation (Figure 4 and Table 5), this analysis is not suggesting that one is the better option as both barley and sorghum are commonly included within rain-fed cropping systems and we only analysed a segment of those cropping systems. Rather, our analysis indicates that in the long-run early-sown sorghum is no more risky than traditional sowing practices and there tends to be improved economic returns.
There may be other reasons to adopted early-sown sorghum that have not been included in this analysis. Inclusion can allow the relocation of farm labour and machinery from when there is high demand for sowing other summer crops. Or it allows a grower to get a summer crop sown before a storm event where a paddock becomes and remains too wet to sow later in the season, which has occurred within the NGR in recent years.
References
AgMargins. (2020). AgMargins Database from Queensland Government, Department of Agriculture and Fisheries. Retrieved 13/03/2020 http://agmargins.net.au/
BoM. (2022). SILO Data Drill System. Bureau of Meteorology Australia, (http://www.longpaddock.qld.gov.au/silo/).
Holzworth DP, Huth N I, deVoil PG, Zurcher EJ, Herrmann NI, McLean G, Chenu K, van Oosterom EJ, Snow V, Murphy C, Moore AD, Brown H, Whish JPM, Verrall S, Fainges J, Bell LW, Peake AS, Poulton PL, Hockman Z, Thorburn PJ and Keating BA (2014) APSIM - Evolution towards a new generation of agricultural systems simulation. Environmental Modelling & Software, 62, 327-350. doi: 10.1016/j.envsoft.2014.07.009
Acknowledgements
This research was made possible by the significant contributions by growers through both case study host farmers and the support of the GRDC, DAF Qld., UQ, and NSW DPI (UOQ 1808-001RTX).
Contact
Andrew Zull
Department of Agriculture and Fisheries
Toowoomba, Queensland
Email: andrew.zull@daf.qld.gov.au
Date published: July 2023
Varieties displaying this symbol beside them are protected under the Plant Breeders Rights Act 1994
GRDC Project Code: UOQ1808-001RTX,


