The influence of row configuration in sorghum on yield and residual soil water at harvest west of the Newell highway
Author: Loretta Serafin (NSW DPI), Daniel Rodriguez (University of Queensland), Peter DeVoil (University of Queensland), Jeremy Whish (CSIRO) and Mark Hellyer (NSW DPI) | Date: 19 Jul 2023
Take home messages
Based on the results of four experiments conducted west of the Newell highway, the following comments can be made:
- Grain yields and WUE were better from the solid row configuration compared with the double skip (DS) configuration in 3 experiments where grain yields were >3000 kg/ha.
- In the low yielding season (2014-15) (<2000 kg/ha) there was no difference in grain yields between row configurations.
- The suggested plant density for this environment based on the results from these experiments is 3.0 and 5.0 plants/m2 to optimise the balance between maximum grain yield potential and seed costs.
- Row configuration does influence residual water post-harvest. In higher yielding seasons (>3000 kg/ha), the DS configurations left soil water in the middle of the rows.
- Narrow rows extracted soil water to a greater depth than the wider rows, especially in the 60–120 cm soil layers.
- In 50% of experiments more soil water remained in the mid row compared to under the plant row but this response was not consistent in all configurations, mostly it was double skip.
Introduction
Grain sorghum production in the area west of the newell highway northern NSW is influenced by commodity price, seasonal outlook and overall confidence in the reliability and profitability of the crop. Varying row configuration and plant population have been management options used by growers and advisors to improve yield, reduce risk and optimise water use. The need to balance the challenge of minimising heat stress and maximising water use in this environment is front of mind in most seasons.
Broadacre row configurations commonly vary from a solid plant (100 cm) through to wide rows (150 cm), as well as single skip (SS) and double skip (DS) configurations. Plant populations have varied from low target densities of 1.5 plants/m2 up to 5.0 plants/m2.
There has been a strong emphasis on the need to have a full profile of soil water prior to planting sorghum west of the Newell highway due to the erratic nature of summer rainfall and common occurrence of high temperatures in December and January.
Previous work, such as the paper published by Whish et al (2005), modelled the effects of varying row configuration in sorghum in north-eastern Australia using APSIM. Whish et al used four trials conducted east of the Newell highway in northern NSW and six trials in Qld to parameterise the APSIM model. Long term simulations were then conducted to consider the effects of row configuration on sorghum yield reliability. Whish et al (2005) concluded that “solid configurations were more risky than skip configurations, but on average provided the highest yield” however did not fully explore the implications of soil water remaining post-harvest.
Little experimental research has been conducted in the environment west of the Newell highway, both on row configuration as well as considering the amount of soil water remaining after the sorghum crop is harvested.
Sorghum is only one crop in the rotation, as such we need to aim to optimise yields from this current crop as well as start planning for the next crop in the sequence.
Gathering the data
Four dryland experiments were conducted near Gurley, NW NSW in 2010-11, 2012-13, 2014-15 and 2015-16. All paddocks were previously sown to wheat and then long fallowed into sorghum using zero tillage. Two experiments were planted in the spring (2010-11 and 2015-16) and two were summer planted (2012-13 and 2014-15).
The experiments included 4 row configurations (based on 100 cm spacings) (Figure 1):
- solid (100 cm)
- super wide (SW) (150 cm)
- single skip (SS)
- double skip (DS).
Three target plant populations were included each season, with 3.0 and 5.0 plants/m2 included in all years while 7.0 plants/m2 was included in the first season and then replaced with 1.5 plants/m2 in following years.
Three hybrids were included in the experiments, however only one, MR43, was selected for soil water monitoring.
 Figure 1. Row configurations (solid lines = planted, dashed lines = skipped)
At Gurley, the soil type is a grey vertosol with an estimated plant available water capacity (PAWC) of 216 mm for sorghum to a depth of 120 cm. Starting soil water in each of the 4 seasons varied from close to full to less than half full.
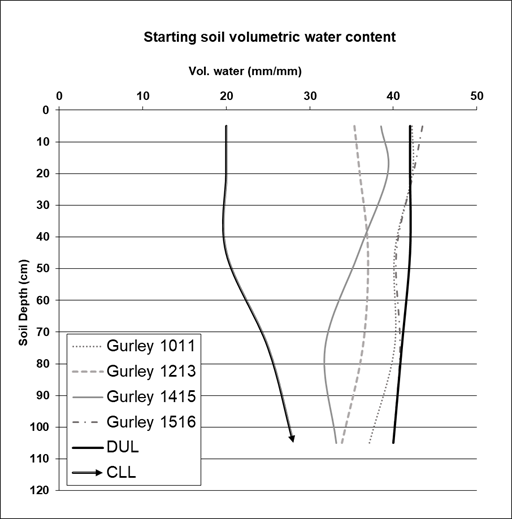
The highest level of starting soil water was in the 2010-11 and 2015-16 seasons, when plant available water (PAW) was measured to be 86% and 90% of drained upper limit (DUL), respectively. Starting soil waters in the 2012-13 and 2014-15 seasons were lower at 63% and 43% of DUL respectively. Figure 2 shows the DUL, crop lower limit (CLL) and volumetric water content of the four experiments at the start of the season. 2.

Figure 2. Starting soil volumetric water content at Gurley for each year as well as the drained upper limit (DUL)
and crop lower limit (CLL).
The long-term average growing season rainfall (GSR) for the spring planted experiments was 323.4 mm, while the summer planted experiments long term average GSR was 332.9 mm.
Rainfall distribution varied between seasons. In 2010-11 the site received 50 mm more than the average GSR with a total of 370.6 mm and total available water of 555.6 mm. The experiment reached flowering in mid-December which coincided with a rainfall event of 69 mm which minimised moisture stress. In the 2015-16 experiment, rainfall was received in November close to flowering and post crop maturity in January. The experiment had a total of 518 mm available water, 323.3 mm of this was received as GSR.
The 2012-13 season combined moderate starting soil water levels with above average in-crop rainfall of 485.1 mm to have a total of 621.5 mm water available. This experiment had the most water available of all four seasons.
In contrast the 2014-15 experiment received 276.5 mm in-crop rainfall and started with a soil profile less than half full, which meant it had the lowest total water available of all the trials conducted, at 369.3 mm.
The experiments were harvested to collect data on grain yield and quality and then each of the MR43 plots was cored to determine the amount of soil water remaining. Soil cores were taken both on the plant row and mid-row (in between the sorghum plant rows) (Figure 3). The soil samples were segmented by depth as 0–10, 10–30, 30–60, 60–90 and 90–120 cm down the soil profile.

Figure 3. Soil sampling locations for each treatment
Results
Crop yield
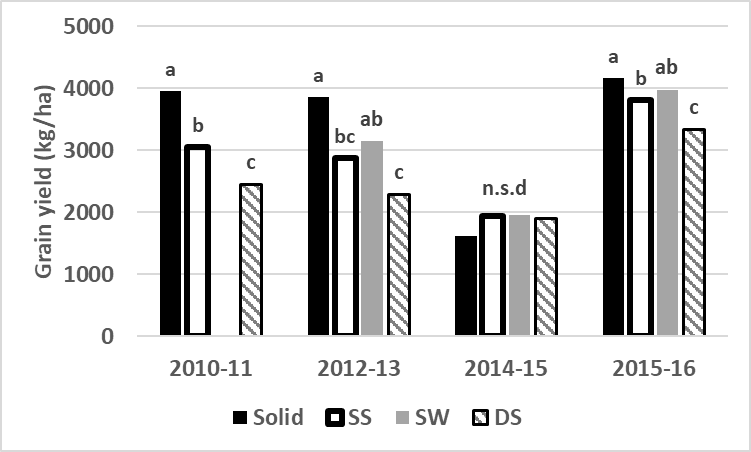
In 3 seasons, (2010/11, 2012/13 and 2015/16) the average grain yields were >3000 kg/ha. For these higher yields there was a consistent response of higher grain yields from narrower row configurations. In the low yielding 2014-15 season, yields were <2000 kg/ha, with no difference in grain yields between the row configurations. The solid configuration provided significantly higher grain yields compared to the DS in 3 of the 4 seasons.

Figure 4. Grain yield at 0% moisture from the 4 dryland experiments across row configurations. Letters indicate statistical difference at the at P=0.05 level. Individual site statistics; 2010-11 lsd: 450.6 kg/ha, 2012-13 lsd: 831.0 kg/ha, 2014-15 n.s.d and 2015-16 lsd: 201.6 kg/ha.
These findings support the unpublished results from 13 other experiments conducted in the region: west of the Newell highway to Walgett under this project between 2009 -2016.
Of these additional 13 experiments, 6 sites had average yields < 2000 kg/ha and 7 sites had average yields >2000 kg/ha. The lower yielding data set (<2000 kg/ha) included 4 experiments which had no significant difference in yield for varying row configuration. The other 2 experiments showed higher yields from wider row spacings but at yield levels less than 500 kg/ha.
The remaining seven experiments in data set with average yields >2000 kg/ha provided consistent yield responses; solid plant outyielded double skip in all experiments and outyielded single skip in 6 of the 7 experiments.
Considering only the Gurley experiments in this paper, plant density also affected grain yield. In the 3 experiments comparing 1.5, 3.0 and 5.0 plants/m2, the lowest plant density was always significantly lower yielding than the 5.0 plants/m2. Only in the lower yielding 2014-15 experiment was there no difference between the target plant densities of 1.5 and 3.0 nor 3.0 and 5.0 plants/m2. The data suggests establishing a plant population of between 3.0–5.0 plants/m2 in this environment but further interrogation of the other 13 experimental data sets in this region is underway
Sorghum is a hybrid crop with new seed needing to be purchased each season which is a considerable input cost for farmers so the balance here is always to optimise yield and minimise expenditure.
Water use efficiency
In 3 seasons (2010-11, 2012-13 and 2015-16) water use efficiency (WUE) declined as row spacing increased, while in 2014-15 no significant differences (n.s.d) were recorded (Table 1). The solid configuration provided the highest WUE. Under dryland conditions where grain yield was >3000 kg/ha, the DS configuration was unable to compensate, regardless of the plant density, and capitalise on the season. As a result, yield was capped and profit lost.
The average experiment WUE was similar for the 2010-11 and 2012-13 seasons at 6.4 and 6.6 kg grain/mm of water. WUE was higher in the 2015-16 season at 9.0 kg/mm of water and lower in the 2014-15 season at 6.0 kg grain/mm of water (Table 1).
In 3 of the seasons the solid configuration had higher WUE than the DS. The differences between the solid and SS or SW configurations were inconsistent.
Table 1. Water use efficiency (kg/mm) under varying row configurations.
Site | Solid | Single skip | Super wide | Double skip | Lsd |
|---|---|---|---|---|---|
Gurley 10/11 | 8.00a | 5.93b | - | 5.20b | 0.82 |
Gurley 12/13 | 8.34a | 6.05b | 6.75ab | 5.41b | 1.80 |
Gurley 14/15 | 6.10 | 7.60 | 5.60 | 7.00 | n.s.d |
Gurley 15/16 | 9.79a | 8.91b | 9.30ab | 7.96c | 0.85 |
* letters indicate statistical difference at the P=0.05 level | |||||
Residual soil water post-harvest
Following the sorghum harvest all plots of MR 43 were soil cored to determine finishing soil water. Samples were dried and results converted to mm of PAW.
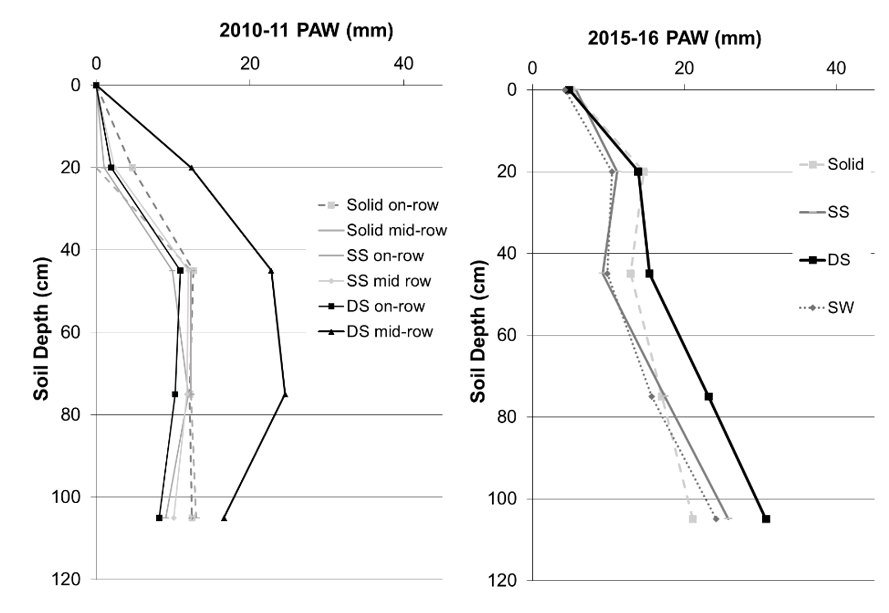
In 2010-11 there was no difference in 0–10 cm surface layer, however at all other soil layers, there was more PAW in the mid-row under DS than the other row configurations and positions (Figure 5, LHS).
In 2015-16 there was no difference between the on-row and mid-row positions of coring, but there was between row configurations with more water under the DS, particularly at the 60–90 and 90–120 cm soil layers (Figure 5, RHS).
Figure 5. Soil water remaining post-harvest in LHS. 2010-11, and RHS. 2015-16.
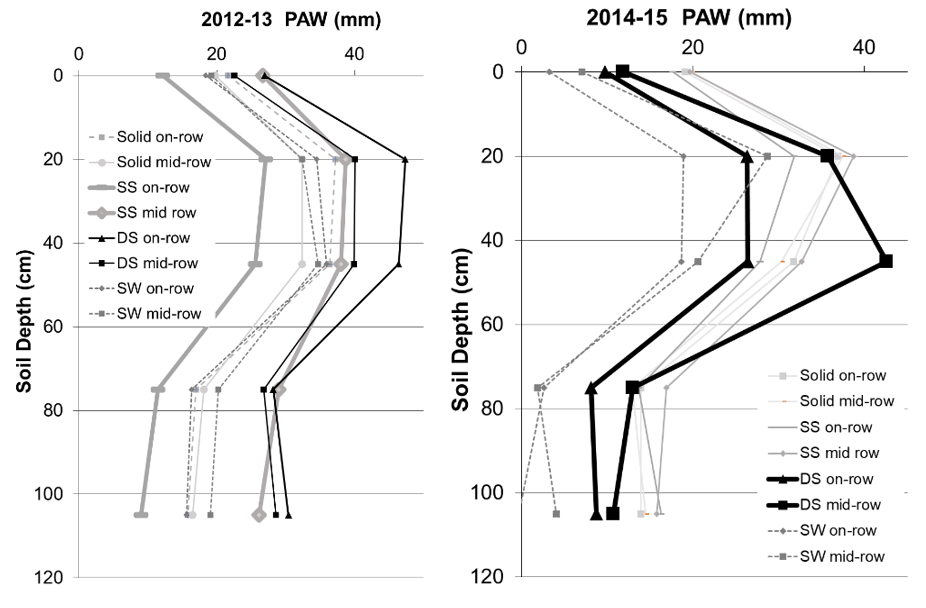
In 2012-13, which combined high rainfall and a reasonable (63%) starting soil profile, the largest differences were in SS configuration between the on-row and mid-row positions. The 2014-15 season was dry and had late in-crop rainfall leaving more water in the profile post-crop, particularly in the mid row area (Figure 6).
Figure 6. Soil water remaining post-harvest in LHS. 2012-13, and RHS. 2014-15.
Conclusions
These 4 experiments show that solid 100 cm row configurations in the environment west of the Newell highway can have both yield and water use benefits. Grain yield and WUE were improved from the narrowest, solid row configuration compared with the DS configuration.
Wide or skip row configurations were initially used by growers to save soil water for the post-flowering period as a tool to assist in stabilising grain yields and to minimise the risk of crop failure. Most of the data to support these strategies in northern NSW was collected from sites east of the Newell highway.
In this data set, results from three experiments conducted west of Gurley in above average yielding seasons (>3000 kg/ha), showed higher yields from solid plant compared to the skip configurations In the one experiment (2014-15) which produced yields <2000 kg/ha there was no benefit from the wider configurations over the solid configuration.
These findings support the results from the other 13 experiments conducted in the region west from the Newell highway to Walgett under this project, for which the data remains unpublished as outlined in the results section.
Results from these four experiments suggest that low plant densities e.g., 1.5 plants/m2 were consistently lower yielding than the 3.0 and 5.0 plants/m2. The one experiment with a higher plant density of 7.0 plants/m2 (2010-11) gave no benefit compared to the 5.0 plants/m2. Further experimental results need to be considered to definitively define the optimum plant density. The optimal plant density for this environment is between 3.0 and 5.0 plants/m2 to optimise the balance between grain yield potential and seed costs.
In these experiments WUE was improved under the solid 100 cm row spacing.
The measurement of soil water post-harvest highlighted that in higher yielding seasons, the DS configurations left soil water in the middle of the rows. In 2 of the 4 years, more soil water remained in the mid row compared to under the plant row. This response was not consistent in all configurations, mostly it was double skip which had more moisture under the mid row.This indicates that plants have not been able to extract water as efficiently from the mid row area, particularly as the distance from the plant row increases. In a solid row configuration, it is only 50 cm to the mid row area, whereas under a DS this distance increases to 150 cm. The root mass decreases as the distance from the plant increases and it seems the plants are less efficient at being able to extract water at this distance.
In 3 out of 4 years narrow rows extracted soil water to a greater depth than the wider rows, especially in the 60–120 cm soil layers (Figures 5 & 6).
Row configuration does influence residual water post-harvest. Any residual water is a lost opportunity for crop production in that season.
This remaining water in the soil profile water is not being utilised by the current crop but will be available for a following crop.
Acknowledgements
The research undertaken as part of this project is made possible by the significant contributions of growers through both trial cooperation and the support of the GRDC, the author would like to thank them for their continued support.
Sincere thanks to Scott Carrigan, Gurley for hosting the trials and Gary Onus, Nutrien, Moree for his assistance.
Technical support provided by Ben Frazer, Peter Formann, Alan Bowring, Peter Perfrement, Jim Perfrement, Nicole Carrigan, Delphi Ramsden and Rod Bambach is gratefully acknowledged. Pacific Seeds is gratefully acknowledged for their supply of research seed.
References
Whish J, Butler G, Castor M, Cawthray S, Broad I, Carberry P, Hammer G, McLean G, Routley R, Yeates S. 2005 Modelling the effects of row configuration on sorghum yield reliability in north-eastern Australia. Australian Journal of Agricultural Research. 2005 Feb 1;56(1):11-23.
Contact details
Loretta Serafin
Research Agronomist, Summer Grains
NSW Department of Primary Industries
4 Marsden Park Road Calala
Ph: 0427 311 819
Email: loretta.serafin@dpi.nsw.gov.au
Date published: July 2023
GRDC Project Code: DAN00150,
Was this page helpful?
YOUR FEEDBACK


