Using elevation to refine wheat planting dates
Using elevation to refine wheat planting dates
Author: Matt Gardner and Skye Traill (AMPS Research) | Date: 19 Jul 2023
Take home messages
- Of all the agronomic ‘levers’ available to growers planting date offers one of the best options to increase yield potential
- There are drastic changes in frost risk with only small changes in elevation (20–50 m), which presents significant opportunity to push planting dates forward without necessarily increasing frost risk
- Lower points in the landscape/paddock have more frost events with greater duration compared to higher elevations. Therefore, there is slower accumulation of growing degree days at these lower points in the landscape, consequently slowing the development of the crop
- There is little variation in maximum temperature across elevations. Therefore, in lower parts of the landscape, where the frost risk persists longer into the season, the heat stress will start at the same time as higher elevations. This narrows the window for optimum conditions for flowering crops.
Introduction
Major management ‘levers’ that can be manipulated to achieve yield potential include planting date, planting configuration (row spacing and seeding rate), variety choice, disease, weed and pest control, nitrogen, phosphorus and other nutrition. Of these ‘levers’ planting date can have the greatest impact on achieving yield potential and is one of the few management tools that can easily be changed with negligible additional cost. The degree that planting date will determine grain yield potential, will be greatest in dry and hot springs and least in wet and mild springs.
Planting date determines when the plant will reach anthesis. Bringing sowing dates earlier increases yield potential through increased biomass accumulation and by extending the length of the grain filling period under cooler spring temperatures. However, earlier planting dates also increase the risk of incurring a frost during flowering. Sowing later to minimise frost risk then pushes crops to fill grain under hotter spring conditions leading to lower yield potential. The key question is are we losing yield with current sowing dates and what other tools are available to move our sowing dates as early as possible without taking on board unacceptable frost risk. Growers generally take a conservative approach to planting date as the fear of frost damage influences their decisions to a greater extent than the often intangible yield loss from heat stress during grain fill.
Currently growers and agronomists rely heavily on previous experience, local weather station data, sowing guides and predictive models such as CliMate or APSIM to determine planting dates. The problem for growers and agronomists is that typically the local weather stations are located some distance from paddocks or farms which then requires a degree of interpretation. Models are also based on these weather stations, which means growers can only use results as a guide. In relatively flat areas, like Walgett, the difference between the individual farm and the weather station may be very small. For other locations, like the Liverpool Plains, where there is a large variation in elevation there is likely to be large differences across farms in their temperature regime as compared to the Gunnedah or Quirindi weather stations.
This project aimed to reduce some of the interpretation required by growers and agronomists by looking at the impact that elevation has on frost risk and subsequent planting dates across different elevations across the landscape. However, the project hasn’t taken into account other factors that will influence frost risk or cold air drainage such as aspect, drainage, tree lines and the point in the landscape. The data produced from this project could be used in models to enable them to better predict frost risk and planting dates across the landscape rather than localised to weather stations.
What has been done?
GRDC funded research in 2014 to 2016, allowed selection of two paddocks containing significant elevation differences (20 – 55m) located near Gurley and Premer. While this paper will focus on results from this period, from 2017 onwards AMPS Research continued this elevation research at both locations with some key research findings represented below. From 2014–2021 paired top and bottom of the slope trial sites were selected at both Gurley and Premer. Rain gauges and Tiny Tags to record temperature (every 15 minutes) were installed. Six wheat varieties were planted on three planting dates (approximately last week of April, mid May and early June) at both sites and phenology was recorded to determine interactions between maturity and elevation.
Results
Soil water, soil N and temperature (2014–2016)
Plant available water capacity (PAWC) was similar at the top and bottom slope at all sites (Table 1), although the bottom slope generally had higher starting plant available water (PAW) than the top of the slope (2–20mm). Available soil nitrogen was also slightly higher at the bottom slope sites compared to the top slope, containing an additional 2–17 kg N/ha at planting (Table 1).
Elevation differences resulted in significant variation in temperature over the growing season. Average minimum temperature was 2.4 and 2.9°C lower at the bottom slope compared to the top slope at the Liverpool Plains and Gurley sites, respectively, whereas average maximum temperature was similar for both top and bottom slopes (Table 1). Critically, frost events increased down the slope with an additional 27-35 frost events/year at the Liverpool Plains bottom site and an additional 29-36 events/year at Gurley. Furthermore, the bottom of the slope had an additional 121-163 cumulative frost hours (≤0°C) compared to the top slope. Over the three years, average frost duration at the top of the slope was 2.5 hours at Gurley and 3.3 hours at the Liverpool Plains sites, compared to the bottom slope duration of 4.3 hours at Gurley and 4.6 hours at the Liverpool Plains sites. Lower average minimum temperatures and greater number of frost events both contributed to the slower accumulation of thermal time (day degrees) at the bottom slope compared to the top slope, with an additional 150 growing degree days (GDD) accumulated at top sites (Table 1).
Table 1. Soil and temperature differences between top and bottom slope at each site from 2014 to 2016
Site | Position on slope | Starting PAW (mm) | Soil N (0–1.2m, kg/ha) | Average temperature (°C) | Frost events | Cumulative hours <0°C | Season GDD | |
|---|---|---|---|---|---|---|---|---|
Minimum | Maximum | |||||||
Premer 2014 | Top | 139 | 110 | 5.1 | 24.6 | 31 | 97 | 1963 |
Bottom | 158 | 122 | 2.5 | 24.8 | 58 | 226 | 1655 | |
Gurley | Top | 90 | 154 | 7.1 | 30.7 | 7 | 21 | 2230 |
Bottom | 108 | 145 | 4.4 | 30.3 | 38 | 184 | 2038 | |
Spring Ridge | Top | 185 | 175 | 5.4 | 22.6 | 16 | 32 | 1998 |
Bottom | 200 | 192 | 2.6 | 23.1 | 51 | 243 | 1752 | |
Gurley | Top | 144 | 104 | 6.4 | 25.2 | 7 | 17 | 2186 |
Bottom | 146 | 118 | 2.9 | 24.8 | 36 | 176 | 2008 | |
Premer 2016 | Top | 225 | 125 | 4.9 | 22.8 | 31 | 132 | 1869 |
Bottom | 230 | 128 | 3.1 | 22.9 | 59 | 253 | 1655 | |
Gurley | Top | 115 | 138 | 6.8 | 27.9 | 1 | 0.45 | 2138 |
Bottom | 126 | 142 | 4.3 | 28.0 | 37 | 143 | 1967 | |
Results
Phenology (2014–16)
The variation of minimum temperature and ultimately GDD significantly impacted crop maturity. Despite being planted on the same day at the top and bottom slope sites the varieties did not reach 50% flowering on the same day. An example of this difference is given in Figure 1. The bottom slope sites took on average across the six varieties 13, 9 and 7 days longer to reach flowering than the top slope from the late April, mid May and early June planting dates, respectively for the Liverpool plains (Table 2). Similarly, for Gurley the differences in time taken to reach flowering were 9, 8 and 6 days longer at the bottom slope sites than the top slope for the late April, mid May and early June planting dates, respectively. The Liverpool Plains trials were on average 17 days later to reach flowering compared to the Gurley trials across the three years.
Table 2. Time to flower (days) for wheat (average of the 6 varieties LRPB Dart, LRPB Spitfire, Suntop, EGA Gregory, LRPB Lancer and EGA Eaglehawk) planted on three dates at the top and bottom slope sites at the Liverpool Plains and Gurley.
Site | Position on slope | Average days to flowering (n) | ||
|---|---|---|---|---|
Late April | Mid May | Early June | ||
Premer 2014 | Top | 131 | 126 | 116 |
Bottom | 147 | 138 | 127 | |
Gurley 2014 | Top | 94 | 114 | 102 |
Bottom | 106 | 123 | 108 | |
Spring Ridge 2015 | Top | 130 | 124 | 117 |
Bottom | 144 | 133 | 124 | |
Gurley 2015 | Top | 118 | 109 | 99 |
Bottom | 126 | 116 | 106 | |
Premer 2016 | Top | 141 | 132 | 121 |
Bottom | 149 | 135 | 126 | |
Gurley 2016 | Top | 123 | 119 | 110 |
Bottom | 130 | 126 | 116 | |
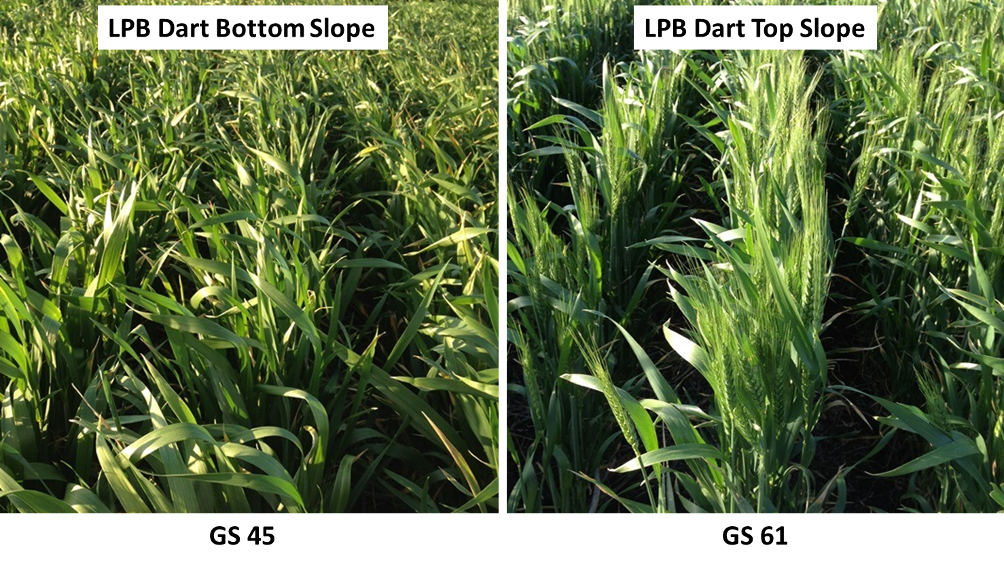
Figure 1. A visual representation of maturity differences for LRPB Dart between the top and bottom slope at Spring Ridge in 2015.
Grain yield and net returns (2014–16)
Both the Liverpool Plains and Gurley experienced hot and dry springs in 2014 and 2015 and in these seasons the real benefit of early planting was realised. For example, on the Liverpool Plains at the top slope site, delaying planting from late April to early June resulted in a 2.24 and 1.04 t/ha reduction in grain yield when averaged across six varieties in 2014 and 2015, respectively (Table 3). Assuming a wheat price of $250/t this is equivalent to $560/ha and $260/ha increase in net returns, respectively. Despite very favourable spring conditions on the Liverpool Plains in 2016 there was still a 1.34 t/ha yield penalty for delaying planting from late April to early June at the top of the slope. Again, assuming a wheat price of $250/t the late April planting date allowed an additional $425/ha and $1155/ha gross income to be realised, compared to the mid May and early June planting dates, respectively at the top of the slope over three years.
Frost damage did occur at the bottom slope sites on the Liverpool plains in all three years, particularly in LRPB Dart and LRPB Spitfire. For example, LRPB Dart in 2015 at Spring Ridge yielded 6.2 at the top and 1.2 t/ha at the bottom of the slope (data not shown). The frost damage at the bottom of the slope reduced average grain yield of the six varieties by 1.9 t/ha across the three years (Table 3). There was minimal frost damage in the two later planting dates as grain yields were similar between the top and bottom slope sites for the Liverpool Plains and Gurley in all three years. Unlike the Liverpool Plains in 2016, there was no yield penalty in delaying planting from late April until early June at Gurley (Table 3). This is compared to 2015, which had a hot dry spring, where the same delay in planting date resulted in a 1.9 t/ha reduction in grain yield.
The optimum flowering window was retrospectively determined by plotting grain yield against flowering date (figures not presented). At Gurley in 2014 and 2015 the optimum flowering windows were generally 12–14 days long, from mid to late August for the top of slope site; whereas in 2016 the optimum flowering window was much longer (24 days) and began in early September (Table 3). The length of the optimum flowering window for the bottom slope site at Gurley was similar to the top slope for the respective years, however, it generally started 9–13 days later. The delayed optimum flowering window for the bottom slope sites was also observed on the Liverpool Plains where it started 10–22 days later than the top of the slope. Optimum flowering windows on the Liverpool Plains for the top slope sites generally started around the beginning of September while the optimum flowering window for the bottom of the slope generally started around mid-September.
Table 3. Wheat grain yield (average of the 6 varieties LRPB Dart, LRPB Spitfire, Suntop, EGA Gregory, LRPB Lancer and EGA Eaglehawk) planted on three dates at the top and bottom slope sites at the Liverpool Plains and Gurley, and retrospective optimum flowering window for highest yield potential.
Site | Position on slope | Grain yield (t/ha) | Optimum flowering window | ||
|---|---|---|---|---|---|
Late April | Mid May | Early June | |||
Premer 2014 | Top | 5.24 | 4.28 | 3.00 | 1 Sep–12 Sep |
Bottom | 4.68 | 4.42 | 3.16 | 10 Sep–20 Sep | |
Gurley 2014 | Top | - | 1.56 | 1.19 | 18 Aug–3 Sep |
Bottom | 1.26 | 1.60 | 1.42 | 28 Aug–10 Sep | |
Spring Ridge 2015 | Top | 5.37 | 4.90 | 4.33 | 25 Aug–5 Sep |
Bottom | 4.53 | 5.18 | 4.60 | 16 Sep–25 Sep | |
Gurley 2015 | Top | 5.25 | 4.56 | 3.37 | 11 Aug–24 Aug |
Bottom | 4.62 | 5.01 | 3.62 | 24 Aug–9 Sep | |
Premer 2016 | Top | 7.52 | 7.25 | 6.18 | 8 Sep–28 Sep |
Bottom | 7.01 | 7.34 | 6.05 | 20 Sep–10 Oct | |
Gurley 2016 | Top | 6.32 | 6.41 | 6.57 | 6Sep–30 Sep |
Bottom | 5.98 | 6.56 | 6.51 | 15 Sep–30 Sep | |
Long term net returns (2014–21)
Long term results demonstrate that at Gurley, delaying planting from late April to mid May in frost risk zones increased average net return by $61/ha/year (Table 4). These increased returns were driven by a major frost event in 2020 where delaying planting from April to May increased net return by $1361/ha. While net return for a late April plant are higher if major frost events (such as 2020) are excluded, results demonstrate that mid-May planting provides the opportunity to achieve similar returns to a late April plant while substantially reducing risk. Similarly, at Premer late April planting in frost zones comes with substantial risk, as demonstrated in 2019 with losses up to -$286/ha following frost events compared to +$141/ha net returns for mid May planting (Table 5). While net return for late April planting was $53/ha/year higher than for mid May planting for the bottom slope at Premer this additional income comes with a risk of substantial losses due to frost.
Conversely, at the top of the slope at both Premer and Gurley planting early increased net return by $157–204/ha/year compared to a mid May plant with substantially less risk than early planting in frost prone areas. To demonstrate, at Premer, late April plant at the bottom of the slope increased net return by $53/ha/year but minimum net return for the eight year period was -$286/ha. In comparison, at the top of the slope late April planting increased net return by $157/ha/year and minimum net return was -$128/ha, demonstrating substantial upside benefits and lower downside risk of early planting higher up the slope.
Table 4. Net return ($/ha) for cv LRPB Lancer at Gurley top and bottom slope sites for three planting dates from 2014 to 2021
Planting date | Position on slope | Net return1 ($/ha/year) | Average3 net return ($/ha/year) | |||||||
|---|---|---|---|---|---|---|---|---|---|---|
2014 | 2015 | 2016 | 2017 | 20182 | 2019 | 2020 | 2021 | |||
Late April | Bottom | -96 | 1105 | 1386 | 689 | 228 | 52 | 1562 | 616 | |
Mid May | -88 | 822 | 1319 | 417 | 135 | 1413 | 1397 | 677 | ||
Early June | -137 | 509 | 1151 | 93 | -254 | 1200 | 1265 | 478 | ||
Late April | Top | 220 | 1221 | 1520 | 914 | 336 | 1256 | 1461 | 866 | |
Mid May | -10 | 877 | 1433 | 489 | 135 | 1085 | 1286 | 662 | ||
Early June | -123 | 587 | 1374 | 252 | -254 | 933 | 1179 | 494 | ||
1 Net return calculated with wheat price $250/t and variable costs $600/ha | ||||||||||
Table 5. Net returns ($/ha) for cv LRPB Lancer at Premer top and bottom slope sites for three planting dates from 2014 to 2021
Planting date | Position on slope | Net return1 ($/ha/year) | Average net return2 ($/ha/year) | ||||||||
|---|---|---|---|---|---|---|---|---|---|---|---|
2014 | 2015 | 2016 | 2017 | 2018 | 2019 | 2020 | 2021 | ||||
Late April | Bottom | 738 | 1020 | 1388 | 964 | 605 | -286 | 621 | 1015 | 758 | |
Mid May | 623 | 863 | 1360 | 780 | 33 | 141 | 906 | 933 | 705 | ||
Early June | 465 | 555 | 1000 | 647 | -263 | 14 | 741 | 843 | 500 | ||
Late April | Top | 773 | 950 | 1228 | 1188 | 1148 | -128 | 980 | 1172 | 914 | |
Mid May | 498 | 643 | 1148 | 1005 | 573 | 220 | 898 | 1072 | 757 | ||
Early June | 208 | 480 | 828 | 698 | 5 | 3 | 623 | 846 | 461 | ||
1 Net return calculated with wheat price $250/t and variable costs $600/ha | |||||||||||
Discussion
The two locations demonstrate that frost risk can vary greatly within the landscape, particularly with elevation differences. This represents an opportunity for growers to be able to plant earlier in certain parts of the landscape without necessarily increasing their exposure to frost risk. The top slope sites only had 30 and 20% of the frost events that occurred at the bottom slope on the Liverpool plains and Gurley, respectively. Not only are there less frost events but the frost severity is also greatly reduced. Top slope sites had 45% higher average minimum temperatures and only accumulated 11% of the time spent <0°C compared to the bottom of the slope, when averaged across all sites and locations. The impact of this difference in frost risk is evident on the April planting date in 2015 at both Spring Ridge and Gurley with the two quicker maturing varieties, LRPB Dart and LEPB Spitfire. For the bottom slope LRPB Dart was 60 and 81% lower yielding compared to the top slope sown in late April at Gurley and Spring Ridge, respectively. Also, in the late April plant LRPB Spitfire was 61 and 43% lower yielding at the bottom of the slope compared to the top slope site at Spring Ridge and Gurley, respectively.
The differences in minimum temperatures between top and bottom slope sites also impacted crop maturity. The greater number of frost events and severity slowed down the accumulation of GDD throughout the season, to the extent that the bottom slope at both locations accumulated over 150 GDD less than the top slope. As a direct result of this the crop maturity was delayed. The maturity delay was greatest in the early planting with an average delay of 11 days for varieties to reach flowering. This is interesting as the delay in maturity is actually helping to negate some of the frost risk at the bottom of the slope. In most cases the optimum flowering window at both Gurley and Liverpool plains was 14 days later at the bottom of the slope compared to the top slope. Of concern, there were a number of instances where frost events had occurred during the optimum flowering window at the bottom slope sites at both locations. Although these frost events appear to have had little impact on grain yield in these years it does highlight the higher risk of incurring frost damage in these lower parts of the landscape. Furthermore, it highlights that frost events at lower elevations are happening later in the season, yet the onset of potential heat stress is no different to higher elevations, thus reducing the length of the optimum flowering window.
The shorter optimum flowering window for the lower elevations at Gurley and Premer reduced net returns for late April planted LRPB Lancer by 18–28% compared to the top of the slope. The higher net returns achieved at the top of the slope sites represent the upside opportunity for growers to exploit with earlier planting dates and lower frost risk. The importance of ensuring early planting in areas with lower frost risk was also highlighted with an average 18–25% reduction in net returns by delaying LRPB Lancer
planting from late April to mid May. In comparison, at the bottom of the slope for the same delay in planting there was a -10 to 7% change in net returns. Therefore, there was little change in net returns for the additional frost risk incurred from planting LRPB Lancer at the bottom of the slope in late April compared to mid May. The differences observed in frost risk and net returns through time in these sites indicates that optimum planting date for LRPB Lancer varies by 2 to 3 weeks with the changes in elevation. This represents a challenge when selecting a single planting date for paddocks where large variations in elevation exist. Alternatively, using one planting date and two varieties with a longer maturity being used in lower elevations and a quicker maturity being used at higher elevations could be employed. On a broader scale growers could use elevation differences across a farm to identify lower or higher frost risk paddocks to inform planting date decisions. It is recommended that temperature loggers or weather stations be deployed on farms to measure variations in frost risk across farms.
Conclusions
As in previous experimental work, these trials have demonstrated the benefits of early planting from a production and economic point of view. However, this work does demonstrate that elevation has a large impact on frost risk, which in turn represents an opportunity for growers to plant earlier in higher parts of the landscape without necessarily increasing the frost risk. Although frost risk changes with elevation, the risk of heat stress during grain fill does not change, with maximum temperatures being similar for top and bottom slope sites. Therefore, lower parts of the landscape have a narrower optimum flowering window. Lower minimum temperatures and a greater number of frost events in lower parts of the landscape reduce the accumulation of GDD and hence delay crop development. Despite the delayed development there is still a need to adjust planting date to achieve an acceptable level of both frost, and heat risk during grain fill. The paddocks selected to conduct these trials were selected because of their large variation in elevation, however they do demonstrate how frost risk varies significantly within the landscape and how difficult it may be to interpolate frost risk/planting decisions from the nearest weather station, which could be located some distance away. It is important to remember that elevation can be used as a valuable tool to evaluate frost risk but other factors such as drainage lines, aspect, tree lines and position in the landscape also need to be considered.
Acknowledgements
This research was made possible by the significant contributions of growers through trial cooperation, the support of the GRDC (2014-2016) and AMPS Research (2017-2021). The authors would like to thank growers Ed and Fiona Simson, Paul and Lisa Slack, Hugh and Adele Simson and Mike and Bev Smith for providing trial sites. The authors gratefully acknowledge the team engaged in the 2014-16 GRDC research project Jules Dixon and Stephen Towells (formerly AMPS Research), Greg Giblett and Sam Simons (formerly Agromax Consulting) and the technical support provided by the Amps Research team.
Contact details
Matt Gardner
Amps Research
690 Waverley Rd
Caroona NSW, 2343
Ph: 0400 153 556
Email: matt@ampsagribusiness.com.au
Date published: July 2023
Varieties displaying this symbol beside them are protected under the Plant Breeders Rights Act 1994