Farming systems research in the northern grains region and implications for key decisions driving risk and profit in Central Queensland. Yield, economics, and seasonal risk.
Author: Darren Aisthorpe (DAF Qld) | Date: 29 Nov 2023
Take home message
- Systems matter – At Emerald, a more conservative cropping strategy (one crop per year) but on a non-limiting nutrition plan has been the most consistent strategy to maximise returns.
- Nutrition – No system on the medium/standard crop intensity and higher nutrition plan have fallen behind the baseline system with respect to system economics. The additional nitrogen (N) applications made at planting have always improved returns. However, after nine years and some high yielding crops, there is scope for future nutrient strategies to include higher N rates and applications early in the fallow to improve N availability to crops.
- Water use efficiency (WUE) and fallow efficiency (FE) – The variation between systems, and also across crops within a system for WUE and FE indicate that there is room for improvement for both indices. With early indications from the Integrated weed management (IWM) plus nutrition split looking positive, a move back to narrower row spacings on an increased nutrition plan could be a positive move, so long as the logistical challenges can be overcome.
Background
The Queensland Department of Agriculture and Fisheries (DAF), CSIRO and the New South Wales Department of Primary Industries (NSW DPI) are collaborating to conduct an extensive field-based farming systems research program. This program focuses on developing farming systems to better use the available rainfall to increase productivity and profitability.
The Northern Farming Systems (NFS) projects are investigating how several modifications to farming systems will affect the performance of the cropping system. This involves assessing various aspects of these systems including: water use efficiency (WUE); nutrient balance and nutrient use efficiency (NUE); changes in pathogen and weed populations; changes in soil health; and profitability.
The key system modifications being examined involve changes to the following:
- Crop intensity – the proportion of time that crops are growing which impacts on the proportion of rainfall transpired by crops and unproductive water losses. This is being altered by changing soil water thresholds that trigger planting opportunities.
- Increased legume frequency – aim to have every second crop a legume over the crop sequence, assessing if required fertiliser N inputs can be reduced.
- Nutrient supply strategy – by increasing the fertiliser budget to achieve 90% of yield potential for that crop compared with 50% of yield potential, with the aim of boosting background soil fertility, increasing N cycling and maximising yields in favourable years.
- Increased crop diversity – crop choice aims to achieve 50% of crops resistant to root lesion nematodes (preferably two in a row) and crops with similar in-crop herbicide mode of action cannot follow each other. The aim is to test systems where the mix and sequence of crops are altered to manage soil-borne pathogens and weeds in the cropping system.
This range of system modifications are being tested across six locations as part of this project: Emerald, Billa Billa, Mungindi, Spring Ridge, Narrabri and Trangie (red and grey soils). The core experimental site (CSA00050), located near Pampas on the eastern Darling Downs, aims to explore the interactions between these modifications to the cropping systems across a range of crop sequences that occur across the northern grains region. The core site is comparing 34 different systems.
Central Queensland Site – Emerald
The site is located at the DAF Central Queensland Smart Cropping Centre (CQSCC) facility, 4 km east of Emerald (-23.528550, 148.207907). Elevation is approximately 189 m above sea level. The crop history in the field prior to the trial commencing was chickpea sown in 2012, followed by sorghum in summer 12/13, fallowed for winter 2013 and then irrigated cotton in summer 13/14.
In late 2014 forage sorghum was grown until early March 2015 when it was sprayed out and preparation began for the trial’s first crops. The site then had 200 kg/ha of mono-ammonium phosphate (MAP) applied as deep as possible (20-25 cm) on 50 cm row spacings. The first planting occurred May 2015.
Soil characteristics
The site is located on cracking, self-mulching, grey vertosol soil, more than 1.5 m deep. The soil had moderate background fertility levels, particularly at the surface, likely due to the pervious cropping history and nutrient management (Table 1). Estimated water holding capacity is 240 mm to 1.5 m, but it is likely additional water may be available at deeper depths in this soil.
Table 1. Starting comprehensive analysis of the of Emerald Northern Farming Systems site in 2015.
Depth | BD | DUL | Total porosity | Organic C (%) | Colwell-P | BSES-P | PBI | Colwell-K | Sulphur | Cond. | pH | pH | Cl (2018) |
|---|---|---|---|---|---|---|---|---|---|---|---|---|---|
0-10 | 1.249 | 34.801 | 0.529 | 0.77 | 45.13 | 69.93 | 99.03 | 437.67 | 10.88 | 0.17 | 6.80 | 7.54 | 0.77 |
10-30 | 1.412 | 38.850 | 0.467 | 0.50 | 12.33 | 21.23 | 114.16 | 224.54 | 11.27 | 0.16 | 7.15 | 8.07 | 0.50 |
30-60 | 1.414 | 38.704 | 0.466 | 0.35 | 2.88 | 161.38 | 21.21 | 0.19 | 7.21 | 8.30 | 0.35 | ||
60-90 | 1.393 | 39.438 | 0.474 | 0.27 | 1.83 | 177.04 | 351.28 | 0.45 | 7.23 | 8.10 | 0.27 | ||
90-120 | 1.365 | 40.481 | 0.485 | 0.17 | 3.58 | 228.50 | 773.31 | 0.74 | 6.89 | 7.50 | 0.17 | ||
120-150 | 1.367 | 40.419 | 0.484 | 0.11 | 5.71 | 254.38 | 412.00 | 0.55 | 5.44 | 6.20 | 0.11 |
Depth (cm) | (meq/100g) | mg/Kg | DTPA (mg/kg) | |||||||
|---|---|---|---|---|---|---|---|---|---|---|
Exc. Na | Exc. Ca | Exc. K | Exc. Mg | Exc. Al | Boron | Cu | Fe | Mn | Zn | |
0-10 | 0.76 | 20.17 | 1.09 | 10.30 | 0.11 | 1.32 | 1.63 | 15.69 | 24.83 | 2.57 |
10-30 | 1.22 | 20.72 | 0.55 | 11.30 | 0.09 | 1.33 | 1.40 | 14.30 | 8.92 | 1.15 |
30-60 | 2.65 | 18.96 | 0.42 | 12.90 | 0.09 | |||||
60-90 | 4.22 | 18.36 | 0.45 | 13.32 | 0.11 | |||||
90-120 | 5.47 | 16.93 | 0.61 | 14.18 | 0.14 | |||||
120-150 | 5.38 | 15.47 | 0.66 | 13.95 | 0.09 | |||||
Nutrition calculations
Starter phosphorus (P) and nitrogen (N) fertilisers are applied at sowing. These applications are made in line with the yield potential (50th percentile or 90th percentile, according to the nutrient strategy) for each crop based on sowing date and available soil water at sowing as simulated by APSIM.
The nutrient strategy was determined at the commencement of each system and does not change.
- 50th Percentile – sufficient additional N or starter is applied at planting to ensure enough of these nutrients are available to the crop to achieve an “average” yield based on the starting plant available water and APSIM’s modelled yield expectations for that planting date
- 90th Percentile – sufficient additional N or starter is applied at planting to ensure enough of these nutrients are available to the crop to achieve a yield for the top 10 % of years based on the starting plant available water and APSIM’s modelled yield expectations for that planting date.
The crop N budget is calculated based on industry recommendations for each crop, and the shortfall from available mineral N (determined by soil testing at the start of the sowing window) was made up with an N application as urea at sowing. This is applied in the inter row between seeding rows to reduce risks of germination damage. Starter fertilisers were applied in the seed row.
Trial design and management
Consultation began with local growers and agronomists in 2014 to identify the key limitations, consequences, and economic drivers of farming systems in the northern region. In April 2015, the farming systems were implemented at the Emerald site, relevant to Central Queensland (CQ), but consistent with the Northern Farming Systems Initiative and core site at Pampas.
A range of rules and protocols were developed around agronomic practices, crop types, planting triggers, and nutrition. These were adopted to preserve the integrity of each of the six initial systems.
- Baseline (M01) – A conservative zero tillage system targeting one crop/year. Crops are limited to wheat, barley, chickpea and sorghum, with nutrient application rates on cereals targeting median (50th percentile) seasonal yield potential. Aligned with the Baseline system at the Pampas core site.
- Higher crop intensity (M07) – Focused on increasing the cropping intensity to 1.5 crops/year when water allows. Crops include wheat, chickpea, sorghum, mungbean and forage crops/legumes, with N rates on cereals targeting median (50th percentile) seasonal yield potential. Aligned with the +intensity system at the Pampas core site.
- Higher legume (M03) – The frequency of pulses in the Baseline system is increased (one pulse crop every 2 years) to assess the impact of more legumes on profitability, soil fertility, disease and weeds. N rates on cereals targeting median (50th percentile) seasonal yield potential. Aligned with the +legume system at the Pampas core site.
- Higher nutrient supply (M02) – N and phosphorus rates of the Baseline system is increased targeting 90th percentile of yield potential based on soil moisture in an environment of variable climate. The crops and other practices are the same as the Baseline system. Aligned with the +nutrient system at the Pampas core site.
- Higher soil fertility (M02b) – Based on the Higher nutrient supply system, an additional 60 t/ha of manure (wet weight) was applied to change the starting soil fertility level. This system is designed to see if higher initial soil fertility can be maintained with greater nutrient inputs (90th percentile). Aligned with the +fertility system at the Pampas core site.
- Integrated weed management (IWM) (X01) – This minimum tillage system is focused on one crop/year but employs a wide range of practices to reduce the reliance on traditional knockdown herbicides in CQ farming systems. Crops include wheat, chickpea, sorghum and mungbean with N rates on cereals targeting median (50th percentile) seasonal yield potential.
These six systems were maintained until after the winter crop of 2020. At that point the project was extended by GRDC and after consultation with the local reference committee and by request from the GRDC project manager, an additional four systems were implemented from December 2021.
- Baseline + Higher diversity (M04) – How does a moderate intensity (Baseline) system using a diverse crop selection compare with the other systems?
- Higher legume + Nutrition (M30) – Higher legume system + Pre-crop nutrition calculations now performed to target a 90th percentile yield instead of a 50th percentile. Stratification of N at sowing has been a significant issue for CQ systems. It is expected that the crop which has the N side banded may not see the N applied, rather we are fertilizing for the following crop, not the current crop.
- Lower intensity + Nutrition (M14) – How does a low intensity, high nutrition system using a diverse crop selection compare against the other systems?
- IWM + Nutrition (X01b) – Standard IWM system + pre-crop nutrition calculations now performed to target a 90th percentile. The standard IWM system was demonstrating a consistent decline in baseline fertility relevant to other systems, by increasing the nutrition levels, will this lead to improved production and system benefits.
Crop sequences to date
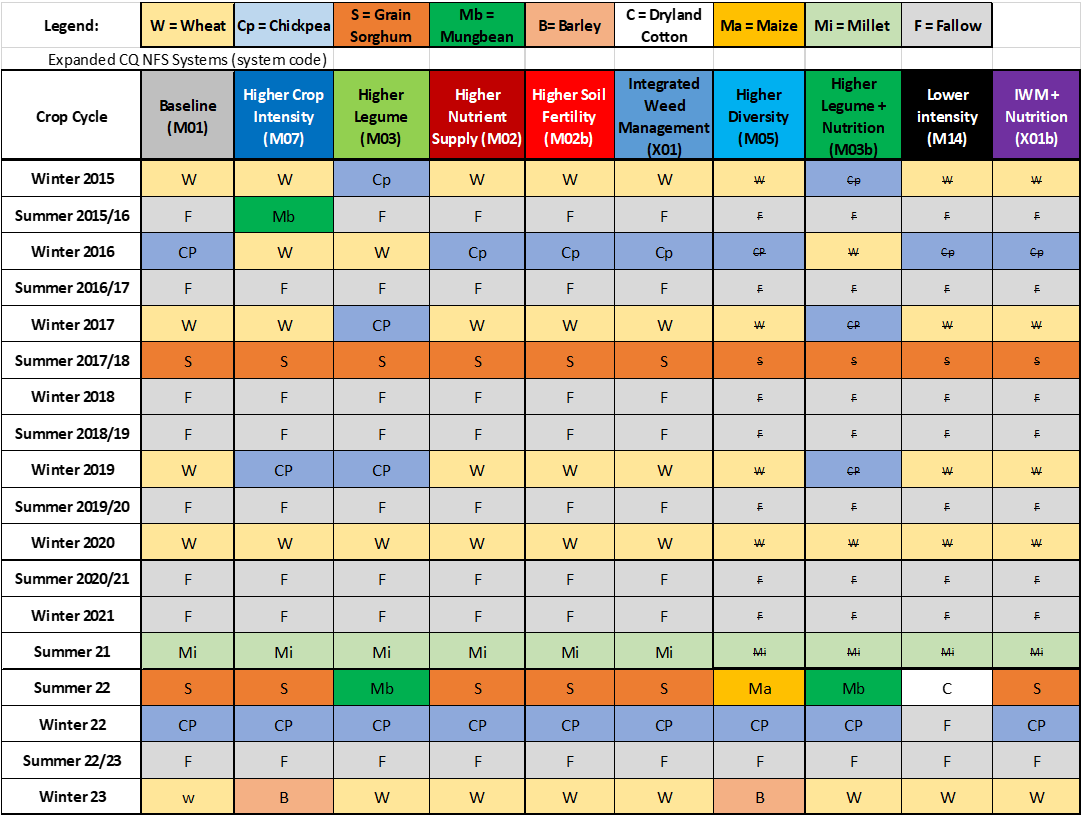
The Emerald trial has now been operating for nine years, with most systems now producing 10 different crops (Table 2). All the systems added in 2021 were applied onto existing system plots (as per description above) which were split in half, so any crop/system data shown for these four systems prior to summer 2022 was derived from the ‘parent’ system.
Table 2. Cropping sequence for Emerald Northern Farming systems experiment. The struck-out letters for systems on the right-hand side indicate crops that were grown in that location prior to the system being split off the parent system.
Results
Climate observations
Comprehensive climatic observations are kept for the Emerald NFS site including both daily summary data and 15-minute observations. While not a core focus of the overall trial program, being able to differentiate and understand how climatic events are driving agronomic responses across the very broad geographic spread of trials is important.
Temperature
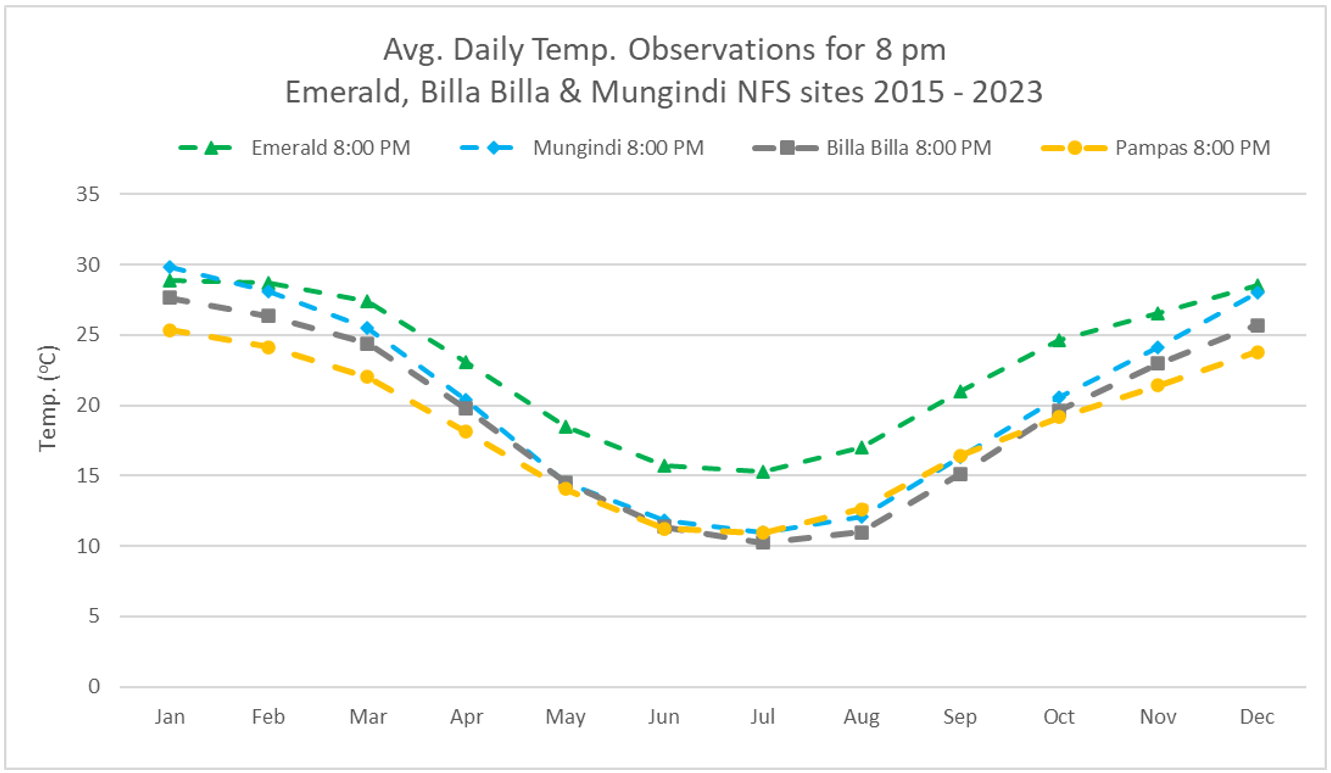
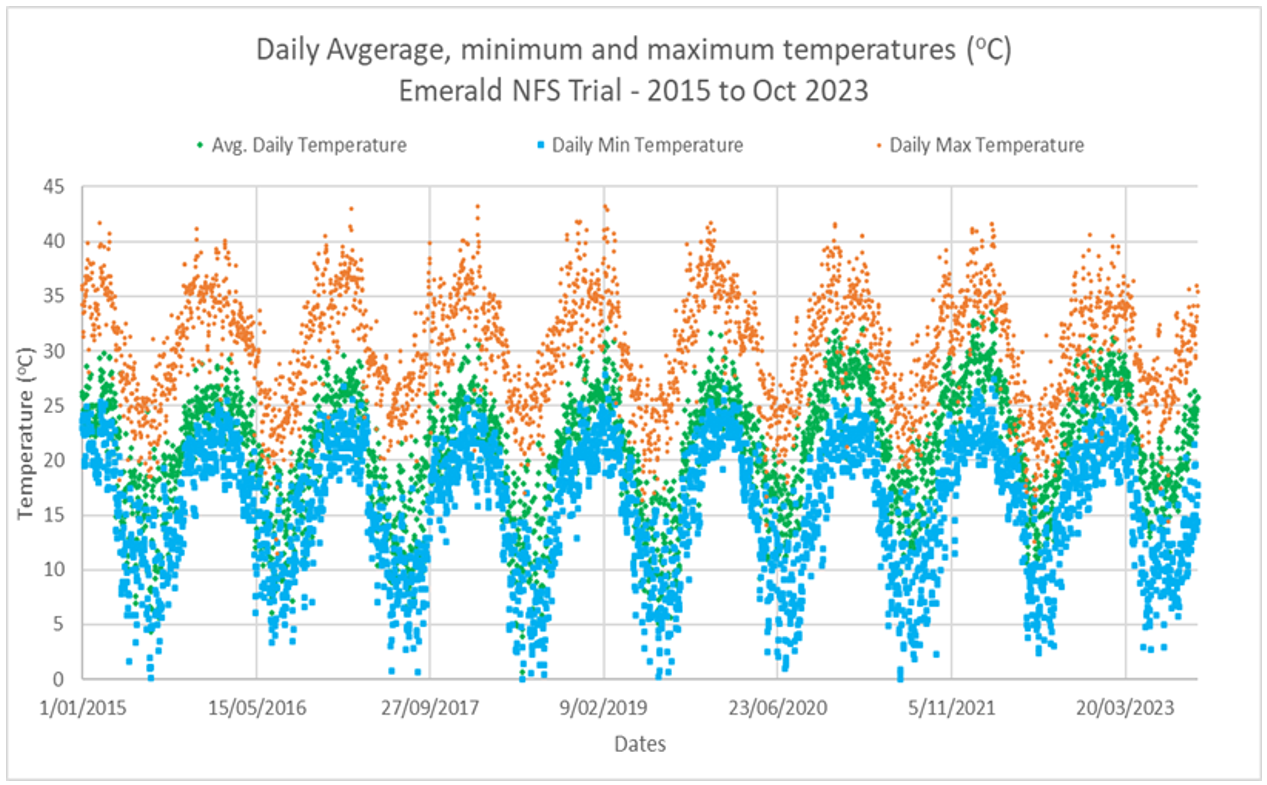
Unsurprisingly, Emerald’s average temperatures tend to be higher than the more southern sites. However, it is not raw maximum temperatures which drive the higher average temperatures. Rather the difference comes from the warmer minimum temperatures. These warmer temperatures can have a significant effect on plant physiology and ultimately cropping systems. Nights tend to be warmer (Figure 1) with overnight lows in the low to mid-20’s common place during the warmer months.
Figure 1. Average monthly temperature at 8 pm for the four QLD based Northern Farming Systems sites. From March to November, at 8 pm, for the past nine years, the Emerald site is consistently warmer later into the evening. Only the Mungindi site achieves higher 8 pm temperatures in December and January.
Figure 2. Daily minimum (blue/darker), maximum (orange/lighter) and calculated average daily temperature (green) for the duration of the Emerald Northern Farming systems trial. Temperatures have ranged from 0 °C to 44 °C. Frost risk at the Emerald site is much lower than the southern sites, or other locations in CQ, however as the figure shows, they certainly are possible.
Rainfall
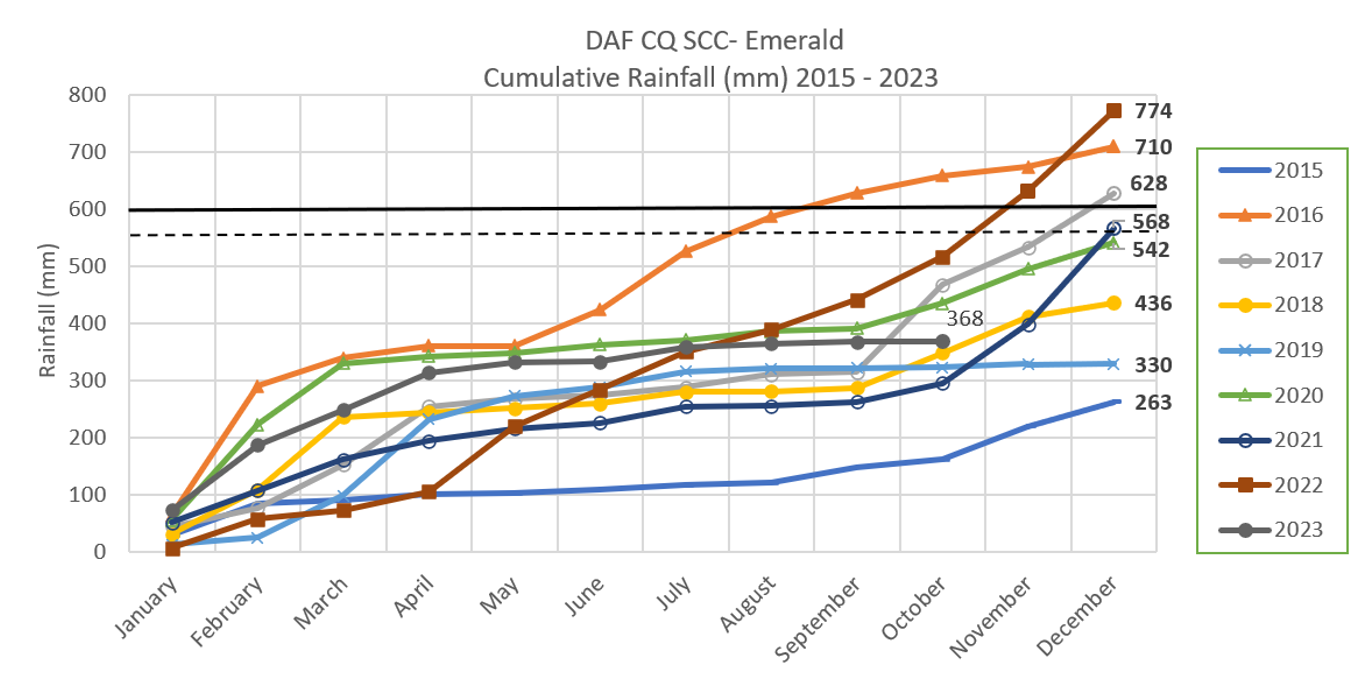
Emerald’s long-term average annual rainfall is approx. 600 mm with a summer dominant distribution. Climate data from the Emerald site (Figures 3 & 4) agrees with the summer dominance of the rainfall over the nine-year life of the trial however the cropping sequence (Table 2) indicates something quite different, as seven of the last 10 crops grown have been winter crops.
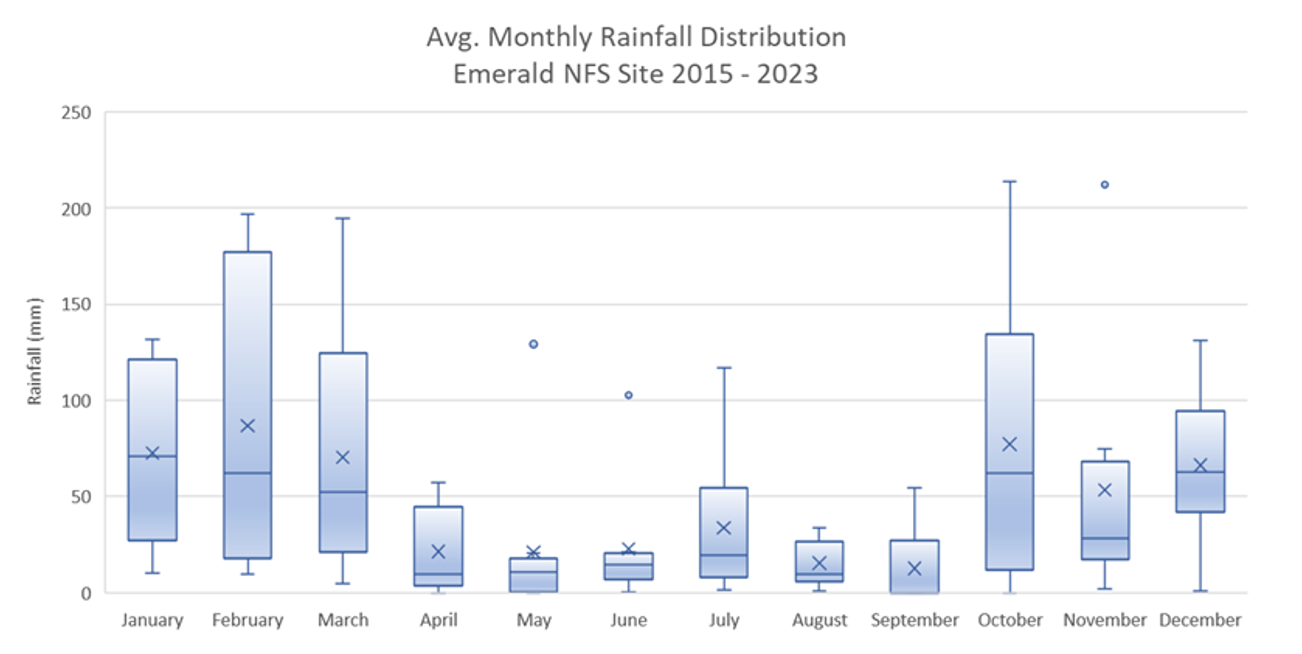
Figure 3. Box and Whisker Graph depicting monthly average rainfall distribution 2015–2023. The x marker indicates the mean monthly rainfall for the period, the middle line is the median, top and bottom error bars indicate the variation in average rainfall, while the individual points indicate outlier rainfall events when compared to all other falls over that period.
The box and whisker plot (Figure 3) shows the variability of the monthly rainfall over the duration of the trial program. While the monthly average rainfall (marked as an x) is consistent with a summer dominant rainfall pattern, the distribution of rainfall over the trial period points to a greater likelihood of rainfall later in summer rather than from October onwards (however significant rainfall during that period has occurred). The graph shows monthly rainfall of more than 100 mm occurred in the 9 year period in every month except April, August and September. Conversely, every month except for January (10.2 mm) and February (9.6 mm) had a “less than 5 mm” total rainfall over the duration of the trial.
Figure 4. Cumulative rainfall for the nine years at the Emerald Northern Farming Systems trial. The horizontal dotted line indicates what the average rainfall has been for the period (560 mm), the thick line above it indicates the long-term average rainfall for Emerald (600 mm).
Figure 4 shows the variability of annual rainfall for the site (264 mm in 2015, 774 mm in 2022) but also when the rainfall fell. Consistent with Figure 3, cumulative rainfall in the period from April to September is typically the lowest of the year, with most years showing only incremental rainfall accumulation at best over that period. Only 2016 and 2022 stand out as exceptions. The grey dotted line indicates the average rainfall received for the site over the past nine years (562 mm), 40 mm below the long-term average of 600 mm.
Climate induced crop stress
While rainfall and temperature are drivers of crop growth, in isolation they are not strong indicators of predicted crop performance. A crop’s ability to access stored soil water when required enables those crops (within reason) to handle higher temperatures or prolonged periods of little to no rainfall. However, there are obviously limits to their capacity to do this, depending on the crop type and the time sown.
Photosynthesis is the process of converting carbon dioxide + water (using sunlight) into oxygen and glucose. If a plant experiences higher than ideal temperature or low relative humidity, it diverts water and energy from this process to try to cool/hydrate itself through transpiration, which isn’t a significant issue if there is plenty of plant available water and is only for a short period of time. However, if water is limited or at depth, which takes more energy, the amount of water lost to transpiration is greater than the water it can extract. This is when crop stress can occur causing the plant to shut down to prevent excess water loss, which can have a significant effect on crop production and quality.
In an ideal situation, you would grow crops in periods when they would experience the least amount of stress during the growing season (or at least during critical periods like flowering and grain fill). Indices like vapour pressure deficit (VPD) are very useful in identifying when such periods exist. VPD is the difference between how much moisture the air can hold at any given point in time, and how much moisture the air is currently holding. The lower the deficit, the lower the chance of stress inducing conditions for any given crop.
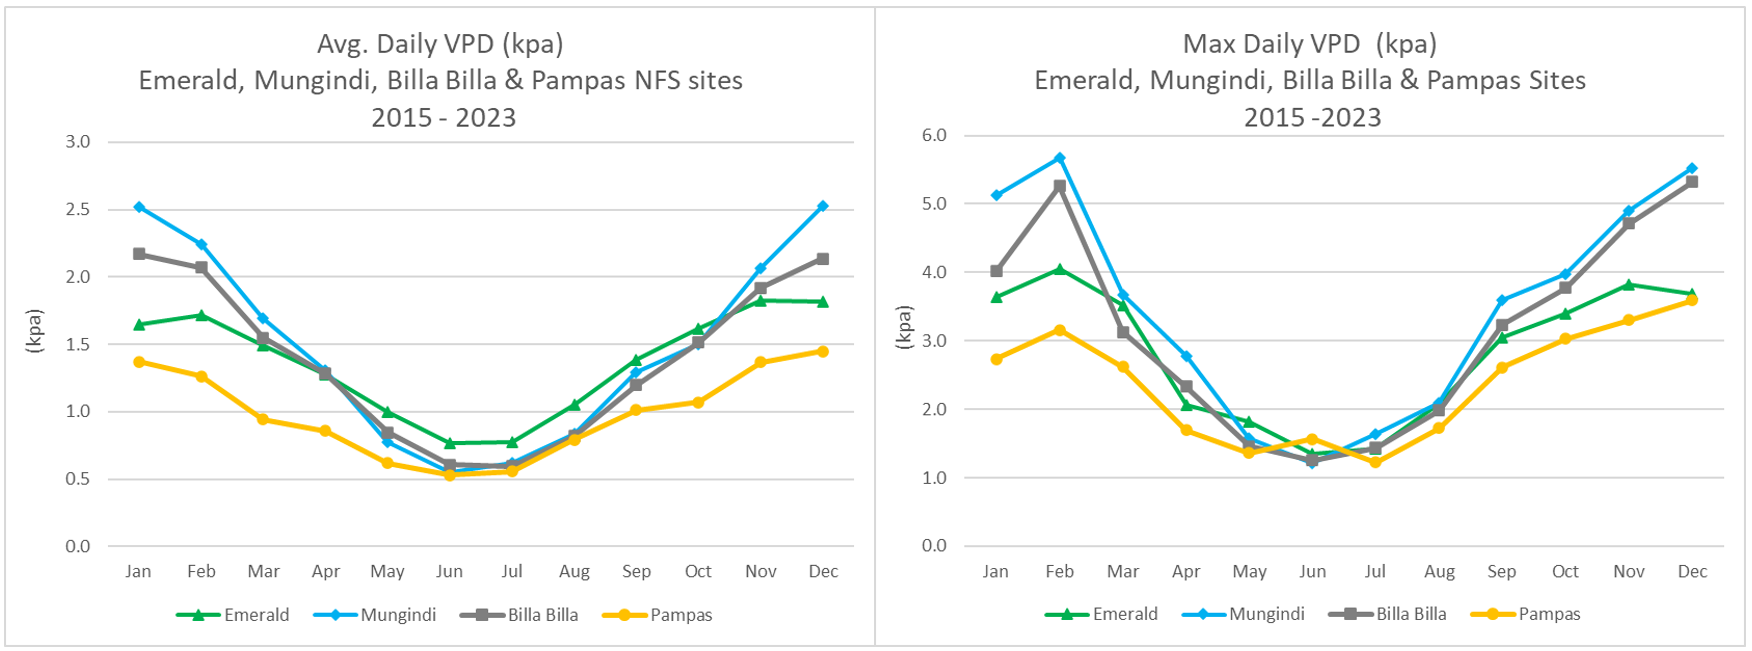
Figure 5. Daily average and maximum monthly VPD (kpa) observations for 2015–2023 for the Northern Farming Systems sites at Emerald, Mungindi, Billa Billa and the Pampas core site. For winter cereals, the target range (0.6 – 1.0 kpa) is much narrower for the Emerald site, relative to the other three sites, however during January – March, conditions appear much milder on average in Emerald, relative to Billa Billa and Mungindi, hence the difference in sorghum cropping windows.
For the Emerald site, VPD monthly average can range between 0.8 to 1.8 kpa, (Figure 5) however daily figures can range between 0.1 to 4.0 kpa depending on relative humidity and temperature at the time. In a completely controlled environment, a target VPD of 0.6 - 0.8 kpa is deemed optimum for a range of crops. Commercially, indicative observations show a VPD of 0.7 – 0.9 seems ideal for flowering or grain filling winter cereals, while a VPD well below 2.0 kpa during flowering and grain fill would be preferred for summer cereal and pulse crops.
Water capture & use efficiency
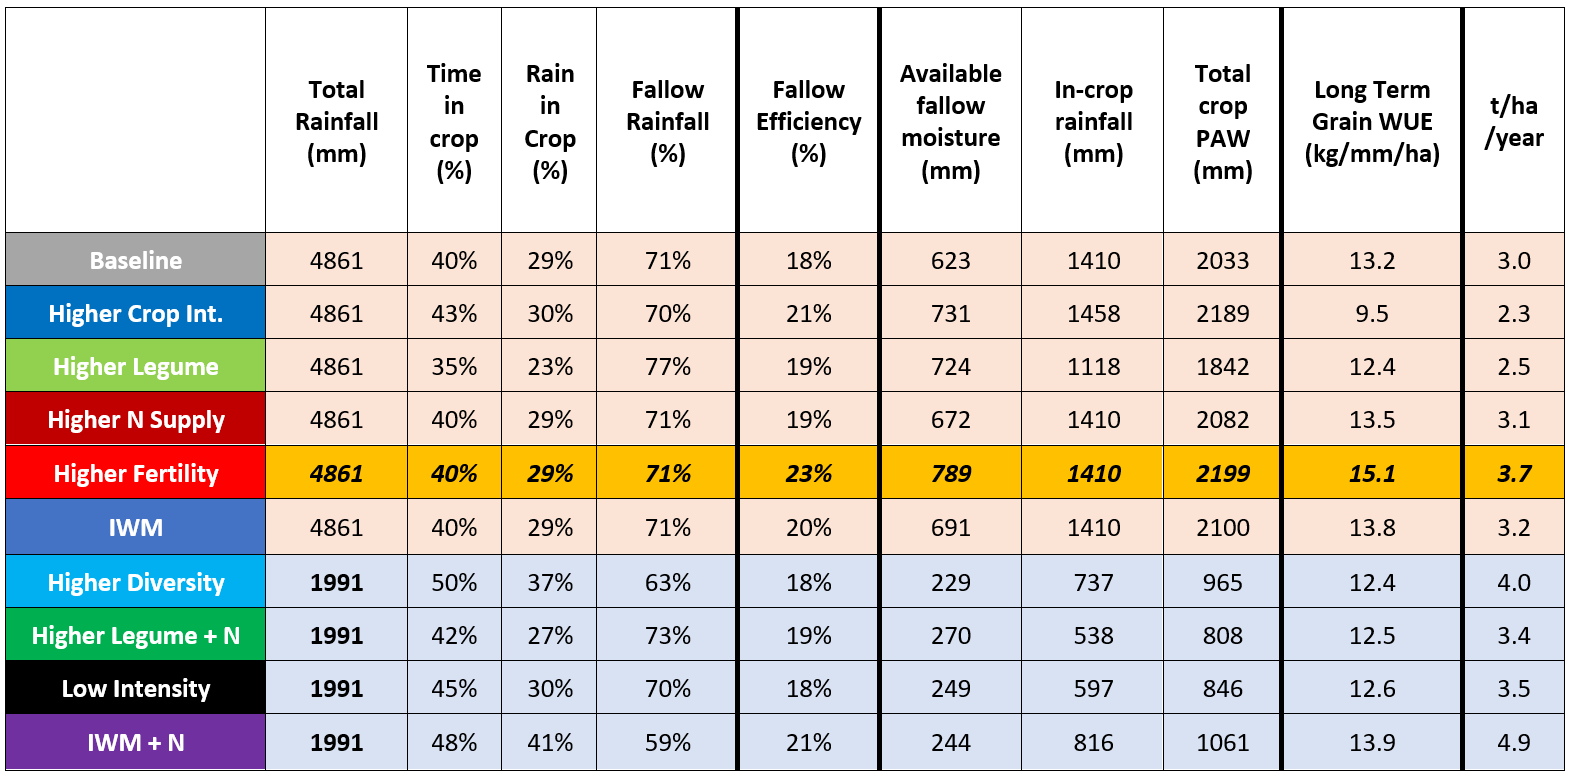
Over the duration of the trial to date, the Emerald site’s average time in crop (for the six core systems) has been approximately 40%. The percentage of the cumulative rainfall for the past nine years (4861 mm) which has fallen in crop is approximately 30% or 1461 mm. Of the remainder (3400 mm), the fallow efficiency (FE) or the system’s ability to convert fallow rainfall into plant available water (PAW) stored in the soil across the 10 systems has ranged between 18% to 23%, or a conversion rate of 623 mm for the 18% systems, up to 789 mm for the 23% system (Higher fertility) over the past nine years.
The long-term average WUE for the Emerald site (six original systems) is 12.9 kg of grain produced for every mm of rainfall per ha utilized by the crop (Table 3). That figure ranges from 9.5 kg for the Higher intensity system, up to 15.1 kg/mm/ha for the Higher fertility system.
Table 3. Fallow efficiency (%) and water use efficiency (WUE) kg/mm/ha of all 10 systems since commencement of that system. Please note the systems shaded blue commenced in early 2022.
In isolation, the Fallow Efficiency (FE) across the systems looks less than ideal, with significant improvement needed given how much water we are missing out on, particularly considering the economic consequences of that. However, it should be considered:
- all systems are operated under a zero till, controlled traffic regime
- the fallow efficiency of the IWM systems with higher populations / narrow row spacings was no better than the Higher Fertility system
- nor was the Higher crop intensity system which was designed to increase the % of time in-crop
- and finally, the rainfall intensity and inconsistency over the duration of the trial.
If maximum raw tonnage/ha is the goal, perhaps turning attention to improving the average Water Use Efficiency (WUE) may offer a simpler solution to increase production.
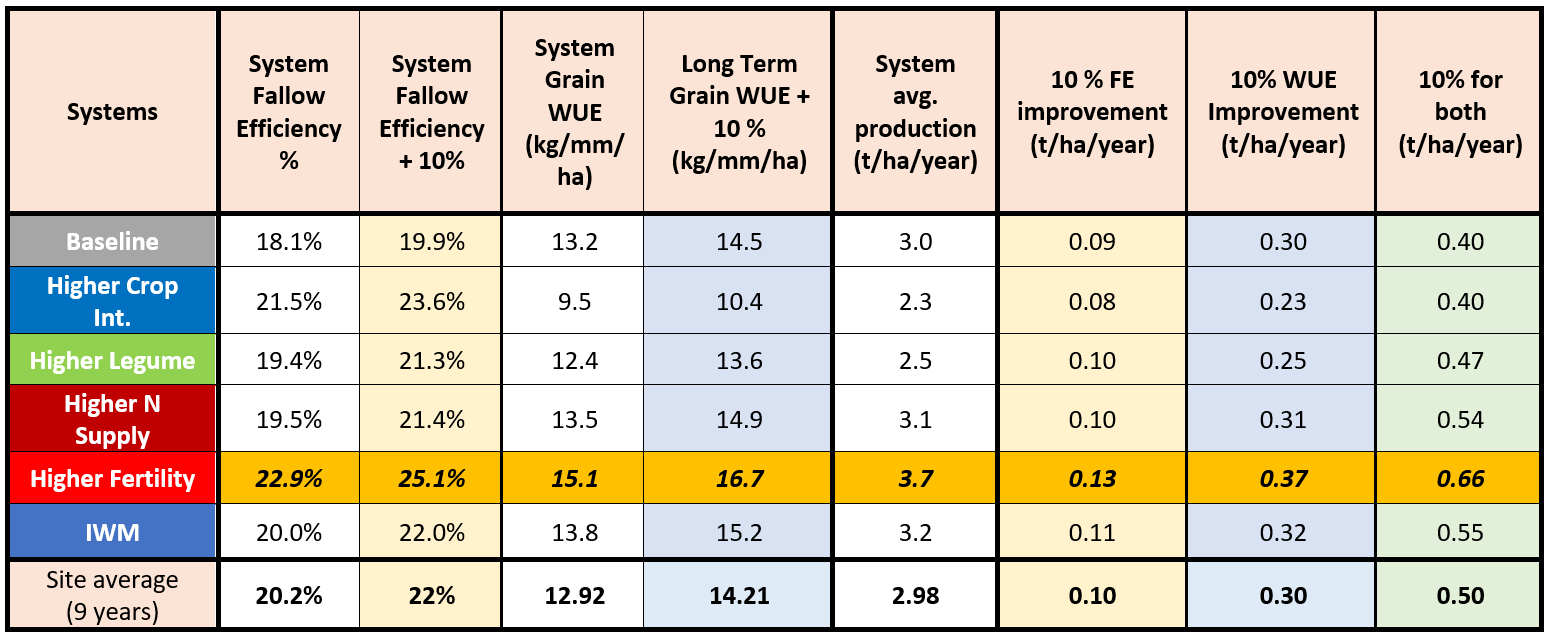
If the six original systems had a 10% improvement in FE with no change to WUE, on average all the systems would have achieved a grain yield gain/ha/year of 100 kg (Table 4). However, if we were able to improve WUE by 10% with no change to FE, the systems would have yielded on average 300 kg/ha/year more than they have. Improve both WUE and FE the yield gain would be 500 kg/ha/year or an additional 4.5 t of grain/ha over nine years, for the same rainfall amount and seasonal distribution.
Table 4. A ‘What if’ scenario of improving fallow efficiency (FE, %) and water use efficiency (WUE, kg/mm/ha) comparing the benefits of improving either index by 10% on long term grain production. White columns are current values, light yellow columns show 10% improvement in FE, blue columns show 10% improvement in WUE, and the green column shows the production uplift if both FE and WUE were increased by 10%.
Production
Crop yield
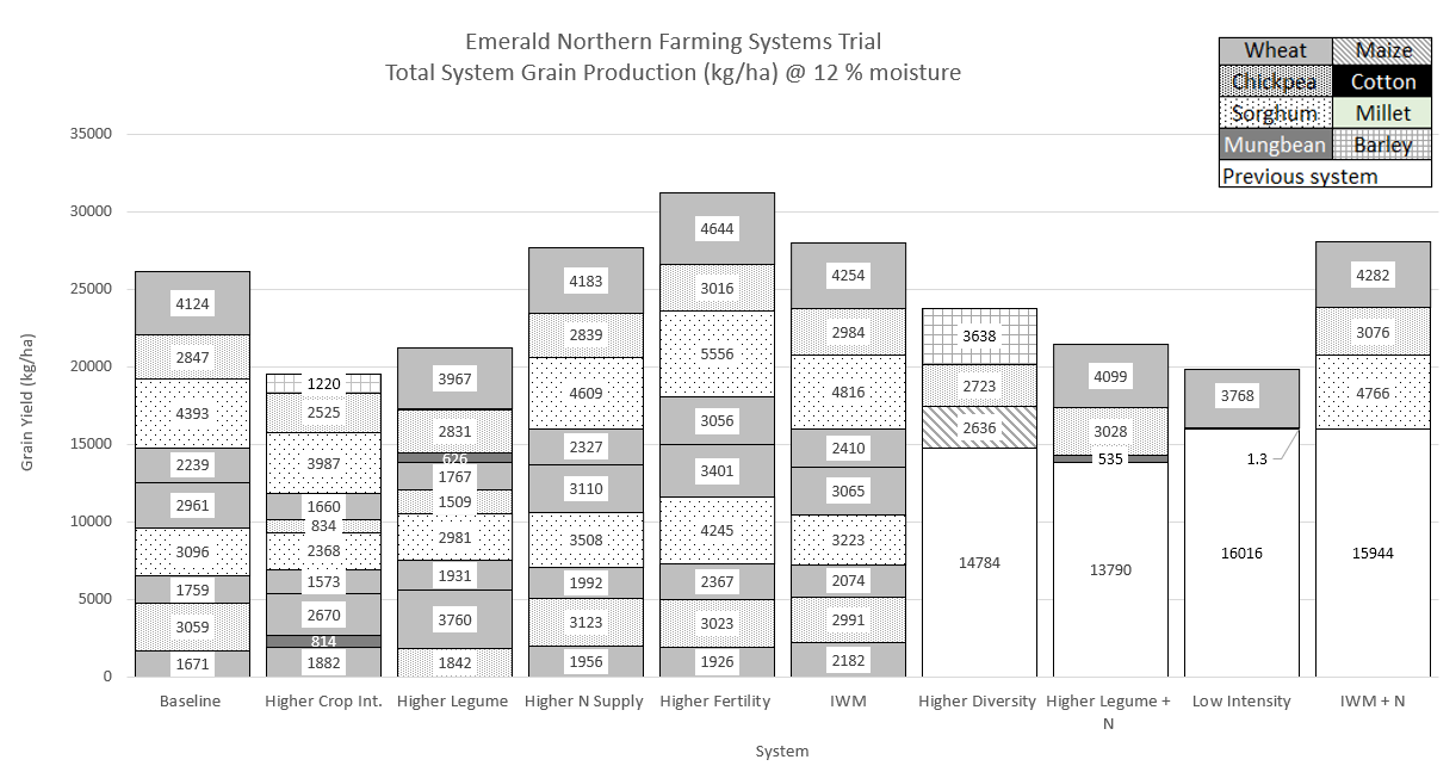
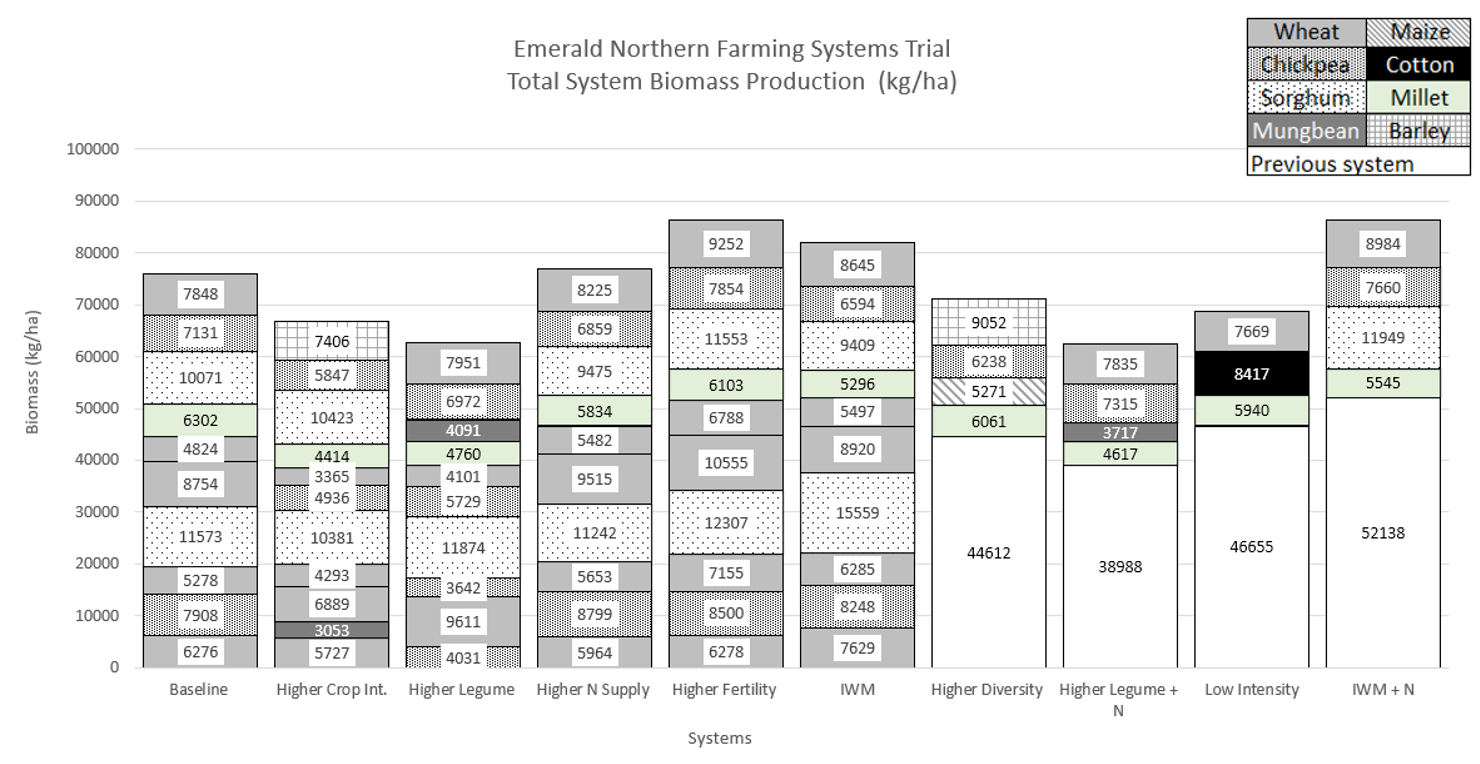
Cumulative yield and biomass data over the duration of the trial were assessed for each system. For the systems that were added after splitting off from one of the six “core” systems, to allow for a quick comparison, the cumulative quantity of grain or biomass produced prior to the split is added to the system graphs (Figure 6).
Figure 6. Cumulative grain production (kg/ha) for all 10 systems since 2015. For systems which started in 21/22, the cumulative total of the parent system prior to commencement has been added to the base of that column. On raw production volume, after nine grain crops, the Higher fertility system has produced 31 t/ha, which is 5 t/ha more than the Baseline system, with an identical cropping rotation.
The best performing system with respect to total grain production has been the Higher Fertility system, which has accumulated 31 t/ha from nine grain producing crops (Figure 6). The IWM + N system marginally out performed the IWM system by 71 kg/ha. The Baseline system ranked 5th with a cumulative deficit of 5 t/ha lower than the Higher fertility system.
Biomass production
The biomass production is correlated with yield, the difference between Higher fertility (86.3 t/ha) and IWM + N is minimal at 68 kg/ha after 10 crops over nine years (Figure 7). Comparing the biomass production between the Baseline and Higher N systems shows 1 t/ha difference despite the additional N fertiliser applied to the Higher N.
Figure 7. Cumulative biomass production (kg/ha) for all 10 systems since 2015. For systems which started in 21/22, the cumulative total of the parent system prior to commencement has been added to the base of the that system column.
Economics
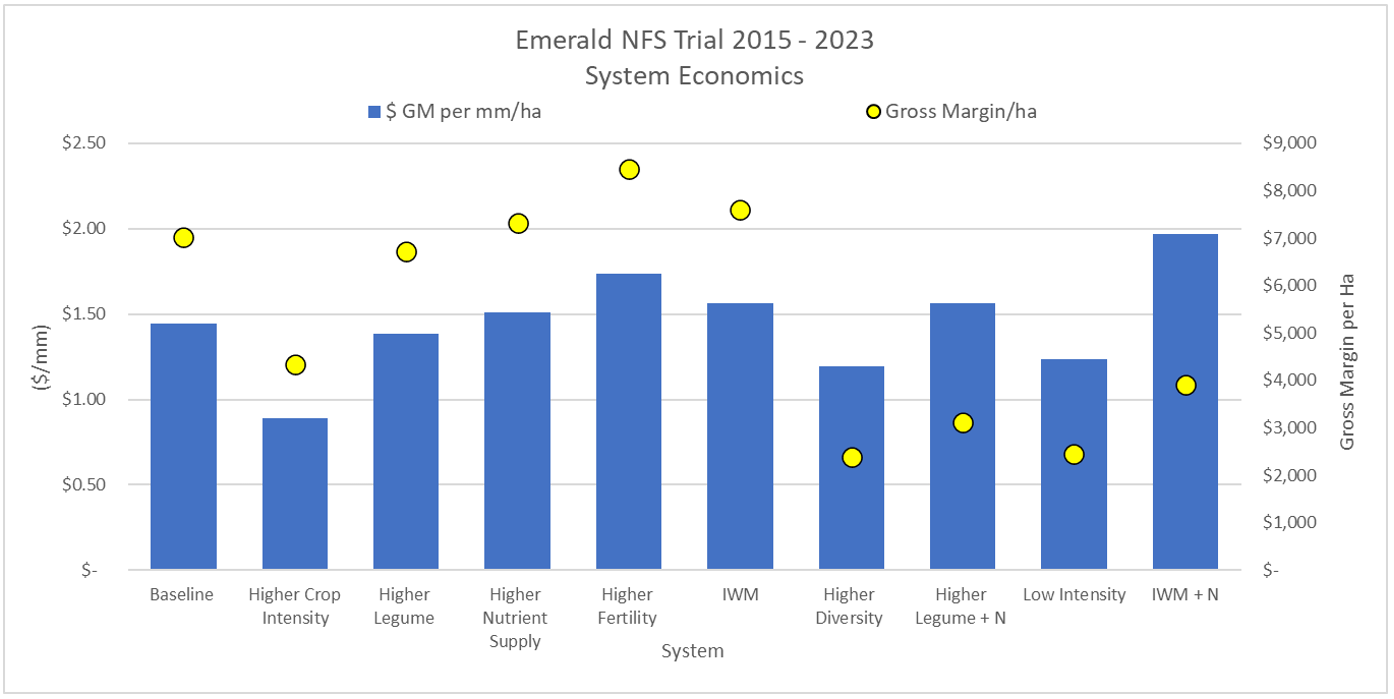
An economic analysis calculated the gross margin (GM, $/ha) and GM per mm ($/mm/ha) of all systems and their interactions across and within QLD and NSW sites. The Emerald GM data shows that the Higher fertility system has been the best performing system for the past nine years with $8450/ha which is higher than the six original systems by $850/ha and the Baseline system by $1450/ha (Figure 8). The IWM system is next highest GM with $7602/ha and Higher Nutrient supply system at $7327/ha.
Figure 8. GM (circles) and GM/mm/ha (columns) for the duration of system for each system at the Emerald Northern Farming System site.
The cost of the manure application was not factored into the Higher fertility system as it was never intended to be a “manure” system, rather the manure was applied as a strategy to increase the level of soil fertility to levels when the site was first farmed. The strategy to apply nutrition to target the 90th percentile of crops is to help maintain fertility levels. The input costs of applying manure was calculated on a purchase price of $15/t plus $20/t transport plus $3/t to spread (based on an application rate of 60 t/ha). On a per ha basis this equates to $2280/ha.
The system with the highest GM/mm was IWM + Nutrition at $1.97/mm/ha since its commencement in late 2021. Higher fertility sits second at $1.74/mm/ha while Baseline returned $1.44/mm/ha to date.
Nutrition
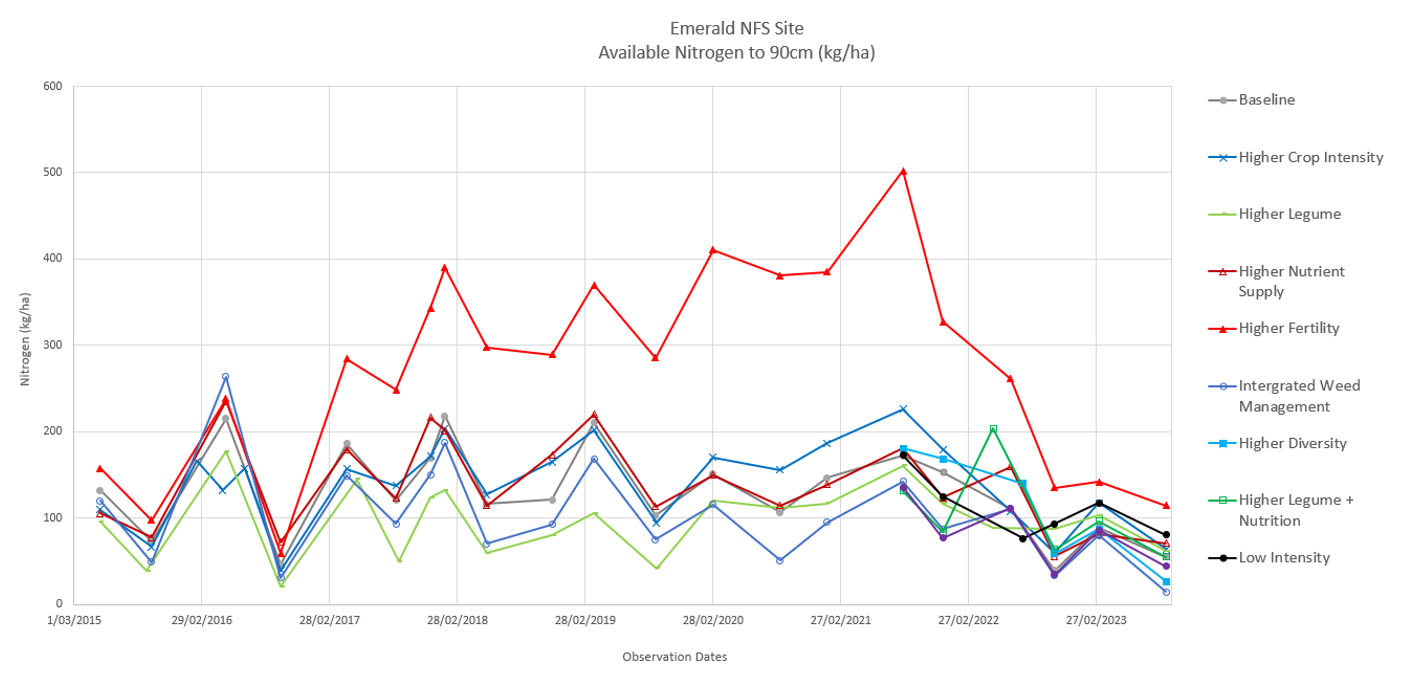
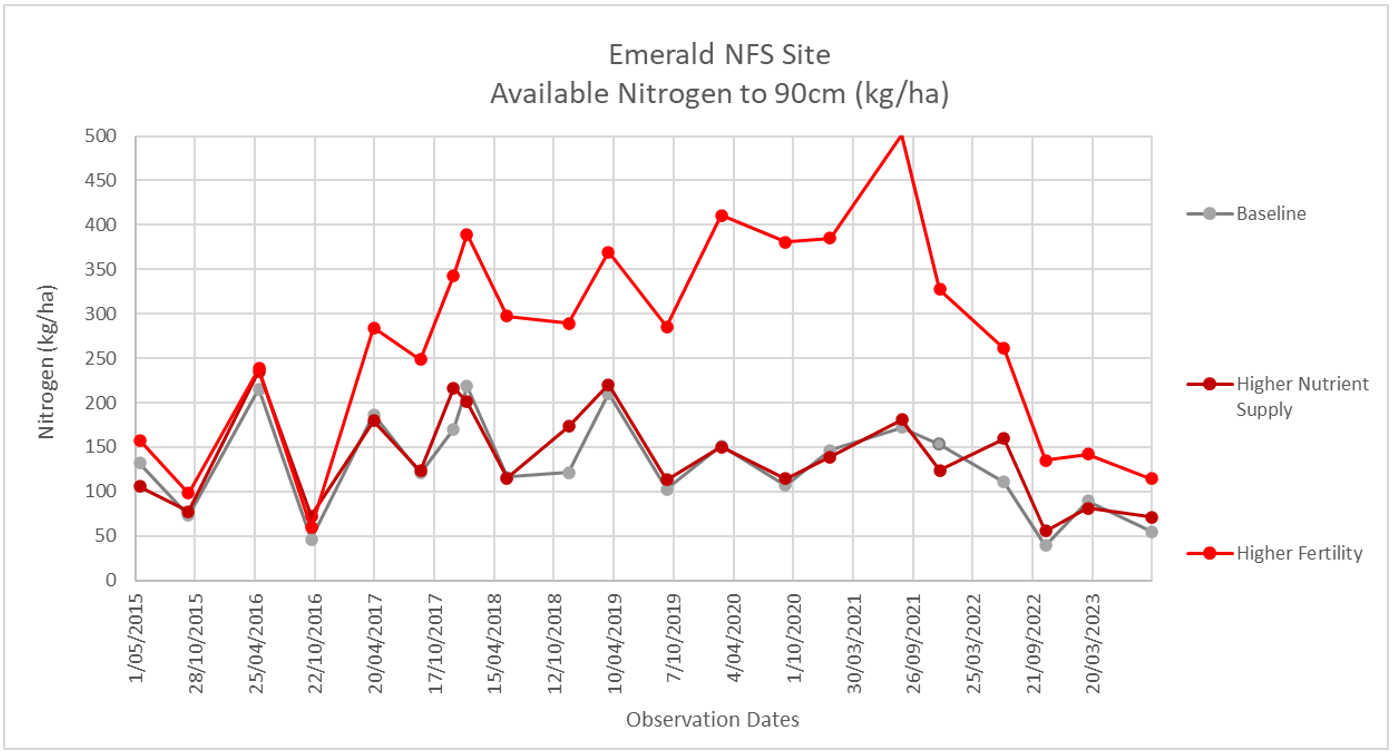
System available N is measured both pre-plant and post-harvest for all crops to a depth of 90 cm (Figure 9) which enables the monitoring of total N cycling over time and monitor where the N is in the profile. As the trial progressed, N levels fluctuated from system to system and crop to crop relative to the Baseline. The most obvious deviation has been the Higher fertility system which sits consistently above all other systems, the increase in soil N became obvious post the second manure application in late 2016.
Figure 9. Profile average available N for all ten systems down to 90 cm since 2015. The graph shows the average available N for each of the systems when tested pre plant and post-harvest.
The High fertility system peaked at over 500 kg/ha of available N down to 90 cm in late August 2021, after an extended fallow period post the wheat crop in 2020. But it is important to note that it has maintained levels above 250 kg/ha since March 2017. For many, there is a concern that high N levels like these will produce lots of biomass and run out of water to fill if the season goes against you.
Yet when you compare the screenings, protein and yield of crops grown between 2017 and 2020 for Higher Fertility and the Baseline system (Table 5), the Higher fertility system consistently out yielded Baseline, had similar or higher grain protein, but most importantly, had lower screenings, three years out of the four. 2018 started wet and ended in very hot dry conditions during flowering and grain fill, while 2019 started well, but the rain stopped after July leading to another hard dry finish.
Table 5. Grain yield, quality and protein comparison between Higher Fertility and Baseline systems
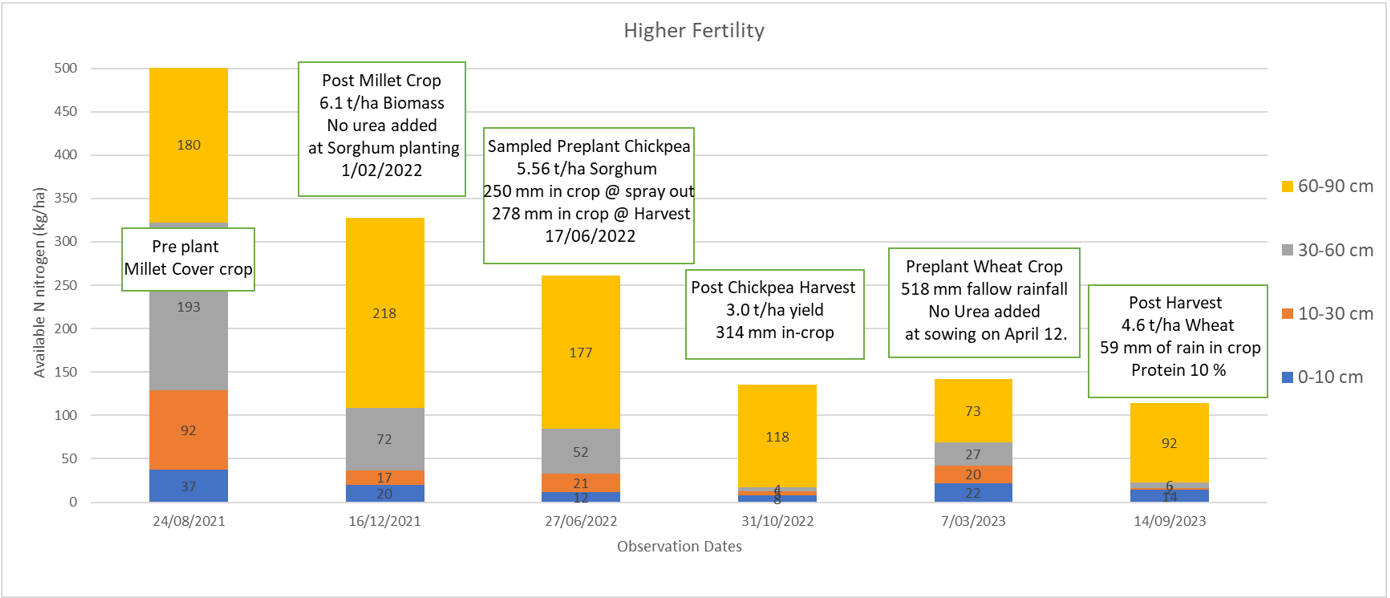
The second most notable observation is just how quickly the N levels have declined post the millet cover crop – sorghum – chickpea – wheat crops between late 2021 and September 2023. To still have 114 kg/ha of N available post-harvest 2023 still seems acceptable, when you consider the N levels for systems like the two IWM systems, however it’s not until you look at where that N lies in the profile that you see how dramatic the decline has been.
Figure 10. Higher Fertility profile N down to 90 cm from August 2021 to October 2023. Each stacked bar indicates available N for any given sampling date in increments.
Anecdotally, the 2021 millet cover crop used 175 kg N/ha to produce 6.1 t/ha of biomass, the majority of which was drawn from 0-60 cm. The millet was terminated at flowering and residues remained. That system was then planted to sorghum in early February, which received 250 mm prior to spray out and produced 5.56 t/ha of grain despite some very hot dry conditions in March – early April. The difference between planting and harvest N for that crop was –66 kg/ha of N. Such a small difference for that amount of grain would indicate that as the millet residue was breaking down, (which it did quickly during that crop) and some of the available N was being picked up by the developing sorghum crop.
The sorghum was harvested on the 17/06/2023, with almost a full moisture profile thanks to 180 mm of the 278 mm of rainfall from late April onwards. Profile N indicated there was 261 kg N/ha available at planting, however 177 kg N/ha of that was in the 60 – 90 cm profile area. The crop, though late sown and double cropped, yielded 3 t/ha thanks to the additional 314 mm of in-crop rain and the very mild spring temperatures. But N levels down to 60 cm were exceptionally low post harvest. The full profile test indicated 135 kg/ha of N, but only 17 kg/ha of that was available above 60 cm. The chickpea crop produced 7.85 t of biomass, and as the crop was harvested with a header equipped with a chopper, breakdown of that stubble was going to be relatively quick.
An additional 518 mm of rainfall was received post the chickpea crop until the next crop was planted in April 2023. Water triggers were hit for a summer cereal crop, but because of the rainfall received during the planting window and significant wheel track issues from the previous two crops that needed to be corrected, a winter crop was targeted for 2023 instead.
Total N at planting was 142 kg/ha, which meant no additional N was required. Of that total figure indicated, only 7 kg N/ha had mineralised post-harvest of the chickpea. There does however appear to have been a redistribution of N through the profile, with N below 60 cm down from 118 kg to 73 kg/ha, but N above 60 cm containing 69 kg/ha instead of 17 kg/ha.
The 2023 season was very dry but started with an almost full profile. Total in-crop rain was 59 mm for this system, 24 mm of which fell four days after sowing, 27 mm fell in early July and the sundry being made up of incidental showers of less than 2 mm. The wheat yielded beyond expectations for the season, producing 4.6 t/ha of grain, and 9.2 t/ha of biomass. Profile N down to 90 cm is 114 kg/ha, however only 23 kg/ha of that is above the 60 cm. (Figure 10)
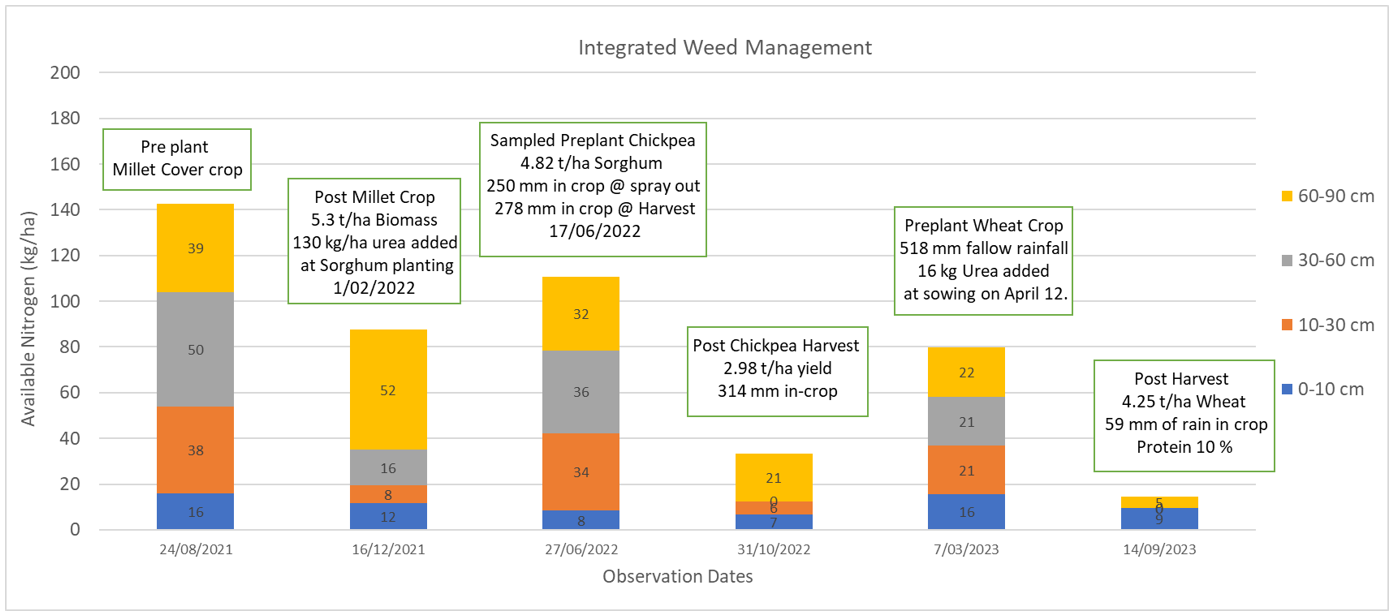
Figure 11. Integrated Weed Management (IWM) profile available N down to 90 cm from August 2021 to October 2023. Each stacked bar indicates available N for any given sampling date in increments.
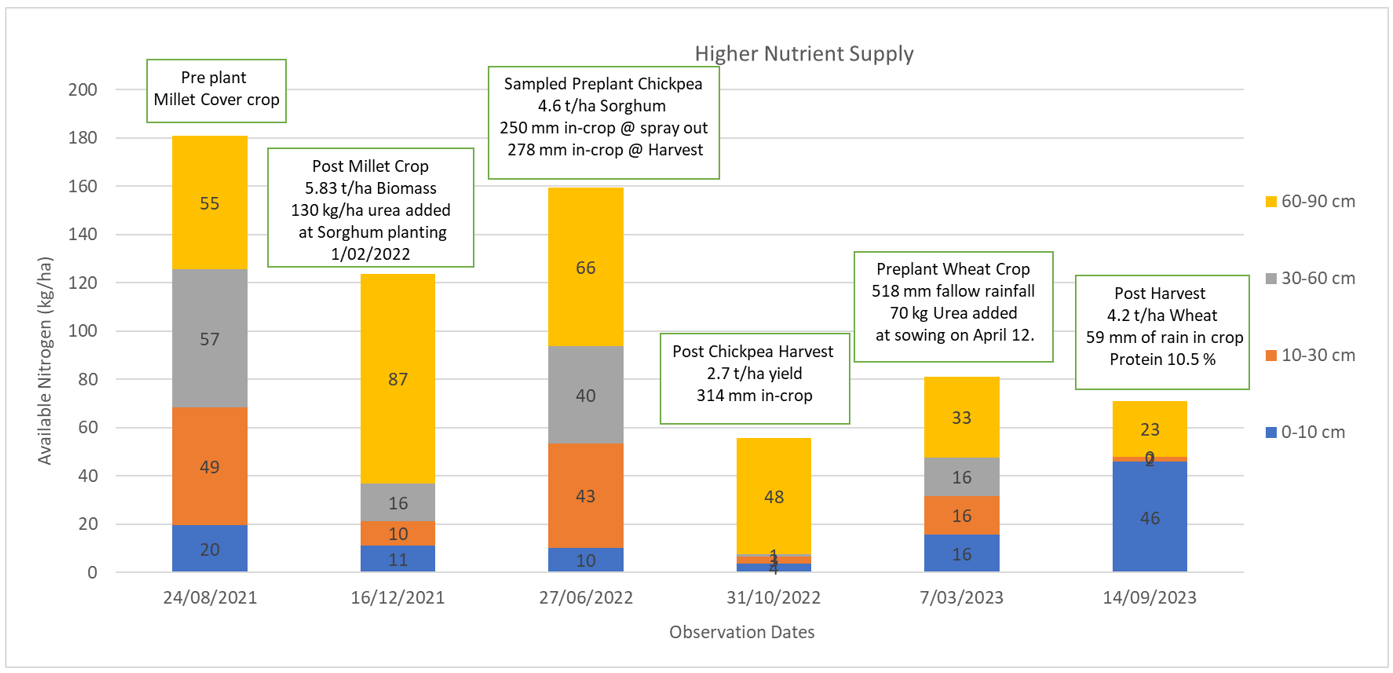
As a point of contrast, I have included the same depth increment graphs for both the IWM system and the Higher Nutrient Supply systems. Both systems have had identical cropping cycles to the Higher Fertility system, the difference being that the IWM system uses a 50th percentile nutrition program, but also plants on narrower row spacings. The Higher nutrient supply system uses a 90th percentile nutrition system, on the same row spacing as the Higher fertility system (and Baseline).
The first and most important thing to note about these two system graphs is the Y axis scale. The Higher fertility system (Figure 10) went up to 500 kg/ha, these two systems (Figures 11 & 12) only go up to 200 kg/ha. Like the Higher fertility system, both these systems started with adequate N levels distributed across the profile after the fallow in 2020–21. Post the millet crop, which produced 5.8 t for Higher nutrition and 6 t for IWM, we again saw a significant draw down of N from the 0 – 60 cm part of the profile, leading into the summer sorghum crop. At planting 60 kg N/ha was required and applied for both systems when planting sorghum, and yields were 4.8 t/ha for IWM and 4.6 t/ha for Higher nutrition.
Here we see the first diversion from the Higher fertility system (which received no additional N). Available N levels were higher after harvest of the sorghum crop compared to preplant. IWM increased by 24 kg N/ha, while Higher nutrient supply increased by 35 kg N/ha over the same period. While less than the N applied at planting, considering that both systems had just produced over 4.5 t of grain and 9.4 t of total biomass, it appears that the rapidly breaking down millet residue did contribute additional N to the crop.
Figure 12. Higher Nutrient Supply profile of available N down to 90 cm from August 2021 to October 2023. Each stacked bar indicates available N for any given sampling date in increments.
Post chickpea, like the Higher fertility system, there was very little residual N left in these systems, particularly above 60 cm. Total N was higher for the Higher Nutrient Supply system, with a total of 56 kg/ha available down to 90 cm, compared to 33 kg/ha for the IWM system, however of those values, only 13 kg was available above 60 cm for the IWM system and 8 kg for the Higher nutrition system.
N mineralisation post chickpea was 47 kg/ha for the IWM system and 25 kg/ha of N for the Higher nutrition system. It appears that for this fallow period, the lower the finishing post-harvest N, the greater the mineralisation (Table 6). Across the 10 systems (with Higher Crop Intensity as a notable exception) generally the lower the starting N post-harvest, the greater the fallow mineralisation, with IWM + N mineralising 52 kg/ha, down to Higher fertility at only 7 kg/ha, a long way short of the 100 kg/ha plus mineralisation observed between 2016 – 2021.
Table 6. N mineralisation (kg/ha) post chickpea going into the 2023 winter cereal crop. Apart from Higher Crop Intensity, there appears to be almost a linear response to mineralisation base on how much N was available post-harvest.
At planting, 35 kg N/ha was applied to the Higher nutrition system and 16 kg N/ha should have also been applied to the IWM system, unfortunately due to a transcribing error, only 8 kg/ha was applied. Yields were well above expectation despite minimal in crop rain, with both systems averaging just over 4.2 t/ha grain yield, while producing in excess of 8.6 tonne of biomass for the IWM system and 8.2 t/ha for the Higher nutrition system. Grain protein for the Higher nutrition system was 10.5% while the IWM system was 10%.
Both systems had almost identical N going onto the 2023 season, planted at the same time and despite the row spacing difference, produced almost identical amounts of grain. The biggest difference between the two systems was residual N post-harvest. The IWM system had a total of 15 kg/ha of N remaining down to 90 cm. The higher nutrient system had 71 kg N/ha remaining in the profile, but unlike the Higher fertility system, which had 92 of its 114 kg N/ha at depth, the Higher nutrition system had 46 of the 71 kg N/ha in the top 10 cm and 23 kg N/ha down below 60 cm with very little in between.
Summary
The Higher fertility system has been the standout of the systems in place in Emerald, both in terms of how high the N profile got and the yield responses achieved relative to the Baseline system, but equally how poorly even the 90th percentile nutrient strategy in place has failed to maintain its fertility levels post 2021.
Figure 13. Available N in the profile down to 90 cm from 2015 to harvest 2023. The graph compares the Baseline (grey), Higher Nutrient supply (dark red) and Higher Fertility (bright red) systems. All three systems have had an identical crop sequence since 2015. Baseline uses a 50th percentile nutrition target while Higher Nutrient supply and Higher fertility use a 90th percentile nutrition target.
Both the Higher nutrient supply system and Higher fertility nutrition requirements are targeted at a 90th percentile crop yield or top 10 % of yield predictions (based on starting PAW) and APSIM modelling for a given sowing date. The ambition being that if additional water became available during the season, these systems would not be lacking available N or phosphorus.
For most of the trial, partly because of the inherent fertility and mineralisation qualities of the soil at the site, additional N application requirements have been minimal as available N in the profile was already above the crop needs (even at the 90th percentile level). Therefore, the variation between Baseline and Higher nutrient Supply has been negligible, with no significant improvement in profile N compared to the Baseline system over the past nine years (Figure 13).
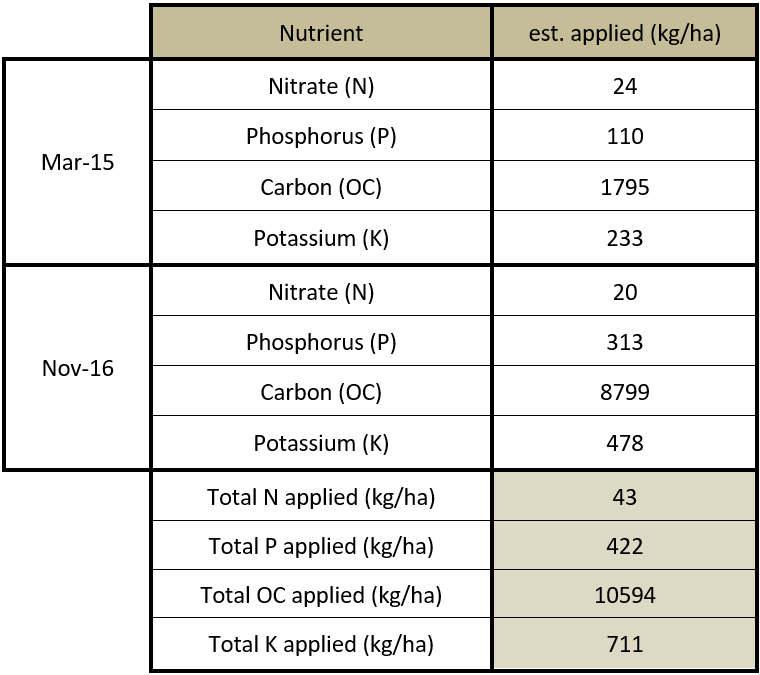
Table 7. Estimated Nutrients applied based on lab analysis of the Manure applied to the Higher fertility system.
For the Higher fertility system, because of the ‘just in time’ nutrition strategy, we have seen an excellent example of what can happen when a system is effectively mined. No N has been applied to that system post 2016, and while the 60 t/ha manure from the additional 10 t/ha of organic carbon (OC) lasted (Table 7), its performance was (and still is) stellar.
However, the quantum of the decline in N levels post the cover crop (175 kg/ha of N), sorghum crop (66 kg/ha of N) and then chickpea (126 kg/ha of N) was surprising. The system still had significantly more N than all others going into this year’s (2023) wheat crop, but most of that was at depth, and net mineralisation had only produced 7 kg/ha during the fallow period (Table 6).
The 367 kg/ha reduction in N was not completely lost to the system. You only need to look at how little net N was removed post the 2022 sorghum crop across the systems, relative to the crop yields and biomass produced to understand that N tied up in the millet residue had already begun returning to the system. That residue broke down quicky post desiccation in early November 2021, and by chickpea planting in 2022, groundcover was limited.
It will be interesting to track this system moving forward. Even if the organic carbon (OC) boost has been used, the additional benefits of the significant amounts of P, K and other nutrients (Table 7) present in the manure at the time of application will still be present and may continue to offer an advantage to it for some time yet.
Chickpea in high N scenarios
Questions remain around what effect planting a chickpea crop into soil with plenty of available N would have. N levels across all systems (particularly those in sync with the Baseline) were at the lowest level they have been, after the 2022 chickpea, or at least since post-harvest of the last chickpea crop back in 2016 (which also happened to be grown in a wet year). While the crop yielded on average across the systems 2.9 t/ha and produced 6.9 t/ha of biomass, it also extracted an average 81 kg/ha of N to do so.
Despite a wet summer, and a profile with plenty of water and warm conditions over the fallow period, we did not see the levels of mineralisation in 2022–23 (Table 6) that we did in 2016–17. That fallow, post chickpea, the Baseline mineralised 141 kg/N/ha, Higher nutrient supply mineralised 108 kg N/ha and Higher fertility mineralised 224 kg/N/ha. Those crops averaged 3 t/ha grain yield and 8.3 t/ha biomass, however when the chickpeas were planted, there was an average of 238 kg/ha of N available. These were levels that weren’t seen again until pre-sorghum 2018.
There are many significant benefits to growing chickpea within a cropping rotation, however, believing that you will be significantly adding N to a profile which may already have reasonable to good fertility, may not be one of them.
Stratification
The Higher nutrient supply system in 2023 received 32 kg/ha of N at planting, 16 kg N/ha was present prior to application, and post harvest 46 kg N/ha was found in the top 10 cm (Figure 12) yet the layers between 10 and 60 cm had little N remaining. Much of the N applied had become stratified due to application onto an already full moisture profile and the lack of significant rainfall later in the season to move the N down into the root zone. This effect was consistent for the Lower intensity system and the Higher legume + N system.
Stratification is well understood and is common, particularly in winter crops in CQ which are grown on sub soil moisture with minimal in crop rainfall post planting. The Higher legume + N system, when planted to a pulse crop aims to leverage stratification so sufficient N to replace the expected N removal of a pulse crop will be available post-harvest for the next crop
The only system that didn’t see as significant a case of stratification was the IWM + N system which had its N applied at the end of March instead of at planting in April. That system received 35 mm of rainfall between application and planting which seems to have been sufficient to make it available to the crop.
mm to $
Ultimately as system managers, as much as we like to think the aim is produce more grain, more protein or more fibre, when it is all paired back to bare basics, what we are fundamentally doing is trying to convert rainfall in cashflow. In the WUE section (Tables 3 & 4) I broke down the WUE and FE of the different systems to date.
In summary after nine years:
- Average rainfall – 560 mm
- Average time in crop – 40 %
- Average rainfall in crop – 28 %
- Fallow efficiency – 20 % (soil PAW increase over fallow ÷ fallow rainfall)
- Water use efficiency – 12.9 kg/mm/ha
While interesting in isolation, they don’t highlight the variation between the systems which have been in place at Emerald since 2015/2021, nor the financial repercussions of the system choices. In Table 8, there is a “what if” scenario, showing annual returns per system for a 2000 ha cropping enterprise in CQ with an annual rainfall of 560 mm per year.
In the table, the GM/mm/ha values have been used from the economics section and obviously don’t change, however now they have been extrapolated out to the value across the full enterprise. In addition, the average PAW used by the crop has been calculated, based on the crop water use percentage above for each system. Using this value, we can put a value to every mm of rainfall a crop uses and what that is worth to the enterprise.
Table 8. Case study showing what value per mm for each system would have provided annually for a 2000 ha enterprise with an annual rainfall of 560 mm per year. Enterprise $/mm of rainfall shows the system value per mm to the entire enterprise. Enterprise Annual $ GM extrapolates out the gross margin per ha across a commercial enterprise of 2000 ha.
The annual difference between the best (Higher fertility) and the worst (Higher crop intensity) was $948,000 per year across the 2000 ha enterprise. Even the gap between Higher fertility and the Baseline system was $330,000 per year, which is still significant.
However, these numbers do not necessarily tell the true story of the systems performance. To replicate a manure-based solution like Higher fertility, if you could get sufficient product, as discussed, it could cost more than $2200 per ha, which would have reduced its ranking to below the Higher Legume system to around $1.29 per ha over the 9 years. Equally the IWM system and the Higher Legume systems had outperformed Baseline consistently up until recent times, but at what cost to soil fertility.
Even the Higher nutrient supply and Higher Fertility systems may have looked quite different if the higher nutrient calculations had been a fixed value, vs a trigger level policy. Of the four split systems, IWM + nutrition annual gross margin is certainly very impressive and a possible indication of what IWM could have been, however given how recent their introduction has been, I would still consider those values with scepticism.
Call to action
Systems matter – For the Emerald site, a more conservative cropping strategy (one crop per year) but on a non-limiting nutrition plan has been the most consistent strategy to maximise returns. It sounds basic, but planting into plenty of moisture, at an optimal sowing date for that crop to reduce stress risk, with non-limiting nutrition will always produce the best outcomes over the long-term. Any system that has been “pushed” because of PAW/sowing date/sowing depth/crop choice or density, has at some point in time taken a hit, and rarely been able to catch that lost ground up.
Nutrition – No system on the medium/standard crop intensity and higher nutrition plan have fallen behind the baseline system with respect to system economics. The additional N applications made at planting have always improved returns. However, after nine years and some high yielding crops, there is scope for future nutrient strategies to include higher N rates and applications early in the fallow to improve N availability to crops.
WUE and FE – The variation between systems, but also across crops within a system, for both indices indicate that there is room for improvement of both. Ignoring the Higher fertility system, of the other medium crop intensity systems, IWM’s FE% and WUE was as good or better than most other systems with a GM to match. With early indications from the plus nutrition split positive, a move back to narrower row spacings could be a positive move, so long as the logistical challenges can be overcome.
Acknowledgements
The research undertaken as part of this project is made possible by the significant contributions of growers through both trial cooperation and the support of the GRDC, the author would like to thank them for their continued support.
Also like to acknowledge CSIRO, New South Wales Department of Primary Industries and the Queensland Department of Agriculture and Fisheries Regional Research Agronomy Team for their management of and contribution to the trials across QLD and NNSW.
Finally, I would like to recognise my colleagues and local team members Jane Auer, Katie Hullock, (Ellie Parkinson), Doug Sands, Gail Spargo and Peter Agius for all their efforts over many years assisting in pulling it all together.
Contact details
Darren Aisthorpe
Department of Agriculture and Fisheries - QLD
99 Hospital Rd. Emerald QLD
Ph: 0427 015 600
Email: [email protected]
Date published
November 2023
GRDC Project Code: DAQ1406-003RTX,
Was this page helpful?
YOUR FEEDBACK

