2035 greenhouse gas modelling projections for the Western Australian grains industry
2035 greenhouse gas modelling projections for the Western Australian grains industry
| Date: 27 Feb 2024
Key messages
Aims
Introduction
Grains is the largest agricultural industry in Western Australia by gross value of agricultural production (GVAP). In the 2021–22 financial year (FY), the industry contributed $10.8 billion to WA’s GVAP, 66% of the State’s total (Maharjan et al 2023).
There is a growing awareness of the potential value of sustainability credentials, such as verified greenhouse gas accounts for agricultural products. The grains industry already emphasises carbon accounting and benchmarking practices, allowing it to monitor its emissions and to identify mitigation opportunities. For example, due to WA canola’s demonstrated low emissions footprint, a significant portion of the crop is exported to European biofuel markets(Sevenster 2023). Additionally, the CBH Group recently announced the first shipment of carbon-neutral barley for beer production(CBH 2023).
When analysing greenhouse gas emissions, it is important to differentiate among agricultural industries, as the prominence of different emissions sources varies greatly by industry. DPIRD has published a baseline for the agricultural sector’s emissions (Curnow et al. 2022), but WA agriculture’s indirect emissions, which for the grains industry make up a very significant share of total emissions, are not widely known.
Direct emissions, also referred to as scope 1, occur on the farm and include agriculture sector emissions as per the National Inventory Report (NIR – DCCEEW 2023b) and some emissions from fuel use. Scope 2 covers indirect emissions from the production of electricity. Scope 3 includes indirect (embedded) emissions from the manufacture of inputs such as fertilisers, lime and chemicals.[1]
Method
The boundary of this analysis is the farmgate, with all relevant scope 1, 2 and 3 emissions considered, except land use-related emissions and sequestration activity on farmland. It is acknowledged that these sources form important parts of the greenhouse gas account of agricultural businesses. The farmgate boundary excludes scope 3 emissions from post-farm processing.
For long-term emissions projection modelling, FY 2019–20[2] was chosen as the baseline. For emissions sources captured by the NIR, the baseline emissions estimates are based on data obtained from the NIR 2021 (DCCEEW 2023b). To estimate emissions sources not captured by the NIR, industry data on farm inputs (Farmanco 2020, Planfarm 2020, Rural Solutions SA 2020) as well as commonly used emissions factors (DCCEEW 2023a, Lopez et al. 2023) were used. The projected emissions to 2034–35 reflect the most likely trajectory given current investment patterns by industry and government, as well as assumptions about expected industry growth, gains in production efficiencies, and the adoption of low-emissions technologies and practices. These assumptions were based on input from industry and subject matter experts who participated in a workshop in March 2023.
The long-term adoption of emissions-reducing practices and technologies are highly uncertain, as they depend on a complex set of implementation barriers and enablers, including economic factors and governmental policy positions that are not yet fully articulated. Acknowledging this, the modelling relies on conservative assumptions regarding emissions reduction potentials and adoption rates. The modelling also reflects high-level assumptions about the decarbonisation of other parts of the WA economy. Finally, future industry growth – a key determinant of future emissions – is also highly uncertain. To broadly capture the uncertainty, a sensitivity analysis considers a lower level of growth.
Results
Reflecting input from grains industry and subject matter experts regarding future growth, the industry’s total emissions are expected to grow from 4.29 million tonnes (Mt) of CO2e to 6.93 Mt of CO2e, as shown in Figure 1. This corresponds to a 63% increase in emissions from 2019–20 to 2034–35, compared to an expected 67% increase in production over the same period. If this projection is accurate, the grains industry will most likely have the largest emissions footprint among WA’s agricultural industries by 2034–35. The increase in emissions is slightly lower than the increase in production, reflecting the expected adoption of mitigation technologies and practices under current investment patterns. The reductions achieved through mitigation strategies are listed by source in Table 1.
In a sensitivity analysis that reduces industry growth to 2% per annum, emissions are estimated to reach 5.56Mt of CO2e by 2034–35. While considerably lower, this estimate still makes the grains industry the largest emitter among WA agricultural industries by 2034–35.
Improving nitrogen use efficiency would reduce nitrous oxide emissions from nitrogenous fertiliser application and related pre-farm emissions of carbon dioxide. This could happen in response to increasing fertiliser prices or other market signals. Efficiency could potentially also be improved through use of slow release and urease inhibitor formulations. However, in order to capitalise on good seasons nitrogen use is likely to be maximised rather optimised, increasing emissions. Nevertheless, current modelling shows that emissions could be reduced by economically optimising nitrogen application before and during the season (d’Abbadie et al 2024a). Other options encompass the use of legumes in pastures (Kharel et al 2022) and in crop rotations (d’Abbadie et al 2024b).
Table 1. Emissions reduction strategies and potentials for reduction from 2019–20 to 2034–35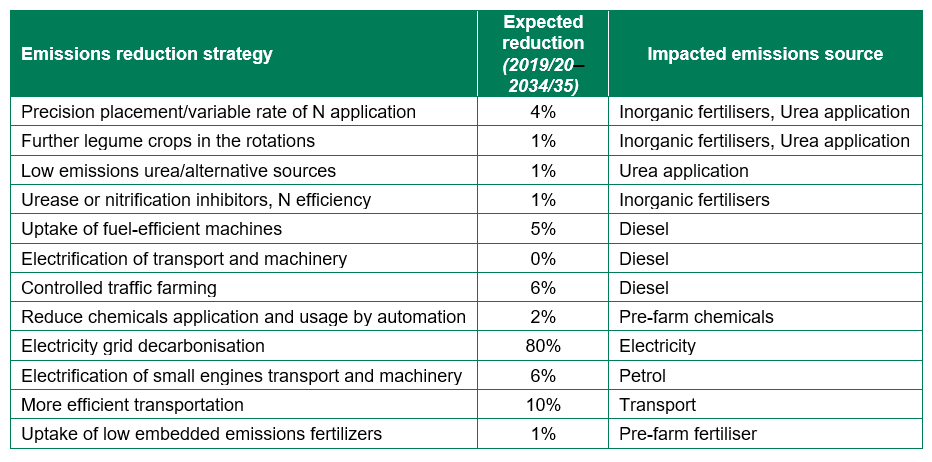
As shown in Figure 1, while the 2020–21 reported emissions appear to be in line with the long-term projections, the estimated emissions for 2021–22 and 2022–23 are substantially higher than the long-term trend. The main reason for these peaks is the record harvests in both years (26.0Mt in 2022–23, GIWA 2023a). The record yields in those years significantly increased emissions from crop residues. However, 2023–24 has seen a significant reduction in emissions, attributable to the lower total production of 14.5Mt (GIWA 2023c) and a 3% reduction in the cropping area (GIWA, 2023b).
About 49% of emissions occur off-farm in the production of inputs (i.e. scope 3 pre-farm emissions), as shown in Table 2. Of these inputs, chemicals account for 24% of total emissions, followed by fertilisers at 22%. The largest sources of emissions on-farm are nitrous oxide released from the breakdown of crop residues (17% of total emissions) and from nitrogen fertiliser application (16%). The use of fuel, urea and lime each contributed about 9% of total emissions. Between years (2019–20 to 2023–24), the proportion of each scope vary dependent on crop yields (higher yields resulting in higher emissions from crop residues) and nitrogen fertiliser application. By 2035, scope 2 emissions are almost negligible as it is assumed that WA’s electricity generation will gradually be decarbonised.
 Figure 1. Grains industry reported and estimated emissions against the long-term projection.
Table 2. Estimated emissions by scope 2019–20 to 2023/24 and 2034–35.

Several key factors influence the projections to 2034–35. First, fertiliser and chemical use is projected to increase in line with industry growth, with emissions from these sources forecast to constitute around 50% of total emissions by 2034–35. Emissions from crop residues, the application of urea and lime, as well as diesel use are expected to see a similar upward trend.
Lowering emissions requires the optimisation of fertiliser application, adopting new fertiliser formulations, and integrating more legumes into crop rotations to lower the need for nitrogen inputs. This could collectively mitigate fertiliser related emissions by 7–12%. Advances in machinery efficiency and further use of controlled traffic farming practices could result in an additional reduction of approximately 7% of emissions from fuel, chemicals and fertilisers.
Emissions intensity
Under current projections, the emissions intensity of grain production is unlikely to improve significantly by 2034–35, because predicted higher yields will require a proportionally higher level of inputs such as fertilisers, chemicals and fuels.
Current emissions intensity estimates fluctuate from year to year due to variability in yields. For instance, the record harvests in FY 2021–22 and FY22–23 meant a low emissions intensity per tonne of grain produced in those years. At the same time, the emissions per hectare cropped were relatively high due to higher emissions from crop residues. By contrast, FY 2023–24 had a lower grain production, increasing the emissions intensity per tonne of grain produced. In other words, emissions intensity per tonne of grain is more responsive to changes in yields than intensity per hectare.
A caveat to these findings is that the emissions intensity is averaged over all grains produced in WA. Thus a shift in crop portfolio (e.g. towards crops with higher emissions intensity, such as canola) in response to market signals and technology could significantly impact the average level of emissions intensity. It is important to note that the confidence level of these estimates is low and they will be revised as better data becomes available for each crop.

Figure 2: Estimated emissions intensities per hectare cropped (left) and per tonne of grain (right).
Research gaps
This is the first time such modelling work has been done for the WA grains industry, and so estimates will be updated as new data becomes available, and future work should address the following research gaps:
- Large volumes of emissions are thought to arise from crop residues, but site and regionally specific values have not yet been determined.
- An opportunity could exist to better cycle nutrients from intensive livestock onto crops. Limitations to their use, however, include the distance to use, volumes available and processing of nutrients suitable for transport and broadscale application.
Conclusion
Grain production is the second largest emitter among WA’s agricultural industries. Under current growth expectations, the grains industry could overtake the beef industry to become the largest emitter by 2035. Despite increasing efforts to account for and reduce emissions, the limited adoption of current low-emission practices is likely to keep average crop emission intensities relatively stable. Strategic interventions at both industry and farm levels, including policy and technological innovation, may be needed to lower emissions. Grains industry emissions are in large part made up of emissions related to fertiliser use, highlighting the potential gains for the industry if (i) nitrogen use efficiency can be improved, (ii) the use of legumes in rotations can be increased, and (iii) if future fertilisers can be manufactured and used in ways that generate fewer emissions. In navigating the balance between growth and environmental sustainability, development and adoption of low-emission practices are crucial to ensure a sustainable future for the WA grains industry.
Acknowledgments
The authors acknowledge the contributions of Integrity Ag & Environment as well as valuable feedback from Prof Ross Kingwell and Dr Gus Manatsa.
Contact details
Christophe d’Abbadie & Johnny Machon
DPIRD
Level 6 1 Nash St, Perth
Ph: 0432025447
Email: christophe.dabbadie@dpird.wa.gov.au; johnny.machon@dpird.wa.gov.au
References
[1] See Cowie et al (2023) for more comprehensive definitions of the different scopes.
[2] The NIR reports estimates for the year 2020 based on inputs/outputs from ABS and ABARES from the FY 2019–20. In other words, emissions related to the harvest from end of 2019 is reported in the 2020 estimates in the NIR.
CBH (2023) CBH achieves Climate Active carbon neutral certification. Available at: https://www.cbh.com.au/media-releases/2023/07/CBH-achieves-Climate-Active-carbon-neutral-certification
Cowie, A., Sevenster, M., Eckard, R., Hall, M., Hirlam, K., Islam, N., Laing, A., Longbottom, M., Longworth, E., Renouf, M., and Wiedemann, S. (2023) A Common Approach to Sector-Level GHG Accounting for Australian Agriculture: Common Terminology for GHG Accounting. CSIRO, Australia.
Curnow M., d’Abbadie C., French B., Bucat J., Stefanelli D., Lantzke N., Almeida Lima V., Austen J., Chester L., Pritchett K., Brady M., Bennett D. (2022) Emissions Baseline Report for the Agriculture Sector in Western Australia. Department of Primary Industries and Regional Development, Government of Western Australia.
d’Abbadie, C., Kharel, S., Kingwell, R. and Abadi Ghadim, A. (2024a) Profitable, low emission nitrogen application strategies in Australian dryland cropping. Crop & Pasture Science 75, CP23057 https://doi.org/10.1071/CP23057
d’Abbadie, C., Kharel, S., Kingwell, R. and Abadi Ghadim, A. (2024b) Should crop sequences include more lupins? Crop & Pasture Science 75, CP23110 https://doi.org/10.1071/CP23110
Department of Climate Change, Energy, the Environment and Water (DCCEEW) (2023a) Australian National Greenhouse Accounts Factors, For individuals and organisations estimating greenhouse gas emissions, February 2023. Australian Government Department of Climate Change, Energy, the Environment and Water, Canberra.
Department of Climate Change, Energy, the Environment and Water (DCCEEW) (2023b) National Inventory Report 2021. Australian Government Department of Climate Change, Energy, the Environment and Water, Canberra.
Department of Industry, Science, Energy and Resources (DISER) (2020) National Greenhouse Accounts Factors, Australian National Greenhouse Accounts October 2020. Australian Government Department of Industry, Science, Energy and Resources, Canberra.
Department of Industry, Science, Energy and Resources (DISER) (2021) National Greenhouse Accounts Factors, Australian National Greenhouse Accounts August 2021. Australian Government Department of Industry, Science, Energy and Resources, Canberra.
Department of Primary Industries and Regions (PIRSA) (2022) Farm Gross Margin and Enterprise Planning Guide 2022. Department of Primary Industries and Regions, Government of South Australia, Adelaide.
Farmanco (2020) Profit Series™ 2020. Farmanco Management Consultants Pty Ltd. Perth.
Farmanco (2021) Profit Series™ 2021. Farmanco Management Consultants Pty Ltd. Perth.
Farmanco (2022) Profit Series™ 2022. Farmanco Management Consultants Pty Ltd. Perth.
Grain Industry Association of Western Australia (GIWA) (2021) GIWA Crop Report – June 2021. Grain Industry Association of Western Australia, Perth. Available at: https://www.giwa.org.au/wp-content/uploads/2021/06/GIWA-Crop-Report-June-2021.pdf
Grain Industry Association of Western Australia (GIWA) (2022a) GIWA Crop Report – February 2022. Grain Industry Association of Western Australia, Perth. Available at: https://www.giwa.org.au/wp-content/uploads/2022/02/GIWA-Crop-Report-2021-Season-wrap-February-2022.pdf
Grain Industry Association of Western Australia (GIWA) (2022b) GIWA Crop Report – July 2022. Grain Industry Association of Western Australia, Perth. Available at: https://www.giwa.org.au/wp-content/uploads/2022/07/GIWA-Crop-Report-July-2022.pdf
Grain Industry Association of Western Australia (GIWA) (2023a) GIWA Crop Report – February 2023. Grain Industry Association of Western Australia, Perth. Available at: https://www.giwa.org.au/wp-content/uploads/2023/02/GIWA-Crop-Report-February-2023.pdf
Grain Industry Association of Western Australia (GIWA) (2023b) GIWA Crop Report – July 2023. Grain Industry Association of Western Australia, Perth. Available at: https://www.giwa.org.au/wp-content/uploads/2023/07/July-2023-Crop-Report-FINAL-14July.pdf
Grain Industry Association of Western Australia (GIWA) (2023c) GIWA Crop Report – November 2023. Grain Industry Association of Western Australia, Perth. Available at: https://www.giwa.org.au/wa-crop-reports/2023-season/giwa-crop-report-november-2023/
Kharel, S., d'Abbadie, C., Abadi Ghadim, A., & Kingwell, R. (2022) Reducing farming system emissions via spatial application of payoff functions. Agricultural Systems, 203, 103534.
Maharjan, D., Akbari, S., Abadi Ghadim, A. K., Mattingley, P., Wilkinson, I., Tan, J., & Van Staden, J. (2023) Western Australia's Primary Industries: 2021-2022 Economic Overview [Report]. Department of Primary Industries and Regional Development, Perth, Western Australia
Lopez M.B., Ekonomou A., Eckard R.J., (2023) A Greenhouse Accounting Framework for crop production (G-GAF) based on the Australian National Greenhouse Gas Inventory methodology. Updated Nov 2023 http://www.piccc.org.au/resources/Tools
Planfarm (2019) Planfarm Benchmarks 2019 Season. Planfarm, Perth
Planfarm (2020) Planfarm Benchmarks 2020 Season. Planfarm, Perth
Planfarm (2021) Planfarm Benchmarks 2021 Season. Planfarm, Perth
Planfarm (2022) Planfarm Benchmarks 2022 Season. Planfarm, Perth
Rural Solutions SA (2020) Farm Gross Margin and Enterprise Planning Guide 2020. Rural Solutions SA, Adelaide.
Rural Solutions SA (2021) Farm Gross Margin and Enterprise Planning Guide 2021. Rural Solutions SA, Adelaide.
Sevenster M. (2023) Greenhouse gas emissions from the cultivation of canola oilseed in Australia. CSIRO, Australia.
Shukla, P.R., Skea, J., Calvo Buendia, E., Masson-Delmotte, V., Pörtner, H.-O., Roberts, D.C., Zhai, P., Slade, R., Connors, S., vanDiemen, R., Ferrat, M., Haughey, E., Luz, S., Neogi, S., Pathak, M., Petzold, J., Portugal Pereira, J., Vyas, P., Huntley, E., Kissick, K., Belkacemi, M., Malley, J. (eds.). IPCC, 2019: Climate Change and Land: an IPCC special report on climate change, desertification, land degradation, sustainable land management, food security, and greenhouse gas fluxes in terrestrial ecosystems. In press.