A deeper understanding of higher yields in irrigated crops
A deeper understanding of higher yields in irrigated crops
Author: Ben Morris, Tom Price, Rebecca Murray and Nick Poole (Field Applied Research (FAR) Australia) | Date: 20 Feb 2024
Take home messages
- Adding irrigation water does not free us from the constraint of heat and reduced solar radiation.
- Ideal seasonal conditions in 2020–2021 allowed for cereal yields over 10t/ha, maize over 19t/ha, canola and chickpeas around 5t/ha, and faba beans of almost 8t/ha.
- Despite the high yields, nitrogen responses were much lower than expected, with no response recorded over 250kg/ha of N (maize) and generally between 150–200kg/ha of N (canola and winter cereals).
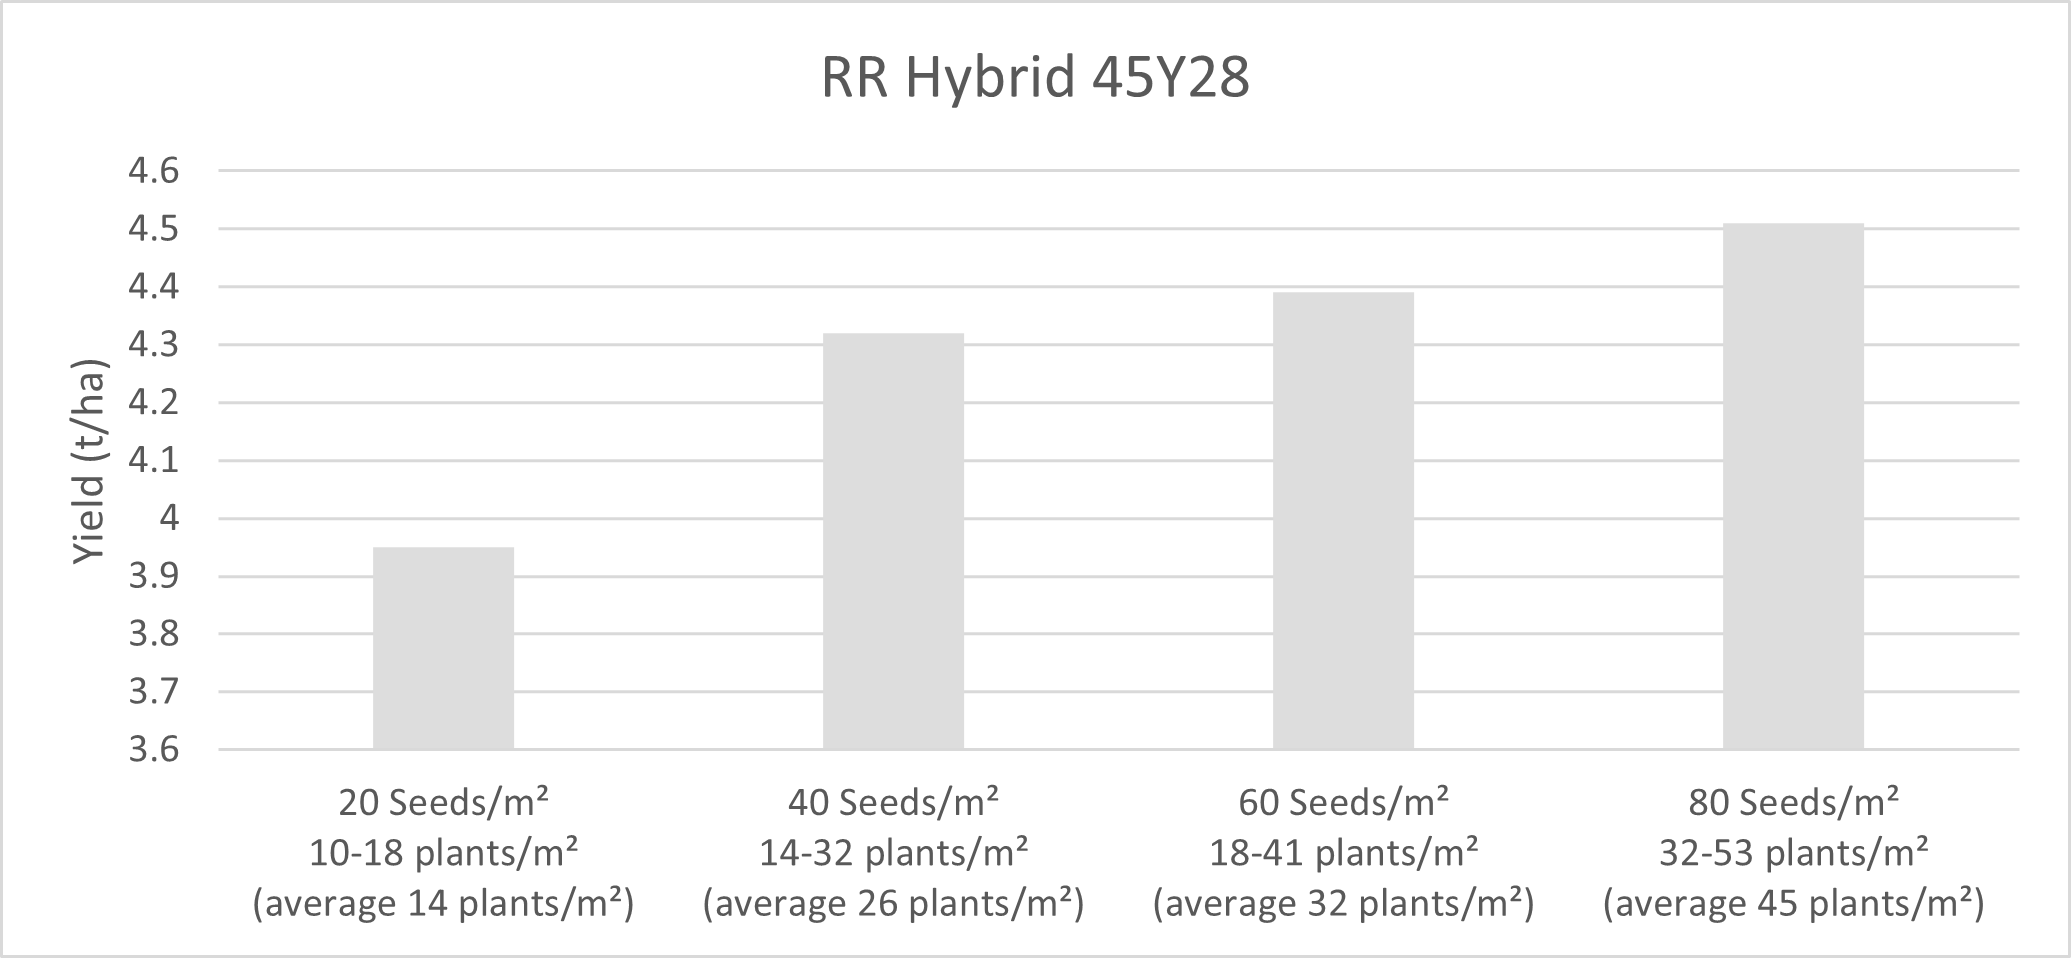
- Canola and faba beans responded well to increasing plant population, with a yield penalty of 10% observed where crops were too thin (14 plants/m2 compared to 26 plants/m2). There was little to no penalty to thick crop canopies, with canola yields peaking around 43–45 plants/m2 (the highest density tested) and faba bean yields plateauing at 25–30 plants/m2.
Background
The GRDC investment Optimising Irrigated Grains (OIG) (FAR1906-003RTX) was set up to identify gaps in our knowledge regarding the true economically attainable yield potential of winter and summer crops grown in southeastern Australian irrigated farming systems. The focus was on crops where there was less knowledge of upper end yield potential, particularly in light of newer germplasm, management advances and innovations in soil amelioration, as well as evaluating crop suitability for specific irrigated regions.
Results and discussion
The guidelines and results set out in this paper are the result of research taking place across three seasons (2020–2022), with mostly La Niña weather patterns. As a result, the cropping years of the project were subject to cooler, more mild spring temperatures, ideally geared for the project team to explore the upper range of yield potential for the crops tested. Although spring temperatures were mild, rainfall patterns across the three seasons were very different, with as much rainfall in October 2022 as what fell in the whole growing season of 2020 at the Finley site. Kerang also experienced a growing season rainfall (GSR) of decile 2, 6 and 10 over the three years of the project. In many ways, the weather patterns in 2022 did not allow the evaluation of irrigated crops, since after initial early spring applications, no further irrigation was required.
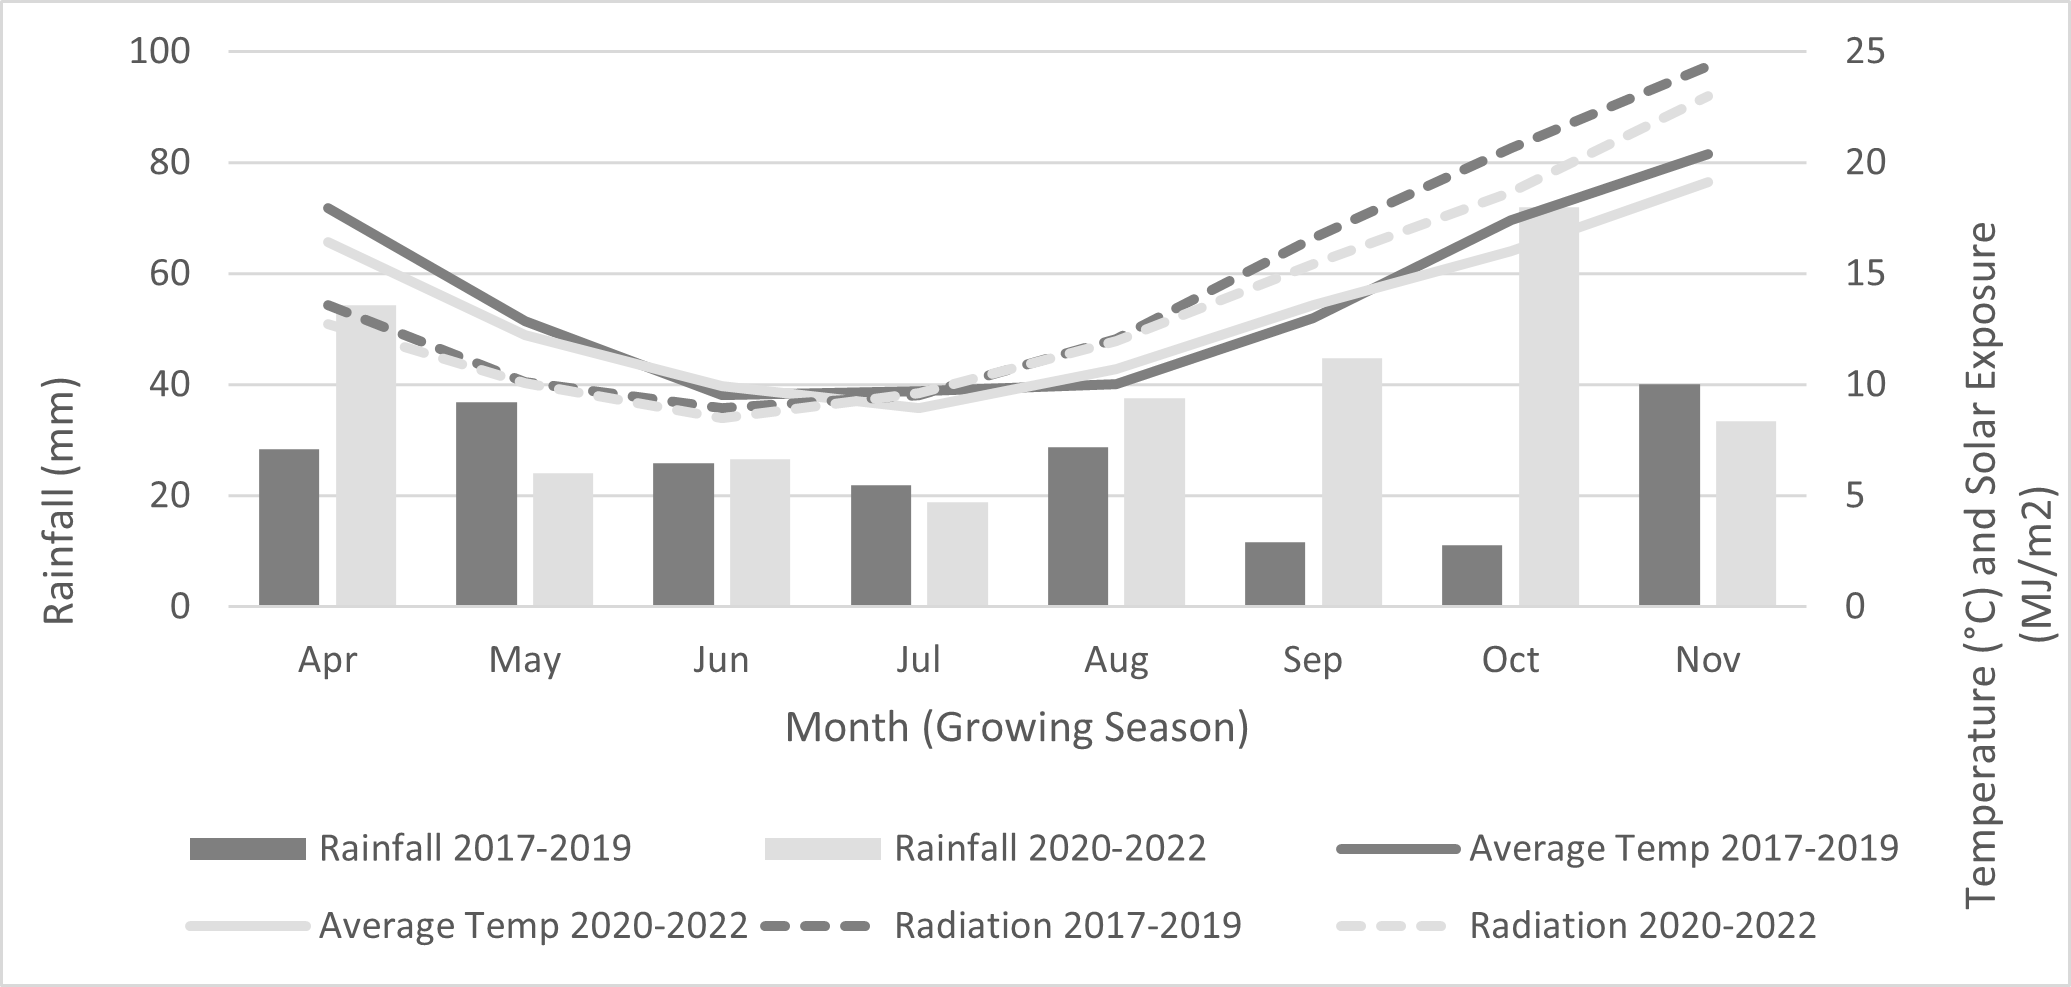
It is important that we recognise these guidelines have been based on three relatively mild seasons compared to the three years previous (2017–2019), when weather patterns were vastly different. With growing conditions ideally suited to generate higher yields in 2020 and 2021, it was an ideal opportunity for the project team to evaluate the upper end of yield potential and the inputs that support those yields. However, it comes with caveats when compared to seasons with higher spring temperatures and higher water prices. The differences in temperature, solar radiation and rainfall over these two three-year periods (2017–2019 versus 2020–2022) are contrasted in the figure below for our principal research sites at Finley and Kerang (Figure 1).

Figure 1. Contrasts of rainfall (need for irrigation), temperatures, solar exposure (radiation) average across 3 years 2017–2019 vs 2020–2022, Kerang, Vic.
Over the three years of the project, growing season rainfall (GSR) at Kerang averaged 278mm, contrasted with the previous three years where GSR averaged 165mm. Rainfall was much lower in the spring in 2017–2019 and, subsequently, the need for irrigation was higher. Solar radiation in September/October, the critical period for setting potential grain/seed number and seed set, was lower in 2020–2022 than 2017–2019, however maximum temperatures were also lower.
Over the three years of the project, growing season rainfall at Finley averaged 306mm, contrasted with the previous three years where GSR averaged 130mm – less than half. Of note is that rainfall was much lower in the spring in 2017–2019 and, subsequently, the need for irrigation was higher. Solar radiation in September/October, the critical period for setting potential grain/seed number and seed set, was lower in 2020–2022 than 2017–2019, however maximum temperatures were also lower. The ratio between average daily temperature and solar radiation was the same for both periods, thus yield potential, as determined by photothermal quotient (PTQ), was similar (assuming irrigation soil moisture was not limited.
Yield potential of irrigated crops
There is a common misconception that yield potential under irrigation will always be higher than yield potential under dryland cropping. This misconception is driven by the idea that water is the only physiological constraint limiting yield. This is not the case, as it ignores two fundamental considerations that are extremely important in estimating irrigated yield potential. These two factors are temperature and solar radiation which, when combined, can estimate yield potential in both dryland and irrigated crops. This relationship is referred to as the photothermal quotient (PTQ = radiation/temperature) or, as it is sometimes referred to, the Cool Sunny Index. Put simply, this relationship shows that cooler temperatures and sunnier conditions (daylength and cloud free skies) during grain/seed number formation (referred to as the critical period) leads to greater growth (photosynthesis), and as a result, more potential grain sites and thus, higher yield potential. A higher PTQ can result from both higher radiation and lower temperatures. For example, in 2021, many regions experienced higher solar radiation than that experienced in the same period in 2022, leading to higher yield potential in 2021 than in 2022. Note that use of PTQ to estimate yield potential assumes that there are no other stresses influencing yield potential, such as soil water stress, frost, nutritional or other stress (pests and diseases) that would constrain growth given the specific conditions of light and temperature.
Adding irrigation water does not free us from the constraint of heat and reduced solar radiation.
So, what did PTQ tell us about the yield potential of irrigated cereal crops grown in 2020, 2021 and 2022? The relationship has been most studied on cereal crops, therefore the following estimation of potential yields looks at wheat (Table 1), although more research is now taking place on additional crops, such as canola and pulses, to further define critical periods.
Table 1: Estimated yield potential of wheat at the Irrigated Research Centres over the three project years. (*Note potential yields assume no other stress factors).
Location | Estimated optimum flowering date | PTQ during critical period (MJ/m2/d/oC>0) | Potential yield based on PTQ (t/ha)* | ||||
|---|---|---|---|---|---|---|---|
2020 | 2021 | 2022 | 2020 | 2021 | 2022 | ||
Finley, NSW | 18-Oct | 1.23 | 1.33 | 1.16 | 11.1 | 11.9 | 10.4 |
Kerang, VIC | 13-Oct | 1.13 | 1.28 | 1.16 | 10.1 | 11.5 | 10.4 |
Frances, SA | 27-Oct | 1.32 | 1.51 | 1.28 | 11.8 | 13.5 | 11.4 |
Hagley, TAS | 9-Nov | 1.46 | 1.44 | 1.23 | 13.1 | 12.9 | 11.1 |
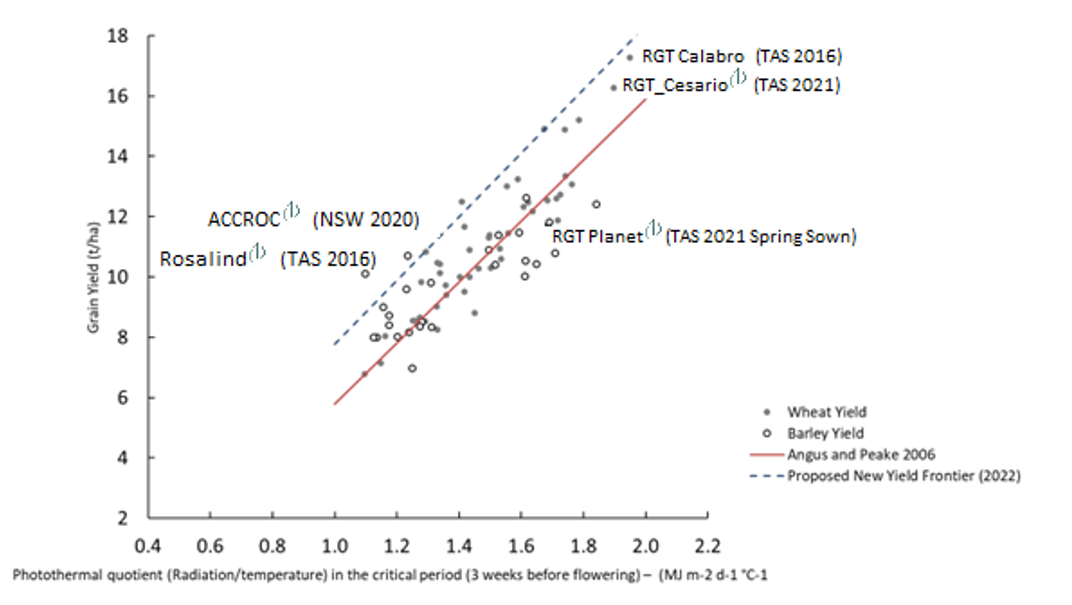
In recent work conducted by FAR Australia and CSIRO, the GRDC’s Hyper Yielding Crops project has allowed us to redefine the upper limit of yield potential associated with different values of PTQ (Figure 2). However, it should be emphasised that, in comparison to the previous PTQ relationship with yield potential (Angus and Peake 2009), the new relationship has been primarily based on winter feed wheat germplasm of European origin, compared to spring milling wheat germplasm in 2009 which examined irrigated wheat in northern farming systems.

Figure 2. Relationship between photothermal quotient and grain yield potential in wheat and barley based on recent findings from the Hyper Yielding Crops project (2022)
Highest irrigated yields achieved in the research project 2020 – 2022
In the four tables below (Table 1), the project team present the highest yields and their associated gross margins as a way of looking at the most profitable crops grown over the period of the project. So that all crops are comparable, the prices for the commodities have been based on 2023 grain values.
Table 1. Highest yields (and associated gross margins) achieved in the project’s crops from 2020 – 2022 research using 2023 commodity prices. (Based on results from the Murray and Murumbudgee research sites at Kerang and Finley).
Highest Project Yields – Finley, NSW (machine harvested). Grain maize, Peechelba, Victoria.
Crop | Highest Yield (t/ha) | Year achieved | Input costs | Gross Margin $/ha* | Irrigation applied (Mega litres MI) | Irrigation at $200/Ml (value $/ha) |
|---|---|---|---|---|---|---|
i) Summer Crop | ||||||
Grain Maize | 19.36 | 2019-20 | 2099 | 5645 | 6.1 | 1220 |
ii) Winter Crop | ||||||
Canola | 5.20 | 2021 | 930 | 2710 | 0.83 | 106 |
Durum | 8.77 | 2020 | 1059 | 2449 | 2.1 | 420 |
Faba beans | 7.88 | 2021 | 695 | 2220 | 0.9 | 180 |
Chickpeas | 3.66 | 2020 | 555 | 1641 | 2.1 | 180 |
Barley | 10.10 | 2021 | 939 | 2394 | 2.24 | 448 |
Highest Project Yields – Kerang, Victoria
Crop | Highest Yield (t/ha) | Year achieved | Input costs | Gross Margin $/ha | Irrigation applied (Ml) | Irrigation at $200/Ml (value $/ha) |
|---|---|---|---|---|---|---|
i) Summer Crop | ||||||
Grain Maize | 19.40** | 2019-20 | 1348 | 6411 | 9.8 | 1960 |
ii) Winter Crop | ||||||
Canola | 4.49 | 2021 | 930 | 2213 | 3.9 | 780 |
Durum | 10.55 | 2020 | 1059 | 3161 | 4.3 | 860 |
Faba beans | 7.88 | 2020 | 695 | 2220 | 4.2 | 840 |
Chickpeas | 4.88 | 2020 | 555 | 2373 | 2.1 | 420 |
Barley | 8.27 | 2021 | 939 | 1790 | 3.9 | 780 |
* Gross margin does not include cost of the water as this is seasonally dependent
**This yield was not machine harvested but was a hand harvested crop.
General agronomy principles for irrigated crops
Clearly, the level of organic carbon in the soil will vary and contribute different amounts of soil N supply through the course of a season. However, the key finding from the OIG project has been our inability to generate significant yield responses up to the levels of fertiliser being applied on-farm (250–500kg N/ha). The following table shows the grain yield response for maize to applied nitrogen at Kerang (Grey clay) in Victoria (Table 2). A similar result was observed at Peechelba (Red loam over clay).
Table 2: Grain yield (t/ha @ 14% moisture), dry matter yield (t/ha), test weight (kg/hL) and harvest index (HI), Kerang, Vic, 20 May 2022 cv Pioneer hybrid 1756.
Treatment | Grain Yield, Dry Matter Yield and Quality | ||||||||||
|---|---|---|---|---|---|---|---|---|---|---|---|
Yield | DM | Test Wt | HI | ||||||||
Pre-drill NNN/ha N/ha) | Post-drill | Total kg N/ha | t/ha | t/ha | kg/hL | ||||||
1. | 0 | 0 | Nil (Control) | 10.34 | d | 22.64 | d | 81.7 | 0.40 | ||
a2. | 40 | 40 | 80 | 11.98 | c | 29.33 | c | 82.7 | 0.36 | ||
3. | 80 | 80 | 160 | 15.05 | bc | 33.94 | bc | 83.0 | 0.39 | ||
4. | 120 | 120 | 240 | 17.13 | a | 31.42 | ab | 82.0 | 0.47 | ||
5. | 160 | 160 | 320 | 16.66 | ab | 32.53 | ab | 80.0 | 0.44 | ||
6. | 200 | 200 | 400 | 17.76 | a | 35.56 | ab | 80.7 | 0.43 | ||
7. | 200 | 200 | 480 | 17.04 | a | 33.66 | a | 81.1 | 0.44 | ||
8. | 280 | 280 | 560 | 17.03 | a | 34.28 | a | 80.9 | 0.43 | ||
Lsd Yield (p=0.05) | 1.659 | P Val | <0.001 | cv% | 7.3 | ||||||
Lsd DM (p=0.05) | 3.398 | P Val | <0.001 | cv% | 5.8 | ||||||
Lsd Test Wt (p=0.05) | ns | P Val | 0.094 | cv% | 1.8 | ||||||
Lsd HI (p=0.05) | ns | P Val | 0.059 | cv% | 11.0 | ||||||
Figures followed by different letters are statistically different (p=0.05)Available Soil N prior to sowing and watering up was 34kg N/ha (0–60cm). The nil control N offtake at harvest was 241kg N/ha, suggesting in-crop mineralisation resulted in 207kg N/ha of the N taken up.Previous crop: grass dominant pasture (3 years).
Growing canola under irrigation with the aim of producing 5t/ha has illustrated significant penalties in yields and margins from growing crops that are too thin (Figure 3). With higher yield potential under irrigation, small differences in plant population have a 'magnifying’ effect in terms of yield. With plant populations below the optimum, there are significant yield penalties, whilst in the same varieties, populations that might be regarded as above the optimum have been either equal or higher yielding than the optimum. As a result, dropping to populations between 10–20 plants/m2 can produce a significant drop in productivity compared to plant populations that are above 40 plants/m2, when canola has been grown under irrigation.

Figure 3. Influence of plant population on seed yield (t/ha) using the RR hybrid 45Y28 in six irrigated trials conducted at Finley and Kerang, 2020 and 2021.
Acknowledgements
The research undertaken as part of this project is made possible by the significant contributions of growers through both trial cooperation and the support of the GRDC, the authors would like to thank them for their continued support. FAR Australia would also like to acknowledge the support of Southern Growers from whom we leased land and water on their Finley Irrigation Complex and Irrigation Farmers Network (IFN, Formerly ICC).
References
Peake AS, Angus JF (2009) Increasing yield of irrigated wheat in Queensland and northern NSW. Goondiwindi Grains Research Update, March 3-4, 2009. Link: http://www.grdc.com.au/Research-and-Development/GRDC-Update-Papers/2009/11/Increasing-Yield-of-Irrigated-Wheat-in-Queensland-and-Northern-NSW
Contact details
Ben Morris
Shop 12, 95–103 Melbourne St, Mulwala NSW 2647
0400 318 334
ben.morris@faraustralia.com.au
Nick Poole
Shed 2/63 Holder Rd, Bannockburn VIC 3331
03 5265 1290
nick.poole@faraustralia.com.au
GRDC Project Code: FAR1906-003RTX,
