Are rising input costs the biggest threat to farm profitability
Are rising input costs the biggest threat to farm profitability
Author: Ben Hogan (ORM Pty Ltd) | Date: 20 Feb 2024
Take home messages
- An analysis of 20 grain growing farm businesses over 10 years showed that input prices, while volatile, may not be the biggest threat to farm businesses.
- For the sample, the average total spend on inputs more than doubled over the 10 years, from $401k to $959k, or 139%. As a per hectare cost, the increase was 109%, and as a percentage of gross crop income, the increase spend on inputs over the period was only 3%, from 31% to 34% of gross crop income. The range of spend on inputs over the ten years was between 26% and 35% of gross crop income.
- If we increase our view from single year to a three-year rolling average, it smooths the volatility in input spend, with the range of spend on inputs as a percentage of gross crop income reducing from between 28% and 34% of gross crop income.
- Spend on inputs are correlated with both crop yields and commodity prices. With a below average yielding year, input costs may vary less as a percentage of gross income than more embedded business costs.
- Increases in farm debt levels, along with increases in interest rates, shows only a modest impact on farm profitability for the sample, but for individual businesses within the sample, it will be the largest threat to farm profitability in FY24 and beyond.
- Similarly, recent increased investment in machinery may have embedded higher machinery capital costs, increasing from 13% of gross income in 2020 to an estimated 20+% in the case of an average income year.
Background
ORM have analysed the effect of input prices on a set of 20 Victorian cropping businesses in the low to medium rainfall zones over a period of 10 continuous years. Businesses were majority broadacre cropping, with less than 20% of their income coming from livestock. For this analysis contracting and other income has been excluded. The analysis is based on the financial information from the financial statements provided by each farming business, while production data has been volunteered and vetted against financials.
Given financial statements are produced up to 18 months later than the corresponding crop production year, the analysis has been done using a complete set of financial records for each business up until FY22, with further data incorporated into the estimates for FY23 and forecasts for FY24.
It is intended as a high-level analysis on the impact of the major cost groups. As such, there is no distinction between chemical groups or types of fertilisers.
Input costs – total spend
Over the period 2013 to 2022, the average total spend on inputs for businesses in the sample increased by 139%, from $401k to $959k. If we consider the increase in cropped area, as a per hectare cost, the increase was 109% (Table 1). Given the volatility on input spend from year to year, if we use a rolling three-year average, the spend per hectare on inputs only increases by 56% over the period, from $168/ha to $262/ha.
Table 1: Average input spend by financial year, expressed in total dollar, per hectare and three-year rolling average per hectare terms.
Financial year | 2013 | 2014 | 2015 | 2016 | 2017 | 2018 | 2019 | 2020 | 2021 | 2022 |
|---|---|---|---|---|---|---|---|---|---|---|
Input spend ($ total) | 401 359 | 497 155 | 312 486 | 345 172 | 484 958 | 540 178 | 510 625 | 675 632 | 636 784 | 959 339 |
Percentage change from 2013 | 24% | -22% | -14% | 21% | 35% | 27% | 68% | 59% | 139% | |
Area cropped (ha) | 2,517 | 2,561 | 2,612 | 2,565 | 2,767 | 2,772 | 2,677 | 2,896 | 2,848 | 2,931 |
Input spend ($/ha) | 159 | 194 | 120 | 135 | 175 | 195 | 191 | 233 | 224 | 327 |
Percentage change from 2013 | 22% | -25% | -16% | 10% | 22% | 20% | 46% | 40% | 105% | |
Input spend ($/ha) | 168 | 171 | 157 | 149 | 144 | 169 | 187 | 207 | 216 | 262 |
Percentage change from 2013 | 1% | -6% | -11% | -15% | 0% | 11% | 23% | 29% | 56% |
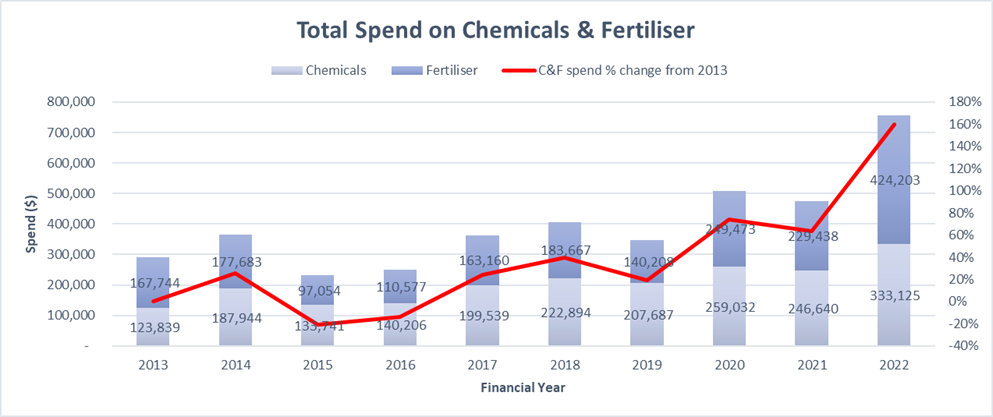
The two main components of input spend are chemicals and fertiliser. The total spend in 2022 was an increase of 169% for chemicals and 153% for fertiliser, from the 2013 spend (Figure 1). The spend per hectare increases for the same period were 131% for chemicals and 117% for fertiliser.

Figure 1. Average total spend on chemicals and fertiliser along with percentage change in chemical and fertiliser spend (right hand axis) by financial year.
Looking at urea prices, the outright urea price is up approximately 181% from FY13 to FY22 on a spot price basis, or 52% on a three-year rolling average price basis (Table 2). This is above the corresponding 117% jump in fertiliser spend but in-line with the 61% increase in three-year rolling average fertiliser spend of the group. DAP saw a spot price increase of 148% or a three-year rolling average price increase of 38% over the period.
Table 2: DAP and Urea price changes over ten years expressed in dollar and percentage terms, and rolling three-year average
DAP ($/t) | DAP 3yr rolling | Urea ($/t) | Urea 3yr rolling | |
|---|---|---|---|---|
1 June 2013 | $450 | $490 | $349 | $375 |
30 June 2022 | $1,115 | $677 | $981 | $571 |
$ change | $665 | $187 | $632 | $197 |
% change | 148% | 38% | 181% | 52% |
Urea and DAP price source: Indexmundi (Black Sea), bulk, spot, f.o.b. Black Sea in AUD/mt
Input costs in relation to gross income
To assess the impact of changes of rising input prices on farm business profitability, we have analysed the change of input spend as a percentage of gross income. Gross income is influenced by commodity price and volume (yield multiplied by area).
Commodity prices
Commodity prices have generally trended higher over the period. While not accounting for differences in volumes of each crop type, we note that for the five most voluminous commodities in the sample, the average increase across the sample period was 35% (or 31% if we use the rolling three-year averages for each commodity) (Table 3).
Table 3: Commodity price change over ten years expressed in dollar and percentage terms, and rolling three-year average
Wheat (APW) | Barley (BAR 1) | Canola | Lentils | Oaten hay | ||||||
|---|---|---|---|---|---|---|---|---|---|---|
spot price | 3yr av. | spot price | 3yr av. | spot price | 3yr av. | spot price | 3yr av. | spot price | 3yr av. | |
June 2013 | $296 | $260 | $255 | $215 | $616 | $534 | $674 | $573 | $295 | $183 |
June 2022 | $495 | $415 | $435 | $295 | $850 | $805 | $925 | $783 | $190 | $170 |
$ change | $199 | $101 | $180 | $80 | $234 | $271 | $251 | $210 | -$105 | -$13 |
% change | 67% | 39% | 71% | 37% | 38% | 51% | 37% | 37% | -36% | -7% |
Average commodity price increase | ||||||||||
Spot price | 35% | |||||||||
3yr rolling average | 31% | |||||||||
Yield
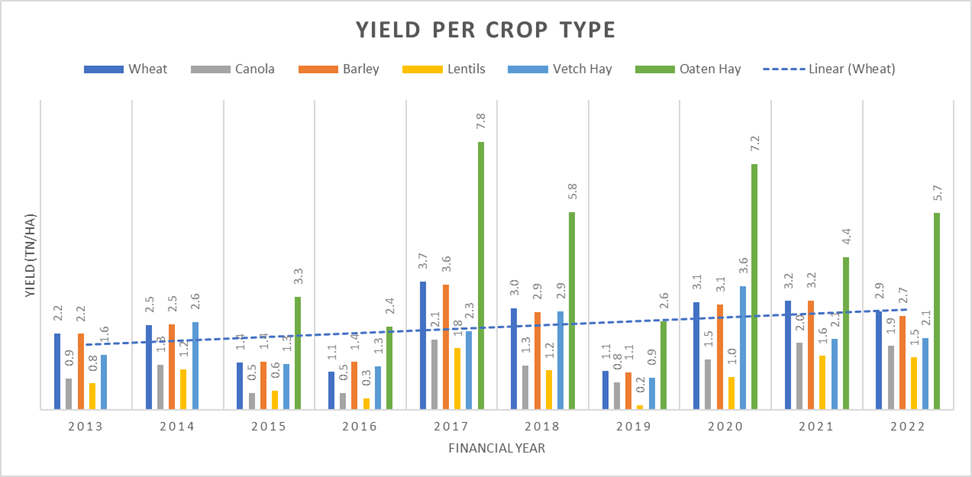
While not accounting for area differences, we can see that average yields of the group were higher from FY17 onwards, with a linear wheat yield trend line marked below (Figure 2).

Figure 2. Average crop yield change over a ten-year period
Gross income
Average gross income of the group increased by $1.515 million or 118% over the period (Table 4). Once we account for the increase in area, gross income/ha increased 87% over the period. If we look at a rolling three-year average, gross income/ha increased 61% over the period.
Table 4: Total gross income and gross income per hectare change over ten years expressed in dollar and percentage terms, and rolling three-year average
Financial year | 2013 | 2014 | 2015 | 2016 | 2017 | 2018 | 2019 | 2020 | 2021 | 2022 |
|---|---|---|---|---|---|---|---|---|---|---|
gross income ($ total) | 1 283 301 | 1 419 119 | 999 224 | 992 012 | 1 566 243 | 1 758 174 | 1 652 544 | 2 590 607 | 2 300 759 | 2 798 404 |
% change from 2013 | 0% | 11% | -22% | -23% | 22% | 37% | 29% | 102% | 79% | 118% |
Gross income ($/ha) | 510 | 554 | 383 | 387 | 566 | 634 | 617 | 895 | 808 | 955 |
% change from 2013 | 0% | 9% | -25% | -24% | 11% | 24% | 21% | 75% | 58% | 87% |
Gross income ($/ha) | 549 | 541 | 482 | 441 | 445 | 529 | 606 | 715 | 773 | 886 |
% change from 2013 | 0% | -2% | -12% | -20% | -19% | -4% | 10% | 30% | 41% | 61% |
Input spend in relation to gross income
Input spend of 34% of gross income in FY22 was 3% higher than in FY13 (Table 5). It was, however, lower than the 2014 and 2016 levels of 35%. If we apply a three-year rolling average, input spend between 2020 and 2022 was at its lowest levels for the period.
Table 5: Input expenditure change over ten years expressed as a percentage of gross income, and rolling three-year average
Financial year | 2013 | 2014 | 2015 | 2016 | 2017 | 2018 | 2019 | 2020 | 2021 | 2022 | Change |
|---|---|---|---|---|---|---|---|---|---|---|---|
Inputs as a % of gross income | 31% | 35% | 31% | 35% | 31% | 31% | 31% | 26% | 28% | 34% | 3% |
Inputs as a % of gross income | 31% | 32% | 33% | 34% | 32% | 32% | 31% | 29% | 28% | 30% | -1% |
Widening the view to look at all major cost categories
We split the major cost groups into inputs, machinery operating (that includes repairs and maintenance, fuel and oil), labour, overheads, land lease payments, machinery capital costs and finance costs (interest and fees). Machinery capital cost is often measured by depreciation. Since depreciation is a non-cash expense and can vary greatly with programs like ‘Instant Asset Write Off’, in this analysis, we have updated the actual value of the pool of machinery each year and calculated the capital cost of machinery as the total value of machinery multiplied by 12%.
All costs expressed as a percentage of gross income
While inputs rose 3%, all other major costs areas as a percentage of gross income have been relatively steady across the period, while assumed earnings before tax decreased from -3% to -5% (Table 6).
Table 6: Expenditure change over ten years expressed as a number and percentage of gross income, and total over the period
Cost to income ratios | |||||||||||
|---|---|---|---|---|---|---|---|---|---|---|---|
% of gross income | 2013 | 2014 | 2015 | 2016 | 2017 | 2018 | 2019 | 2020 | 2021 | 2022 | Change |
Gross income ($/ha) | 510 | 554 | 383 | 387 | 566 | 634 | 617 | 895 | 808 | 955 | 445 |
Inputs | 31% | 35% | 31% | 35% | 31% | 31% | 31% | 26% | 28% | 34% | 3% |
Machinery operating | 19% | 20% | 22% | 21% | 21% | 20% | 16% | 17% | 17% | 22% | 3% |
Labour | 14% | 13% | 18% | 19% | 13% | 13% | 15% | 11% | 13% | 14% | 1% |
Overheads | 9% | 8% | 12% | 14% | 9% | 9% | 10% | 7% | 9% | 8% | 0% |
Land lease | 6% | 5% | 7% | 7% | 5% | 5% | 6% | 3% | 5% | 5% | -1% |
Agri EBITDA | 21% | 18% | 11% | 4% | 21% | 22% | 22% | 36% | 28% | 15% | -6% |
Assumed machinery capital | 15% | 13% | 20% | 20% | 15% | 15% | 18% | 13% | 17% | 17% | 2% |
Interest and fees paid | 9% | 8% | 12% | 12% | 8% | 8% | 9% | 5% | 5% | 4% | -5% |
Assumed earnings before tax | -3% | -3% | -21% | -27% | -3% | -1% | -4% | 18% | 7% | -5% | -3% |
FY23 estimate
Based on the returned financials thus far from ~30% of the sample, we applied the same increase and decrease ratios across the sample to attain an estimate for FY23. Input spend increases another 34% year-on-year, however it is more than offset by gross income increases and reduces to 30% of gross income (Table 7). Outright spend increases in all cost categories except land lease (land lease cost reduces due to a reduction in lease area), and all costs reduce as a percentage of income except finance interest costs.
Table 7: FY22 Actual and FY23 Estimate income and costs, percentage of income and dollar per hectare percentage change.
Single year | Actual | Estimate | 2023 Estimate % of gross income | FY22 to FY23 $/ha % change |
|---|---|---|---|---|
$/ha | FY2022 | FY2023 | ||
Gross income | 955 | 1478 | 55% | |
Inputs | 327 | 438 | 30% | 34% |
Machinery operating | 213 | 280 | 19% | 32% |
Labour | 137 | 152 | 10% | 11% |
Overheads | 81 | 93 | 6% | 15% |
Land lease | 50 | 49 | 3% | -1% |
Agri EBITDA | 147 | 466 | 32% | 216% |
Assumed machinery capital | 163 | 166 | 11% | 2% |
Interest and fees paid | 36 | 88 | 6% | 144% |
Assumed earnings before tax | -51 | 213 | 14% |
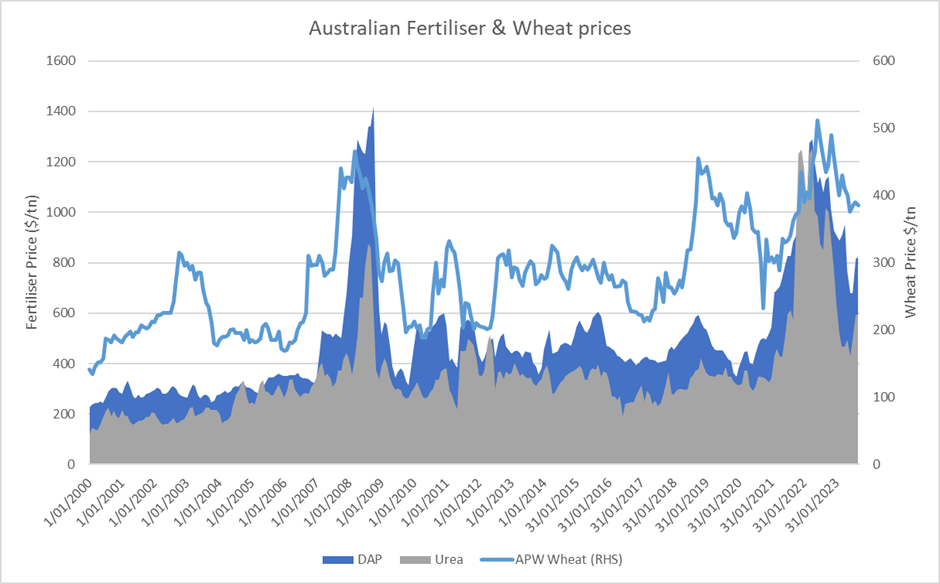
Looking at the sample as a guide to potential spend on inputs, we see that, even with the extreme input price volatility, historically the spend on inputs stays within a range of between 26% and 35% of gross crop income. Spend on inputs are correlated with both crop yields and commodity prices. Below is a chart of Australian fertiliser and wheat prices, highlighting the trend (Figure 3).

Figure 3. DAP, Urea and APW Wheat price change over a twenty-four-year period expressed as dollars per tonne (AUD) Urea and DAP price source: Indexmundi (Black Sea), bulk, spot, f.o.b. Black Sea in AUD/mt Wheat price source: Weekly Times
With the high fixed cost structure inbuilt in farm businesses through machinery capital expense and increased debt, it is likely input costs will vary less as a percentage of gross income than more embedded business costs. For example, if the sample set were to return to an FY13–FY22 average gross income, machinery capital expense would likely jump 15% of gross income, well beyond the range of 9% seen in input prices (Table 8). Interest costs would also increase 8% to 14% of gross income, noting that the sample is not particularly exposed to interest rates, with an average equity level of 88% of total assets.
Table 8: Assumed machinery capital and interest expenditure expressed as a dollar per hectare figure and a percentage of gross income for FY2023 and FY13-FY22 and the total percentage change
Scenario analysis | 2023 Estimate | FY13–FY22 Average | ||
|---|---|---|---|---|
Gross income | $1478/ha | $631/ha | ||
2023 Estimate $/ha | % of gross income | % of gross income | % Change | |
Assumed machinery Capital | 166 | 11% | 26% | 15% |
Interest and fees paid | 88 | 6% | 14% | 8% |
Recent profitable years and strong equity growth will have added substantial financial buffer to most farming businesses, but based on the FY23 estimate, embedded costs such as machinery capital expenses and finance costs may be a bigger threat to farm profitability than inputs.
Contact details
Ben Hogan
ORM Pty Ltd
ben@orm.com.au
