Investigating the impact of ENSO and IOD on the South West Land Division
Investigating the impact of ENSO and IOD on the South West Land Division
Author: Meredith Guthrie, Tim Scanlon, David Bowran | Date: 24 May 2024
Key messages
1. Since 2000, El Niño Southern Oscillation (ENSO): El Niño events, have reduced May-June rainfall for some western parts of the South West Land Division (SWLD).
2. Since 2000, negative IOD events are associated with wetter May-June rainfall, while positive IOD, had drier rainfall, fewer nights below 2°C, and more days above 30°C in August-September.
3. Since 1960, when ENSO and IOD events combine, La Niña/negative IOD events have higher May-June rainfall. El Niño/positive IOD combined events influence August-September temperature with fewer nights below 2°C, and more widespread occurrence of days above 30°C in the SWLD.
4. Growers can check ENSO and IOD event forecasts prior to the season to understand the predicted season types to help planning alongside decision support tools such as stored soil water and break of season maps.
Aims
Understanding of the major climate drivers of the South West Land Division can be useful to help prepare for coming seasons. Dynamical climate models can forecast ENSO and IOD events up to 6 months in advance. This paper aims to present understanding of the impacts these forecasts will have on potential May-June (sowing and crop establishment) rainfall and August-September temperature (flowering and grain fill).
Introduction
The climate of the SWLD is influenced by various global and local climate drivers, including the El Niño Southern Oscillation (ENSO) and Indian Ocean Dipole (IOD). ENSO is a global scale ocean-atmosphere phenomenon involving the Southern Oscillation Index (SOI), the mean sea level pressure difference between Tahiti and Darwin, and sea surface temperatures in the Pacific Ocean (known as the Niño 3.4 region). Three basic states exist: El Niño, La Niña, and Neutral. For eastern Australia, El Niño typically reduces winter rainfall and increases temperatures, while La Niña is associated with increased winter rainfall. Their influence on the SWLD climate varies.
The IOD is defined by the difference in sea surface temperature (SST) between two poles – a western pole in the Arabian Sea (western Indian Ocean) and an eastern pole in the eastern Indian Ocean, south of Indonesia. A positive IOD (+ IOD) occurs when the index is higher than normal, with cooler SST north of Australia, and a negative IOD (- IOD) when the index is lower than normal, with warmer than normal SST north of Australia. IOD events usually start around May or June, peak between August and October and rapidly decay when the monsoon arrives in the southern hemisphere around the end of spring.
All of these climate drivers can impact May-June rainfall, influencing the autumn break of the agricultural growing season, and August-September temperatures, with the potential for heat stress or frost damage to flowering cereals. When ENSO and IOD events coincide, their impact is stronger and more widespread across Australia (Bureau of Meteorology, a). Understanding how these climate drivers have affected rainfall and temperature allows growers to be better prepared for potential challenges or successes in the coming season.
Method
May-June rainfall and August–September maximum and minimum temperatures were obtained for 332 Bureau of Meteorology and 168 DPIRD weather stations from the DPIRD science API (Application Programming Interface) for 1950-2023. The years were categorised into either ENSO or IOD events based on the Bureau of Meteorology’s definitions (Bureau of Meteorology b, c). Total May-June rainfall, rainfall anomaly, the number of days above 30°C (temperatures above this can cause damage to developing cereals) and nights below 2°C (potential frost events) in August-September were averaged over two time frames: 1950-2023 (1960 and onwards for IOD, when the Bureau first classified IOD events), and 2000-2023, to correspond to the changing climate of the South West Land Division. The data were mapped using R (for methodology, see Guthrie and Hepworth, 2021).
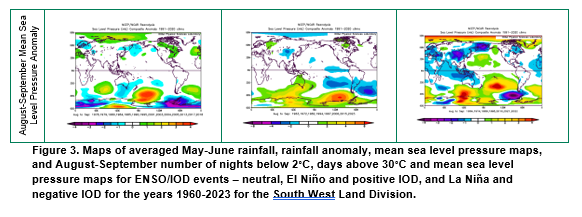
Combination maps of neutral ENSO/ IOD, El Niño/+IOD, and La Niña/-IOD for the years 1960-2023 were created. Maps for 2000-2023 were not assessed as the number of combination events was not statistically valid. Global mean sea level pressure maps, for both May-June and August-September for the combination of ENSO and IOD, were generated using the National Oceanic and Atmospheric Administration Monthly Seasonal Climate Composites web page (National Oceanic and Atmospheric Administration).
Results
ENSO states
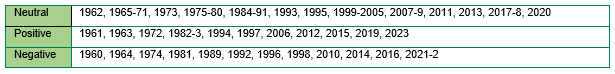
Since 1950, there have been 32 neutral ENSO years, 19 El Niño and 23 La Niña years (Table 1). El Nino’s normally only last one year (except in 1986-7 and 1993-4), whilst La Niña’s can occur concurrently (returning to neutral and then back to La Niña) for up to 3 years.
Table 1. El Niño Southern Oscillation states – neutral, El Niño and La Niña for the years 1950 to 2023 as defined by the Bureau of Meteorology.
There is minimal difference in May – June rainfall for all three ENSO states for the years 1950-2023 in the SWLD. Since 2000, neutral ENSO May-June rainfall anomaly averaged over the SWLD 502 locations is 12 mm (standard error (se) 0.4 mm), El Niño is -16 mm (se 0.6 mm) and La Niña -6 mm (se 0.4 mm). Meaning that El Niño events have drier rainfall across the SLWD. There is little difference in the number of days above 30°C or nights below 2°C for the different ENSO states, meaning frost is always a possibility regardless of the ENSO state (results not shown).
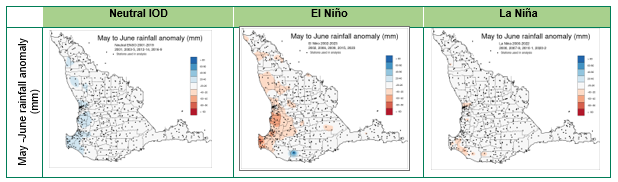
Figure 1. Maps of averaged May-June rainfall anomaly ENSO events – neutral, El Niño, and La Niña for the years 2000-2023 for the South West Land Division.
IOD states
Since 1960, there have been 12 positive and 13 negative IOD events (and hence 39 neutral IOD events) (Table 2). There has been one concurrent positive (1982-3) and negative (2021-2) IOD.
Table 2. Indian Ocean Dipole states – neutral, positive, and negative for years 1960 to 2023 as defined by the Bureau of Meteorology.
Whilst there has been a difference in IOD states since 1960, the greatest difference has occurred since 2000. Averaged across the whole SWLD, neutral IOD May-June rainfall anomaly is 1.3 mm (se 0.4 mm), positive IOD -14 mm (se 0.8 mm), and negative IOD event 10 mm (se 0.6 mm). Meaning that positive IOD events are drier and negative IOD events wetter over the whole SWLD. For some locations, positive IOD events resulted in fewer nights below 2°C (less purple in the maps) and more days above 30°C in August to September (Figure 2).
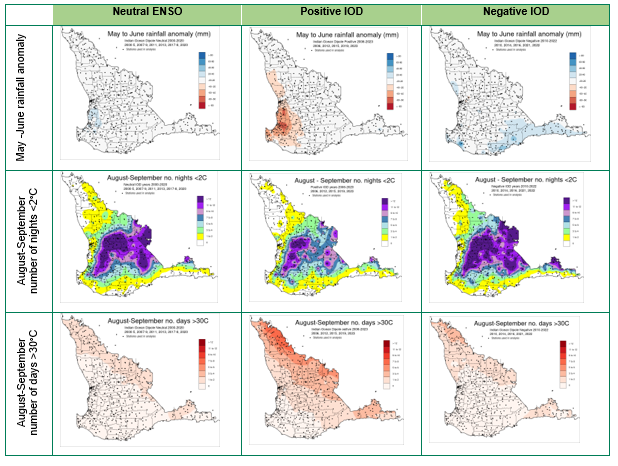
Figure 2. Maps of averaged May-June rainfall anomaly and August-September number of nights below 2°C and days above 30°C for IOD events – neutral, positive, and negative for the years 2000-2023 for the South West Land Division.
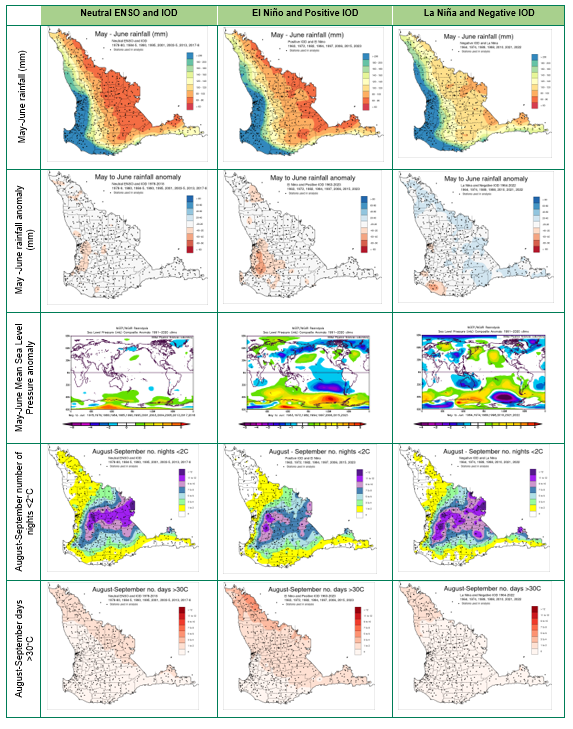
ENSO and IOD combined
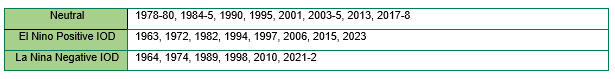
Since 1963, there have been 14 neutral ENSO coinciding with neutral IOD events, 8 El Niño/+IOD events, and 7 La Niña/- IOD events (Table 3).
Table 3. El Niño Southern Oscillation and Indian Ocean Dipole combined states – neutral ENSO/IOD, El Niño/positive IOD, and La Niña/negative IOD for years 1960 to 2023 as defined by the Bureau of Meteorology.
Averaged across the whole SWLD, neutral ENSO and IOD May-June rainfall anomaly is -12 mm (se 0.3 mm), La Niña/-IOD 10 mm (se 0.7 mm), and El Nino/+IOD event -12 mm (se 0.5 mm). Meaning that La Niña /negative IOD events are wetter over the whole SWLD, due to lower mean sea level pressure in these years (Figure 3).
In August- September, for El Niño/+IOD events, there were slightly fewer nights below 2°C, reducing frost potential, the number of days above 30°C is more widespread and higher in some locations in the SWLD, due to higher-than-normal mean sea level pressure.
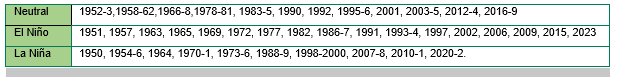
Conclusion
This analysis highlights that since 2000, the Indian Ocean Dipole has had a more significant impact on the climate of the South West Land Division in May-June and August-September than the El Niño Southern Oscillation. Generally, El Niño events are drier, but IOD events influence both May-June rainfall and August-September temperatures. This impact is amplified when ENSO and IOD events coincide. Since 1964, May-June rainfall has been higher in combined La Niña/-IOD years, for the majority of the SWLD, due to lower-than-normal mean sea level pressure. August-September temperatures are warmer in El Niño/+IOD years, due to higher-than-normal mean sea level pressure.
Past research has linked El Niño/+IODs to some of Australia’s worst droughts (Ummenhofer et al., 2009). However, it’s crucial to remember that future ENSO, IOD or combined events will not be identical to past ones, and other climate drivers can have stronger influences on SWLD climate. For example, in 2010, a decile one rainfall year, another climate driver, the Southern Annular Mode, suppressed winter cold fronts, even though as a La Niña/-IOD year, higher rainfall was expected. Dynamical models, such as those reported in DPIRD’s Seasonal Climate Outlook newsletter, can give early indications of ENSO and IOD events to aid planning for the growing season.
References
Bureau of Meteorology a, http://www.bom.gov.au/climate/about/australian-climate-influences.shtml
Bureau of Meteorology b, ENSO webpages www.bom.gov.au/climate/history/enso/
Bureau of Meteorology c, IOD webpages http://www.bom.gov.au/climate/iod/
Guthrie M and Hepworth A. 2021 Mapping weather variability in the South West Land Division GRDC Research Updates
National Oceanic and Atmospheric Administration, Monthly Seasonal Climate Composites https://psl.noaa.gov/cgi-bin/data/composites/printpage.pl map room accessed 27 November 2023
Ummenhofer, C.C. et al. (2009). What causes southeast Australia’s worst droughts? Geophysical Research Letters 36, L04706.
Contact details
Meredith Guthrie,
Department of Primary Industries and Regional Development,
Nash Street, Perth,Ph: 9368 3058,
Email: meredith.guthrie@dpird.wa.gov.au