Learnings from long term lime response research
Learnings from long term lime response research
Author: Lisa Miller, James Palmer (Southern Farming Systems), Brian Hughes (SARDI) | Date: 20 Feb 2024
Take home messages
- Soil pH profile is often stratified, so testing in 5cm increments down to at least 20cm is needed to identify acidic layers.
- In suitable soil types, incorporate lime to achieve fast and substantial pH change, but for optimum results, ensure thorough mixing of lime with soil within acidic layers.
- Lower quality limes, as reflected by relatively low neutralising value (NV) and fineness, can be prioritised for incorporation, while higher quality limes are more suited to surface liming.
- Liming changes micronutrient availability, and increased molybdenum could potentially result in copper deficiency for livestock.
Background
Liming is necessary to replace hydrogen ion build up and soil acidity resulting from product removal, and to ensure a sustainable productive farming system. SFS have been researching the effects of lime since 2014. There has been a focus on understanding crop and pasture responses and using the information to create pH response curves and an economic calculator called LimeAssist. The most recent work has investigated lime quality and how it affects lime responses from surface application or incorporation and impacts on micronutrient availability. This information helps guide grower decision making around soil acidity management and lime use.
How lime works
It is important to understand how lime works, as it influences much of the decision making around soil acidity management.
When lime is applied to moist soil, the carbonate within lime reacts quickly with hydrogen ions in the soil to produce harmless water molecules. Once the soil reaches neutral pHs, excess bicarbonate ions are created, and they can then leach into underlying soil layers. This is why it is important to maintain a topsoil pH (CaCl2) above 5.5 or aim for pH 5.8/6.0, so that bicarbonate ions can work their way into deeper acidic soil layers. This movement of bicarbonate ions is slow, approximately 2cm per year.
Most soil pH change caused by liming occurs within 12 months of application, but the soil pH peaks, typically after two years. The subsoil pH then starts to fall, as more hydrogen ions are added and further bicarbonate ions move downwards out of the topsoil.
If you incorporate the lime and mix it through the soil, then more soil particles are exposed to the lime so that more reactions occur more rapidly. But when broadcasting lime into a minimum till system, the lime changes soil pH at the surface and dissolution is slowed once the topsoil pH (CaCl2) exceeds 5.4 and stops completely when the pH reaches 6.3 (CaCl2). Hence, surface liming contributes to the slow movement of lime.
The pH of the soil profile is usually stratified, meaning it is not uniform down the soil profile. Soil pH is often highest in the top 2-3 cm and decreases with depth down to 5-15cm when is starts to increase again. This is exacerbated by liming in no till systems, where most pH change occurs in the top 5cm because there has not been enough lime applied to allow excess alkalinity to leach downwards. Also, acidification occurs in different places in the soil profile, for example, the place where the roots adsorb cations and expel hydrogen ions in exchange, and where nitrate is leached away from the root zone. Other than lime applications, alkaline plant residues are added to the surface, so the top few centimetres often have the highest pH.
Detection of soil acidity layers
The aim of soil testing is to identify acidic soil layers that might impair root growth, the uptake of nutrients and water, and yield loss. SFS started with monitoring soil acidity at depths of just 0–10cm prior to 2015 and then introduced monitoring of 0–10cm, 10–20cm and 20–30cm. A lot of acidity was detected in the subsurface at 10–20cm and SFS quickly found that this sampling depth strategy can hide stratification, because often you end up combining 5cm of good soil with 5cm of strongly acidic soil to give you an average pH that seems acceptable. The most highly acidic layer commonly found is at 5–15cm. This means that acidic layers can be hidden with soil sampling at 0–10cm and 10–20cm. Therefore, monitoring in 5cm increments down to the depth of the topsoil or about 20cm has become the standard recommendation across the southern states.
This can be done by taking cores in areas where crop growth is poor and dividing them up into segments to be sent for pH analysis in a laboratory. An indication of soil acidity also be made by applying pH indicator solution (Manutec brand) along the core and matching the colour changes to their corresponding pH (H20) using a colour chart. SFS uses an Aborline hand corer with an open face tube that allows 15cm or 20cm long soil cores to be cut up into 5cm segments, or a Dig stick.
Grid sampling
Soil acidity generally varies across the paddock and is not always reflective of different soil types and potential acidic areas. Spatial differences in soil pH can relate to elevation (because waterlogging causes nitrate leaching), high yielding areas (due to greater product removal), historic sheep camps (nitrate leaching), old tree sites (alkalinity deposit), recent windrow burning (rapid alkaline deposit), and uneven liming practices.
Grid sampling and more intensive sampling to produce pH maps is usually done at 0–10cm depth and is more useful for the detection of highly acidic areas than a bulk sample. It should be done with consideration of possible stratification, but test costs can make it prohibitive. To get around this, precision agriculture approaches (i.e. examining yield or other maps) can help identify poor performing sites in a paddock, often with low cation exchange capacity and pH buffering prone to acidification. These sites should be targeted for soil pH testing to depth in 0–5cm increments.
Generally, savings can be made by prioritising lime application where pH is lowest in the paddock. Sometimes, if the soil is unexpectedly strongly acid, then the amount of lime needed may be more than anticipated compared to a blanket application, however the overall long term economic return will be greater.
Agriculture Victoria (GRDC project DAV00152) research found it was generally economic to grid sample and use variable rate liming in variable paddocks and the rotation included an acid sensitive pulse. When areas of low pH were appropriately identified and treated, yield increases could payback soil testing and variable rate application costs. However, it wasn’t economic when the soil pH was consistently low (i.e. pH<4.5, Stott et al. 2019).
Lime quality
A common question growers ask is which lime source should I use? Attanayake evaluated the responses of five lime sources with different characteristics in a field trial at Mt Mercer and in a pot study. The limes were geographically spread and included one hard lime (Buchan) and four soft limes (Caroline, Batesford, Sale and Curdievale). In the pot study, the pH change was evaluated using limes sieved into seven fraction sieves (<0.075mm, 0.075–0.15mm, 0.15–0.3mm, 0.3–0.5mm, 0.5–1.0mm, 1.0–2.0mm and >2mm) and incorporated into cups containing Mt Mercer soil.
The trial showed that the CaCO3 content of limes, reflected by Neutralising Value (NV), was a major determinate of pH change. X-ray diffraction and XRF spectroscopy identified that the low NV of Batesford and Sale limes (72%) was due to contaminants, which was mainly quartz (silica dioxide).
Lime particle size distribution was also a major determinant of lime performance, in terms of the speed of reaction and size of pH change. Each lime had a differing particle size distributions which influenced performance. Sale lime had a high percentage of fine fractions, but it had less pH change than Caroline, because it contained high amounts of silica rather than carbonate and a low NV. Therefore, Attanayake suggested that the different fraction sizes also be tested for NV.
Attanayake found incorporation of particles <0.075mm created the greatest pH change and so was rated as 100% effective. The other fraction pH changes were compared against it and were rated as 75% for both fraction sizes 0.075–0.15mm and 0.15–0.3mm, 60% for fraction 0.3–0.5mm, 41% for fraction 0.5–1.0mm, 48% for 1.0–2.0mm and 29% for >2mm. the current calculation of quality called the Effective Neutralising Value (ENV) rates particles <0.3mm as 100% effective, while particles >0.3mm and <0.85mm as 60% effective, and particles >0.85mm are rated 10% effective. Attanayake also concluded that lime particles <0.3mm provided the highest contribution to amelioration of soil acidity. However, in comparison, Attanayake’s results showed higher effectiveness of the coarser pH fractions. The Buchan hard lime had similar pH change to the other soft limes, but its effectiveness declined when particle sizes exceeded 0.5mm.
Specific surface area (SSA, which relates to particle size) was measured using a scanning electron microscope and also varied amongst the limes. The higher the SSA, the greater the contact with the soils and hydrogen ions, which was reflected in the neutralising reactions. As expected, the hard lime (Buchan) had lowest SSA due to its greater density.
Attanayake also reported that using a calculation of NV and factoring in particle size fractions as is done in the ENV calculation, the limes were rate in the order of Caroline (most effective pH change), Buchan, Curdievale, Sale and Batesford (least effective). This implies that NV is a very effective way to compare limes.
The pot experiment using different fractions is currently being repeated using surface applications, and it is likely that pH change under the different fractions, and therefore the ratings, could change again.
Incorporation versus surface spreading
Lime had traditionally been recommended to be incorporated into soil where the soil type is suitable, because of a faster pH response and return on investment. However, not all incorporation treatments are successful in treating acidity. A key requirement to success is understanding the soil pH profile and the incorporation method to make sure the incorporation treatment will mix the lime where the acidic layers exist.
In Attanayake’s field trial at Mt Mercer, the five limes were compared using surface liming and incorporation with offset discs to 10cm applied in two passes. Five different limes were applied at 3.5t/ha in late April 2021. The combined results of five limes showed an average pH change of 1.0 pH unit with incorporated lime and 0.4 pH unit with surface applied lime (Figure 1) after five months. The graph also shows that pH rapidly increased with incorporation, while surface application had slower change.
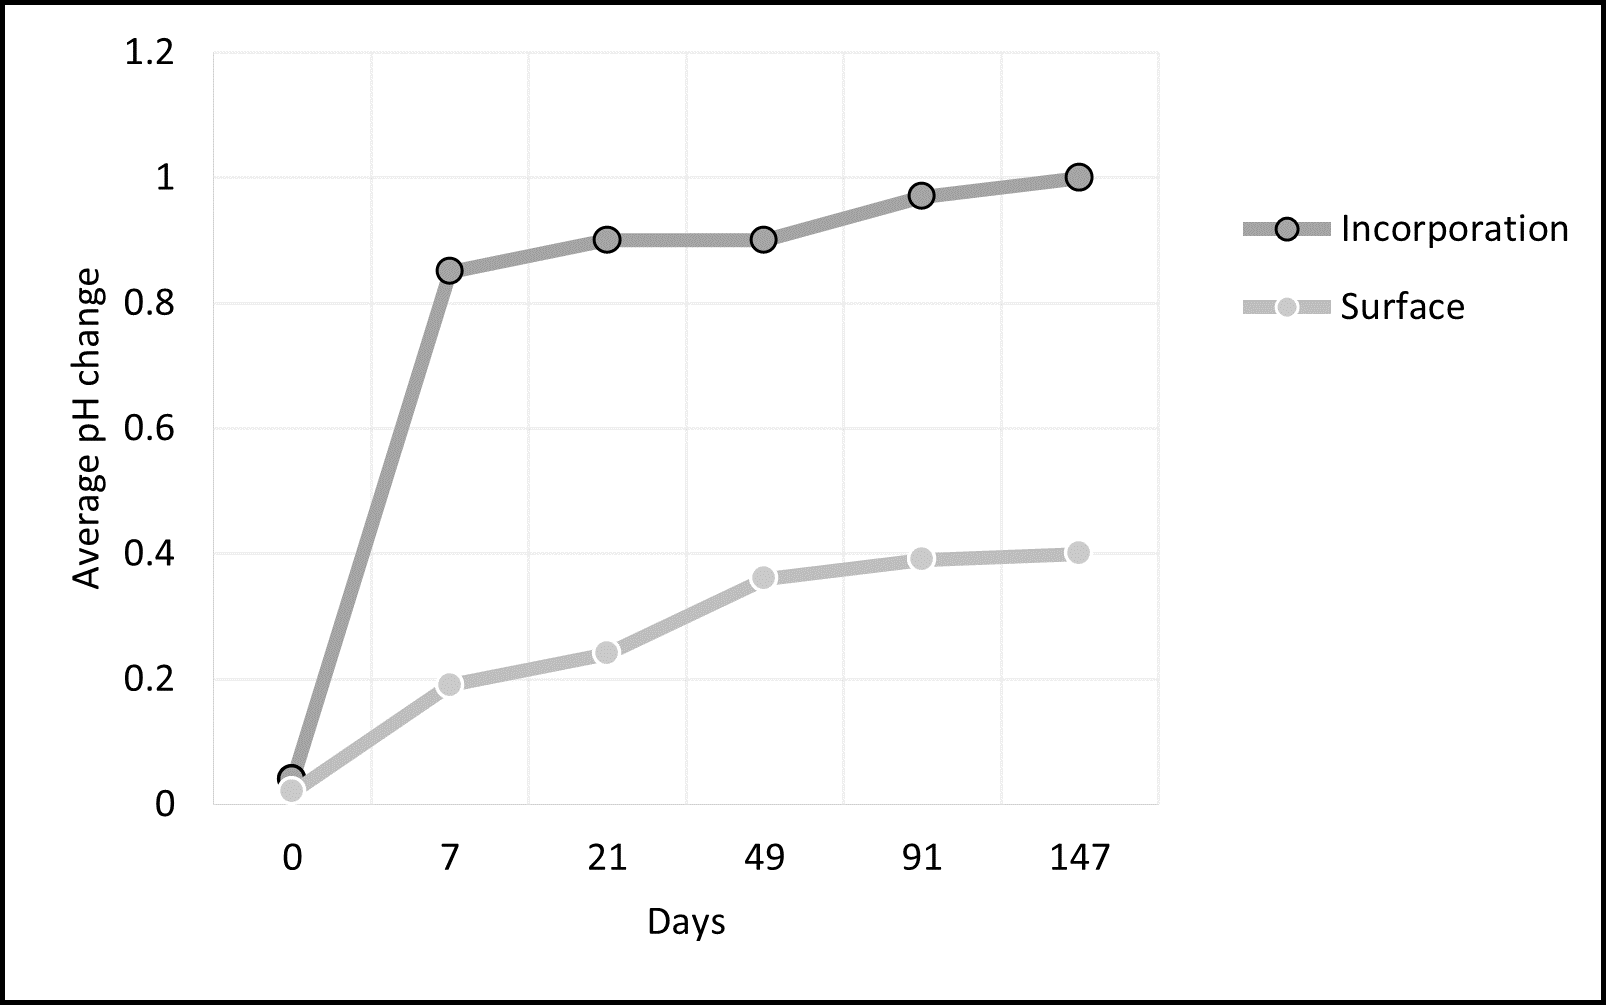
Figure 1. Application method of lime (incorporated and surface) showing average pH change over time (days) at Mt Mercer.
When the pH change was broken down into soil depths of 0–2cm, 2–5cm, 5–10cm and 10–15cm, it showed the following key results.
- At 0–2cm, the five incorporated limes had a similar but slightly higher pH change (1.2 to 1.3 pH units) than surface applied limes (0.8 to 1.2).
- At 2–5cm, incorporated limes had an average pH change from 1.2 (with Batesford, Buchan) to 1.4 (Caroline, Sale), but the surface limes had more variable and much less pH change, i.e. 0.2 (Buchan) to 0.7 (Sale). This variability was explained by differences in lime quality.
- At 5–10cm, the pH differences were most striking. Surface applied limes had 0 pH (Buchan) to 0.2 pH change (Caroline and Sale), in comparison to the incorporated limes which were 1.1 (Sale) to 1.3 (Curdievale and Buchan) (Figures 2 and 3). Both Sale and Caroline had higher components of finer lime which helped lime movement.
- At 10–15cm, there was minimal pH change, with surface applied limes having a pH change of 0.05 (Buchan, Caroline) to 0.15 (Sale) and incorporated limes 0.2 (Batesford, Sale) to 0.4 (Buchan) pH units after 5 months. However, it took about 50 days for significant pH change to occur from incorporated lime at 10–15cm.
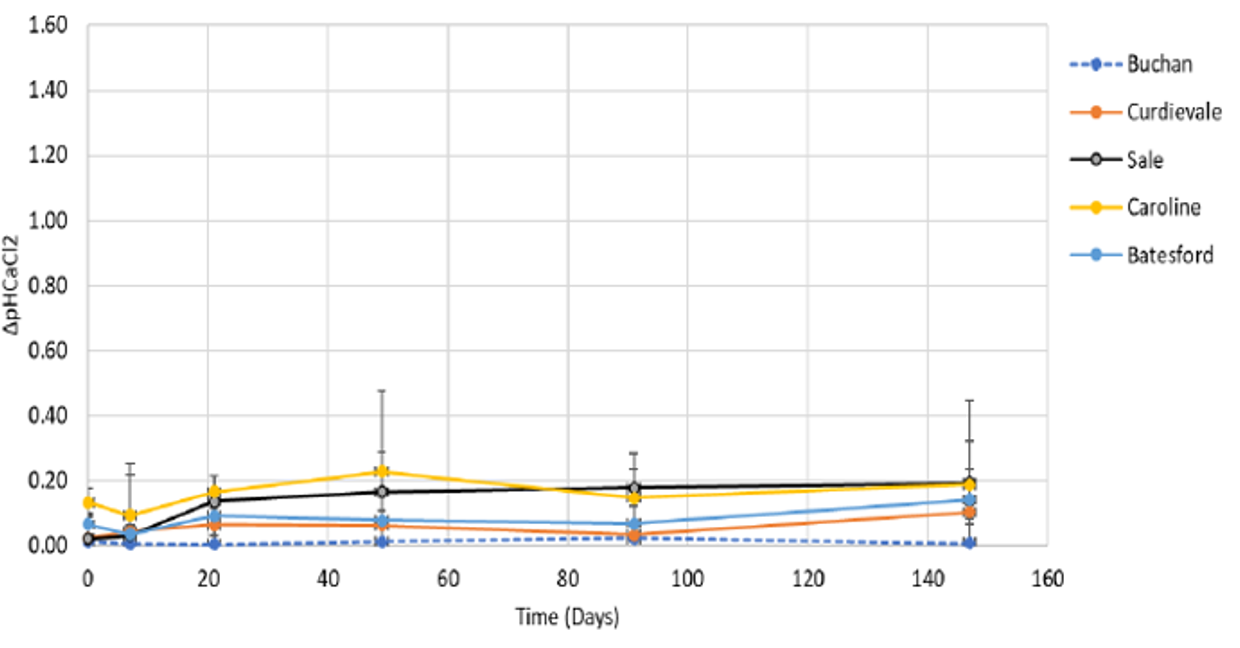
Figure 2. The average pH changes within the five surface applied limes at 5–10cm depth Mt Mercer (Attanayake unpublished).
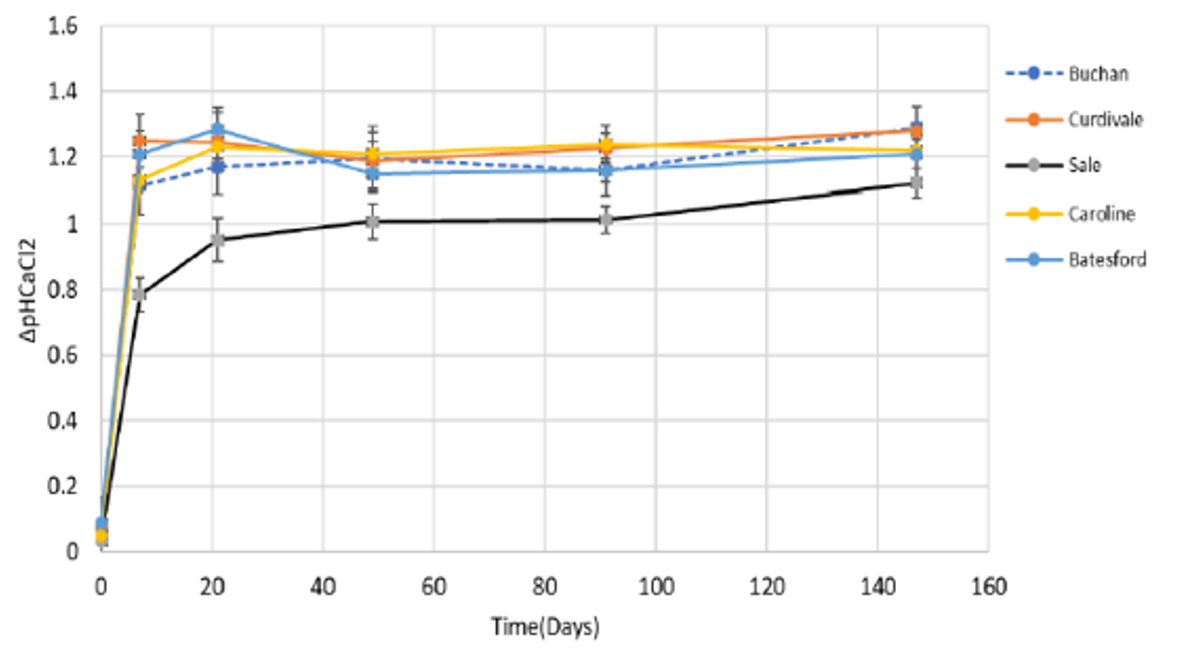
Figure 3. The average pH changes within the five incorporated limes at 5–10cm depth Mt Mercer (Attanayake unpublished).
The implications of these results are that limes with higher quality (NV and fineness) should be especially selected for surface liming and limes with lower quality could be used with incorporation. Lime is regarded as relatively cheap ($18 to $50/t), but the cost of cartage is usually more significant. This means the most cost-effective lime is often the closest to the farm.
These results also indicate the effectiveness of using a disc cultivator to mix the lime into the 10cm soil depth where acidity is most common. Results in SA are showing that discs are more effective at mixing lime compared to tyned cultivators, and one of PIRSA’s most successful lime responses came from using a mouldboard plough (Hughes et al. 2024).
Re-testing soil pH of the Mt Mercer trial site was conducted after 2 years to see if surface liming caught up to the incorporated treatments. Over time, surface application had increased pH change in comparison to the control at the 5–10cm depth by 0.14 pH units but had not caught up to the incorporated limes which were 0.3 units above the control (Figure 4). Most of the surface lime was retained at 0–5cm and had higher pH than the incorporated lime by about 0.2 pH units. There was only a slight increase in pH at 10–15cm with incorporated lime, which was probably from bicarbonate movement. The pH measurements also reflect that pH was decreasing (bicarbonate ions are being used up) due to acidification within the soil.
Figure 4 also shows that the control had a higher pH at 0–5cm compared to 5–10cm and 10–15cm, courtesy of historic liming, and the incorporation only treatment indicates that some of undissolved in situ lime in the 0–5cm layer had been mixed into the 5–10cm area, allowing it to dissolve and raise pH. Western Australian trials have reported benefits of incorporation coming from undissolved in situ lime without any new application (Azam et al. 2019).
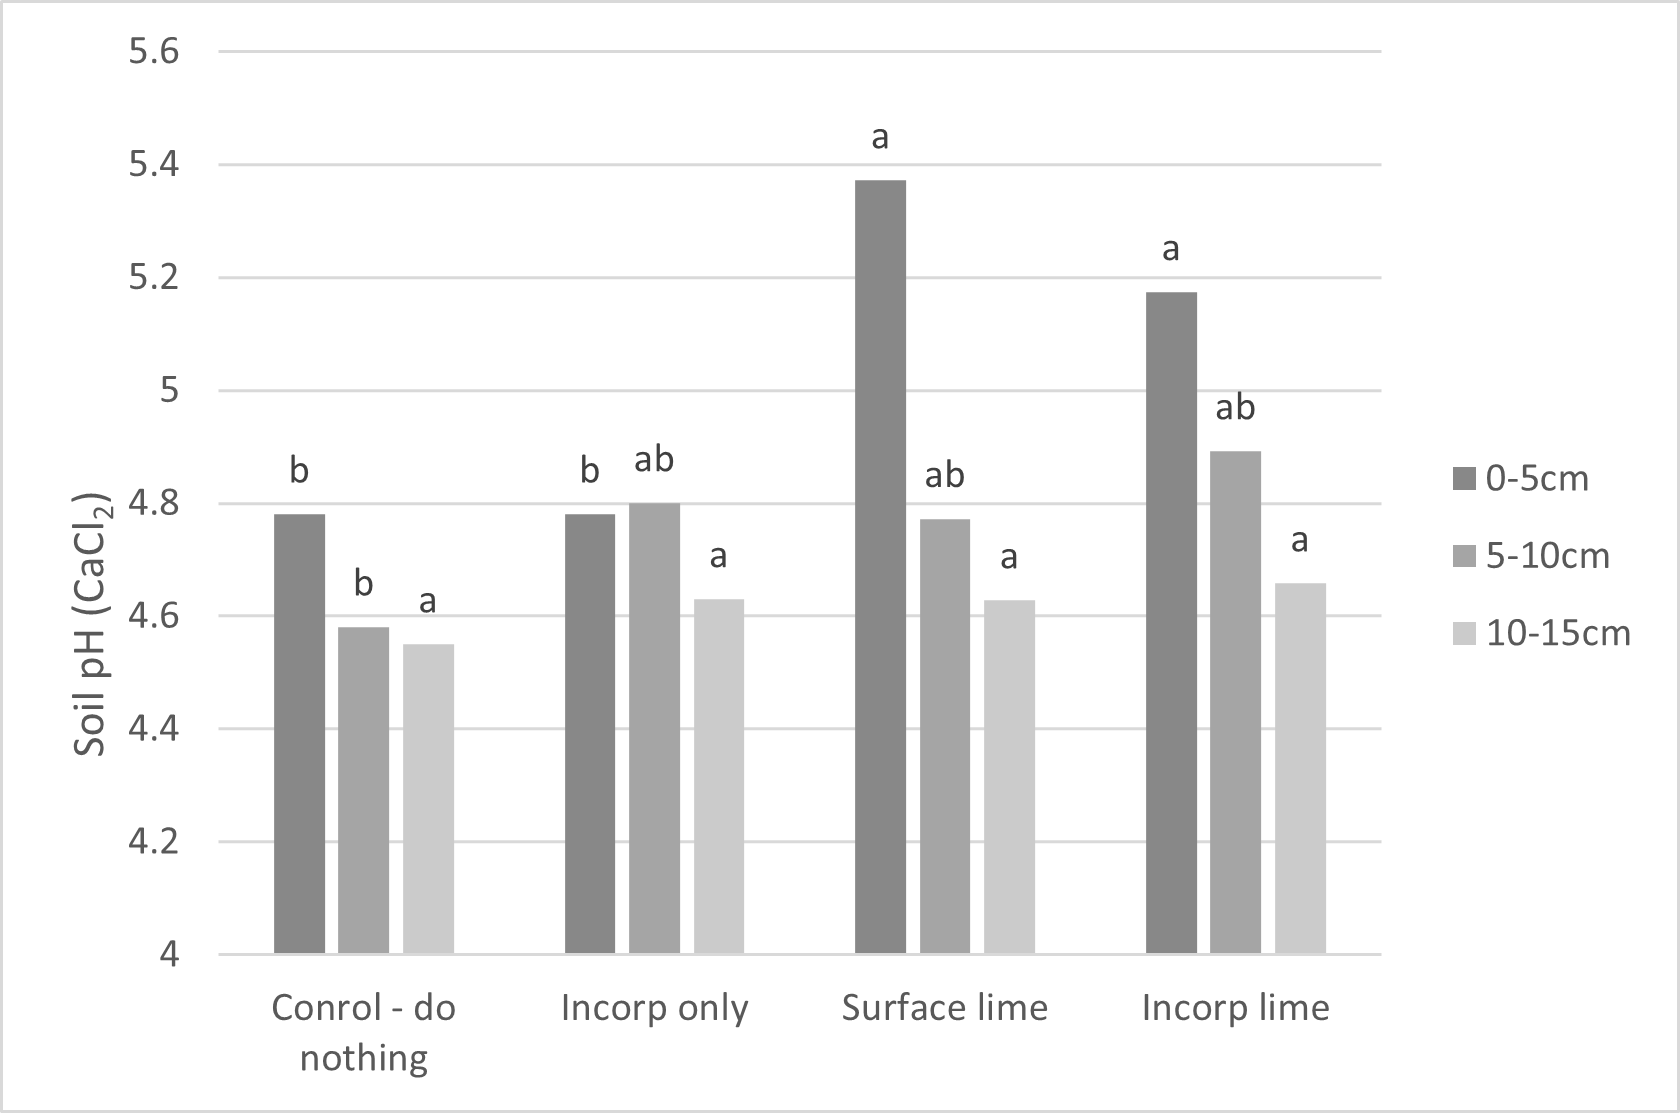
Figure 4. Combined soil pH results for five different limes in 2023, two years following lime application at Mt Mercer.
The remaining questions are what happens to surface lime, does it eventually create the pH change we want, and how long does it take? One of our longest monitored sites at Westmere, where different lime rates were applied to the surface in 2014, shows after 9 years, significant pH change occurred at 5–10cm and at 10–15cm from most lime treatments, but the pH at 5–10cm was still less than 5.0 and less than 4.7 at 10–15cm (Figure 5). There was also evidence of significant pH change after 8 years in the 10–15cm soil layer, which indicates movement was about 2cm/year.
Where the 5–15cm fraction is very strongly acidic (<4.5), consider the use of incorporation, as pH below 4.8 is likely to cause major reductions in yield and incorporation will give benefits to the depth of incorporation within weeks, rather than waiting years with surface application.
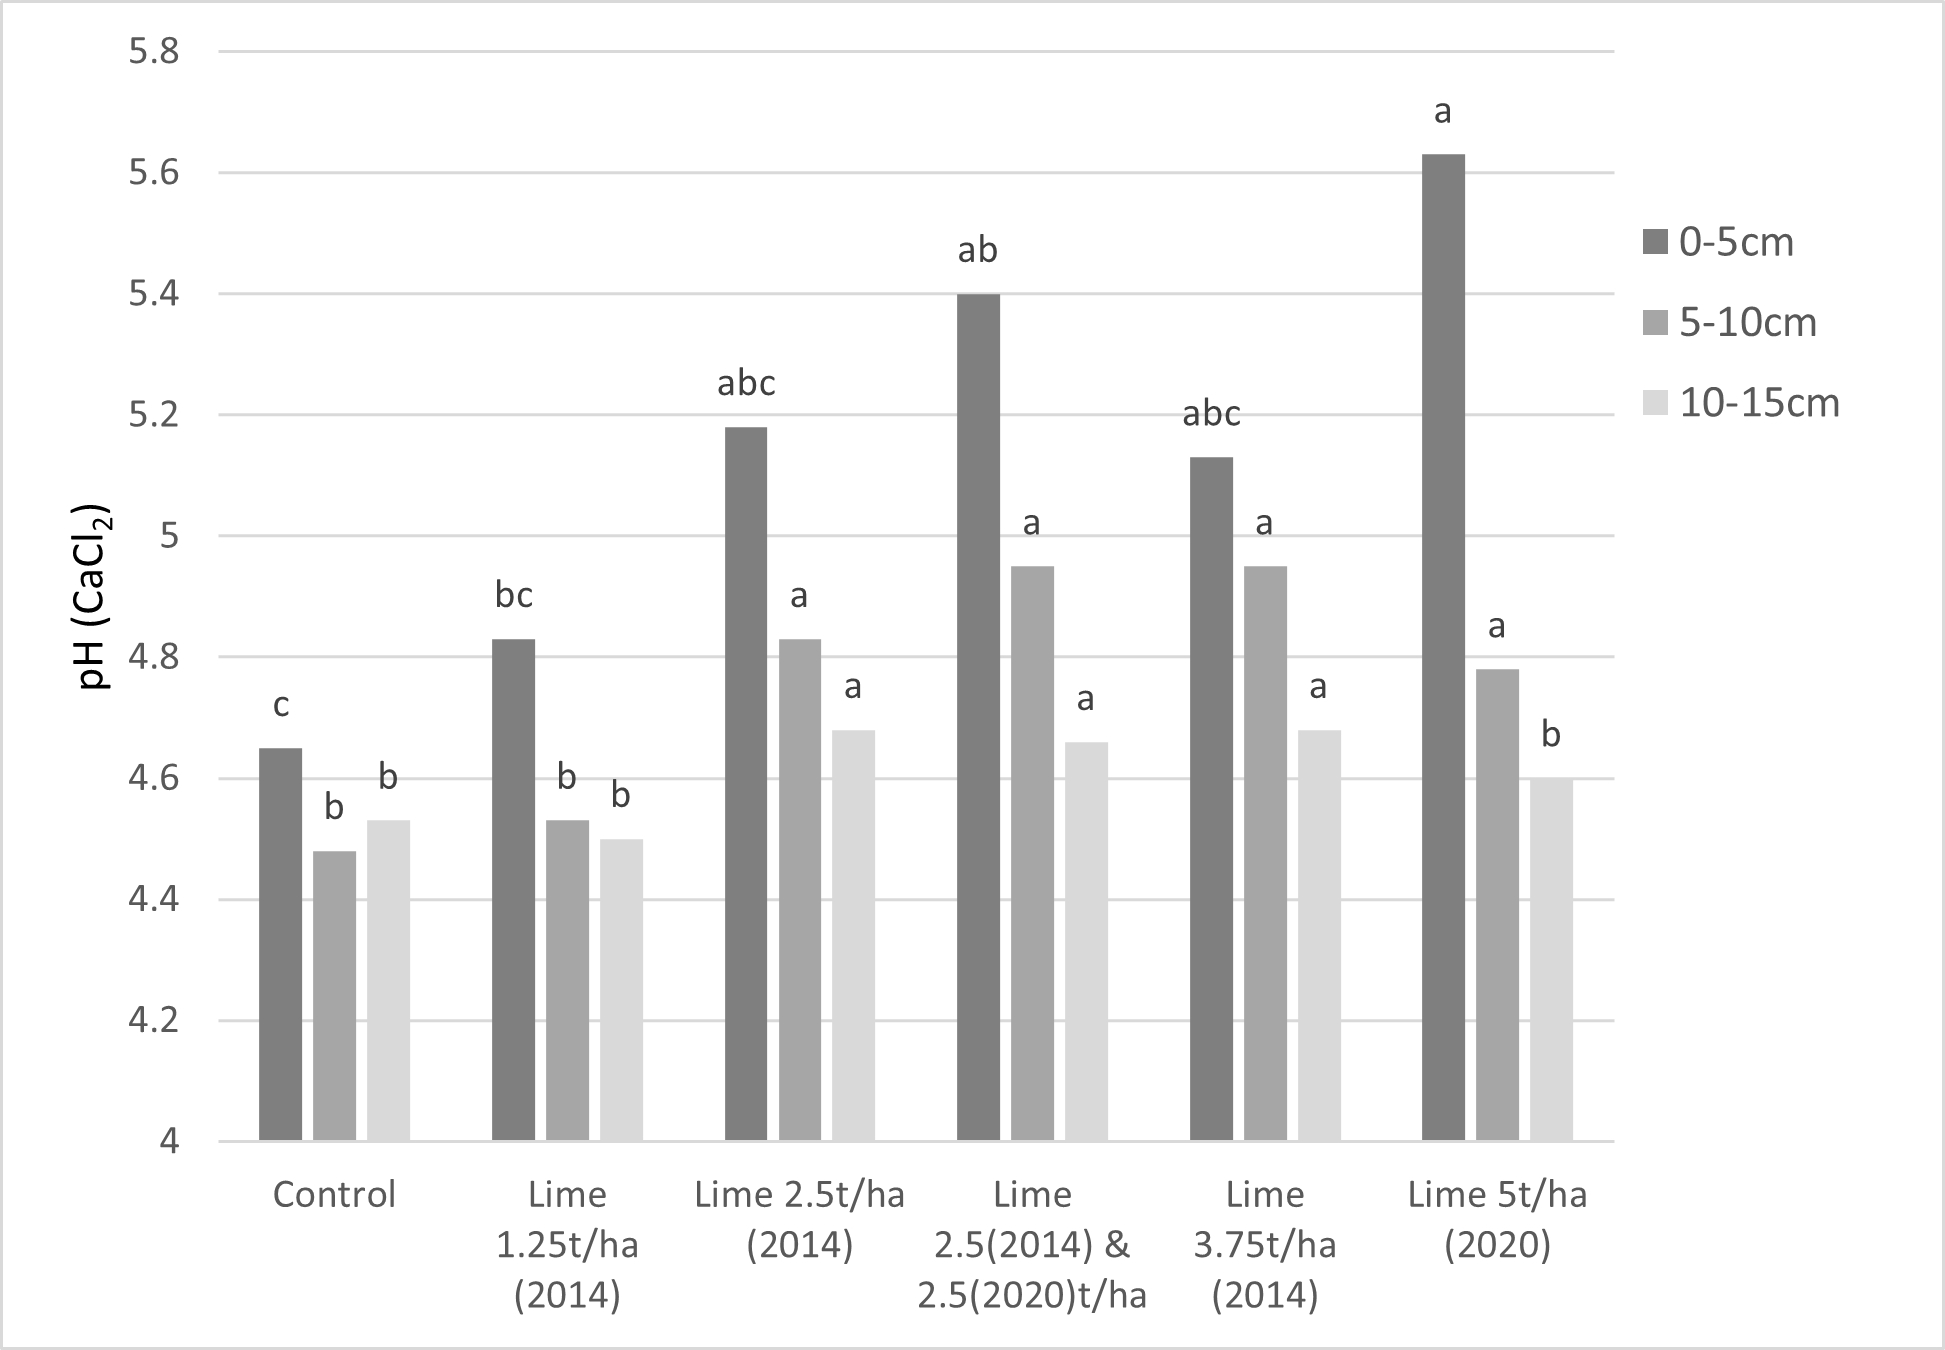
Figure 5. Soil pH change at different soil depths across different lime rates and application times at Westmere from surface liming (Aug 2023).
Timing of lime applications
When to apply lime in the crop rotation is very much dependent on crop susceptibility and lime application method. Lime is traditionally applied before canola because canola is considered acid sensitive. However, numerous trials have suggested that canola is not overly sensitive, and its deep tap root is capable of punching through acidic layers. SFS did not get a significant response in canola at Westmere in 2023 compared to the control where the pH of the control was about 4.5, although reduced crop height was visible in August.
Lucerne and pulses (excluding lupins) are acid sensitive. If you need to apply lime, then do this at least 2 years ahead of the planting pulses and try to maintain a soil pH >5.5 down to 20cm. However, if topdressing without incorporation, then it will take longer to address the acidity at 5–15cm. Therefore, consider using newly bred acid tolerant varieties and strains of rhizobia.
Lime effects on micronutrients
Soil acidity and pH affect nutrient availability and when soil pH is raised with liming, micronutrients such as manganese, zinc, copper and boron may decline, but molybdenum (Mo) uptake may increase. WA and SA commonly issue warnings pertaining to liming on their light textured soils or sands causing micronutrient deficiencies. However, with the heavier soils in NSW and Victoria, the advice is different and the main micronutrient to cause issues is Mo (causing molybdenosis) and possibly manganese. Liming causes higher Mo concentrations within plant tissue, and this can induce copper deficiency in livestock. Mo toxicity in plants is rare, but anecdotally, livestock have done poorly after liming and require treatment with copper supplementation.
In recent tissue testing of SFS soil acidity trials, manganese, zinc, copper and boron all declined under liming, but were still above optimal levels. However, Mo increased, and the highest level recorded was at Inverleigh, which more than doubled following liming to 1mg/kg of dry matter. Copper levels declined from 5.1mg/kg to 4.3mg/kg, which is below the desirable levels (optimal is 5–50mg/kg for cereals, deficient is <1.5mg/kg). Copper deficiency in crops is often not visual, so tissue testing is necessary.
It was also notable that at a new pulse trial at Streatham, the unlimed plots had a Mo level of 0.23mg/kg of dry matter. Optimal Mo levels for pulses are 0.4–5.5mg/kg, which is higher than cereals because of greater legume demand as Mo is necessary for rhizobial nitrogen fixation. After liming, the Mo level increased to about 0.8mg/kg.
To avoid micronutrient issues with liming, plant tissue levels should be monitored. Liming is only likely to induce deficiencies if levels are already low. You should never apply Mo in the same year as liming. Often in the case of pastures, Mo and copper are often applied together to maintain a healthy balance.
Acknowledgements
The research undertaken as part of this project is made possible by the significant contributions of growers through both trial cooperation and the support of the GRDC, the authors would like to thank them for their continued support.
References
Attanyake RM (2023) Developing new methods to help farmers make lime decisions. PhD thesis (unpublished), Centre for eResearch and Digital Innovation, Federation University, Mt Helen
Azam G, Gazey C, Bowles R, D'Antuono M (2019) Recurring lime applications to fix acidity in the whole soil profile. GRDC Update Perth
Hughes B, Harding AP, Fleming NF, Woodard D, Miller LG, Trengove S, Telfer, Guidera, (2024)Messages emerging from long term lime trials to combat soil acidity. GRDC Update Adelaide.
Stott K, Crawford D, Norng S (2019) Quantifying the economic benefits of intensive point sampling and variable rate liming of 10 case-study paddocks in the high rainfall zone. Technical report: Agriculture Victoria, Melbourne.
Contact details
Lisa Miller
Southern Farming Systems
23 High Street, Inverleigh VIC 3321
0488 600 226
lmiller@sfs.org.au
GRDC Project Code: UOA2206-009RTX,
