‘My Climate View’ – a longer-term planning tool for growers, producers, and land managers
‘My Climate View’ – a longer-term planning tool for growers, producers, and land managers
Author: Rebecca Darbyshire (CSIRO), Sigrid Tijs (Bureau of Meteorology), Graeme Sandral (GRDC) | Date: 15 Feb 2024
Take home message
- My Climate View is a free digital product that helps Australian farmers and land managers understand what the future climate might look like for their location and commodity
- The free climate information tool contains information that can help grain growers explore how future climate may impact their enterprise and consider how they may adapt their longer-term plans and production strategies
- Growers can access the tool at www.myclimateview.com.au
- Climate information is available for the past 60 years, for seasonal outlooks, and for future projections for the 2030s, 2050s and 2070s
- Farmers and land managers anywhere in Australia can access local climate information at a 5 km2 resolution
- My Climate View presents climate information for 22 agricultural commodities – almond, apple, avocado, banana, barley, beef, canola, cherry, chickpea, cotton, dairy, lupin, mango, orange, pork, potato, sheep, sorghum, sugarcane, tomato, wheat and wine grape
- Users can download data and reports, and share key climate information with relevant peers, advisers or support networks.
Key features

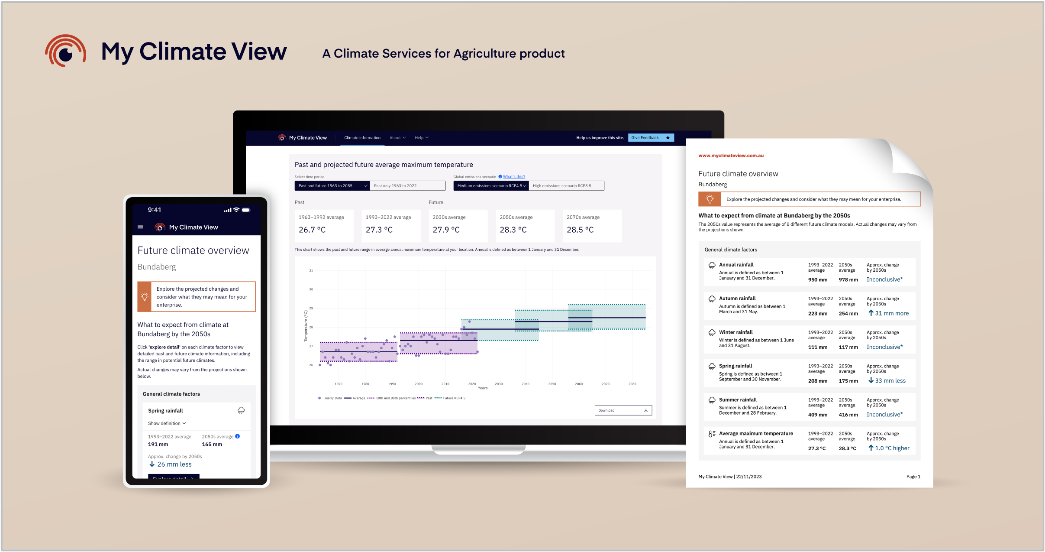
Figure 1. Website interface for My Climate View
Climate factors tailored for grain growers
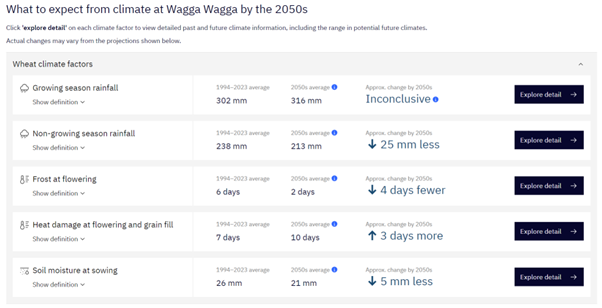
Grain growers can get a tailored overview for what to expect from future climates at their location. For example, the commodity-specific climate factors for wheat, barely, canola and lupins are:
- Growing season rainfall
- Non-growing season rainfall
- Frost at flowering
- Heat damage at flowering and grain fill
- Soil moisture at sowing
Users can use the 'Overview' on My Climate View and the more detailed information to consider how potential changes to their local and commodity-specific climate factors may combine to present challenges and/or opportunities for their production in the future.

Figure 2. Example of the My Climate View ‘Overview’ for 2050s climate projections for wheat at Wagga Wagga
My Climate View provides detailed information about each commodity climate factor and users can modify the definition of climate factors for their specific enterprise, for example modifying the dates which define the growing season.

Figure 3. Example of growing season rainfall and user ability to modify climate factor definition
How were the agricultural climate factors determined?
The agricultural climate factors on My Climate View have been tailored to provide Australian farmers and their advisers with climate information relevant to their location and their commodity.
Each agricultural commodity climate factor was created based on evidence in scientific literature, industry documentation and in consultation with subject matter experts.
How might an agricultural advisor interpret this information for on-farm decision making?
Here, the data from My Climate View has been interpreted by an experienced agricultural scientist (Graeme Sandral) with his interpretations provided below to indicate how My Climate View information can be further interpreted for individual circumstances.

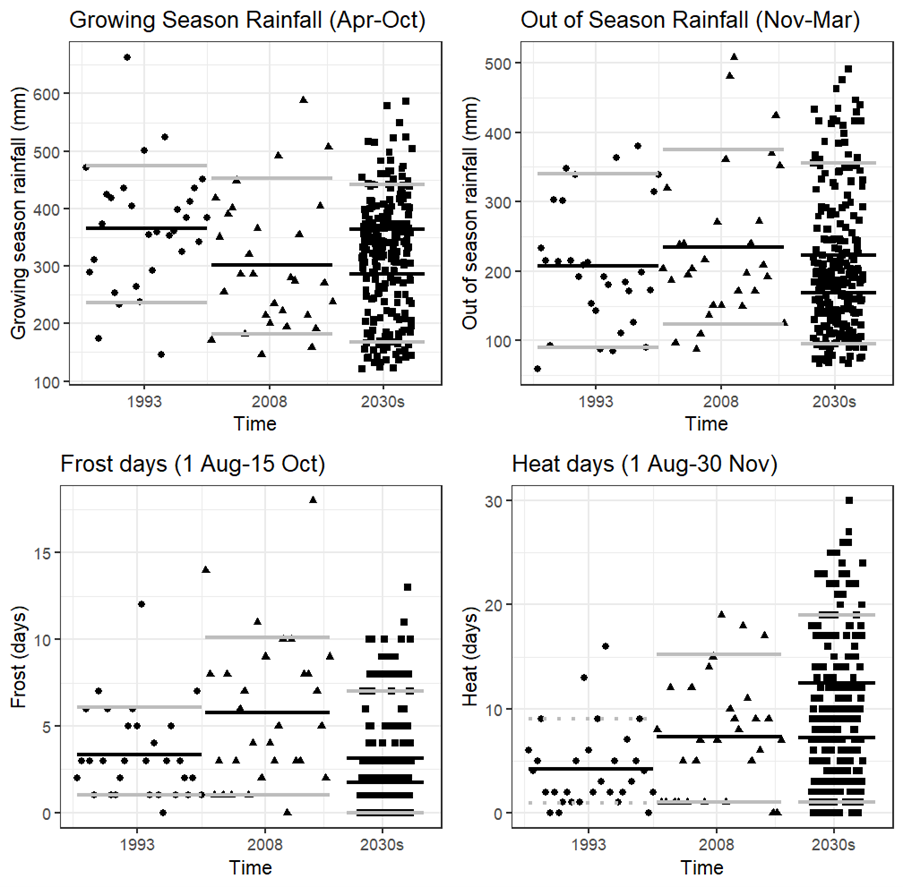
Figure 4. Data extracted from My Climate View for three 30-year time blocks, 1964-1993 (circles), 1994-2023 (triangles) and projected climate for the 2030s (squares) for growing season rainfall April 1 to October 30 (Figure 4 top left), rainfall outside the growing seasons covering 1 November to 31 March (Figure 4 top right), number of frosts equal to or below zero degrees between 1 August and 15 October (Figure 4 bottom left) and number of heat stress events between 1 August and 30 November equal to or above 32 degrees (Figure 4 bottom right). Solid black lines represent the mean and upper and lower grey lines the 90th and 10th percentiles. For the 2030s, the two solid lines indicate the mean range across 8 future climate models. The 2030s projections are based on a high emissions scenario (RCP8.5).
Comparing the period 1965-1993 (circles) against the period 1995-2023 (triangles) shows that growing season rainfall was on average lower in the more recent period (Figure 4 top left) while out of growing season rainfall increased compared with the later historical period (Figure 4 top left compared with top right). This has implications for summer fallow management and highlights its increasing importance in maintaining yield outcomes. Future scenarios (squares) for growing season rainfall suggest similar or slightly lower rainfall than historic records (Figure 4 top left) with the range in mean future rainfall shown as solid black lines. Future out of season rainfall will likely decline to levels below those records for the period 1965-1993 (Figure 4 top right).
The number of frost events (Figure 4 bottom left) show an increase when comparing 1965-1993 (circles) to 1995-2023 (triangles), however the number of frost days is predicted to decline in future climate (squares) although variability will likely be high and these data only account for changes to minimum temperatures. Hence frost risk may still continue into the future. The number of heat days experienced (Figure 4 bottom right) has increased when comparing 1965-1993 (circles) to 1995-2023 (triangles) and this is likely to continue to increase into the future. The future frost and heat conditions suggest it may be possible to consider crops that have a slightly shorter time to flowering in future climate scenarios primarily because frost events are less likely to impact yield, and this approach is likely to improve avoidance of heat stress (Figure 4 bottom right).
Using the wheat yield conversions provided by Norton et al (2023) in these proceedings, the wheat water limited potential yield (WLPY) is:
WLPY = (WU – 75)*25 / 1000 = t/ha and
WU (mm) = (0.20*Nov–Mar rain) + Apr–Oct rain and
Economic yield is WLPY * 0.8 and
Wheat nitrogen requirement is 20 kg N/t and
Nitrogen (N) use efficiency from soil is assumed at 50%, therefore soil N is 40 kg N/t of wheat.
The wheat yield estimates from the above of 6.6 t/ha (1965-1993), 5.5 t/ha (1995-2023) and a predicted range of 4.5 to 6.7 t/ha (2030s) suggests a potential continuation of yield decline is a potential outcome. The total soil N requirement for these yields is 266 kg N/ha, 220 kg N/ha and 195 to 267 kg N/ha respectively, indicating considerations of likely income and cost declines. How the future climate and corresponding yields (high emissions scenario in this case) play out is worthy of attention to ensure appropriate management strategies can be applied. Remembering it's not about the exact numbers per se but rather being aware of the existing and likely future trend so management changes can readily be brought to bear.
Balancing the above climate and yield scenarios is the other important trend, that over time grain growers have been improving input efficiency as well as water use efficiency (WUE) – producing more grain per mm of rainfall. A focus on improving input efficiency and WUE will likely be more important in future climate scenarios.
Feedback from industry
“The information [on My Climate View] would help inform on plant breeding programs, particularly in relation to factors such as frost, rainfall, and temperature tolerance.
The specific climate factors relevant to wheat [on My Climate View] would provide a great insight into what the future climate may look like over the coming decades and how best to manage it.”
NSW seed supplier at field day in Henty
Using My Climate View
- Visit the My Climate View website (www.myclimateview.com.au) and select your location and commodity.
- Explore the various climate data and projections.
- Download reports and share key climate information with relevant peers, advisers, and support networks.
- Contribute to the future of My Climate View and share how using My Climate View has helped shape your farm management practises.
- Contact the My Climate View team on CSAEnquiries@csiro.au.
Acknowledgements
My Climate View is a collaboration between Australia's national science agency CSIRO and the Bureau of Meteorology, and has been designed together with Australian farmers as part of the Climate Services for Agriculture program thanks to funding from the Australian Government's Future Drought Fund.
This program is also supported by FarmLink Research and Coutts J&R.
My Climate View was developed with extensive input from farmers across the country. Feedback has helped tailor My Climate View to enable farmers to use the projected climate information to best support longer-term agribusiness and risk mitigation planning.
Contact details
Sigrid Tijs
Bureau of Meteorology
Level 2, B Block, Parkes Place West, Parkes ACT 2600
Ph: 0427 257 287
Email: agriculture@bom.gov.au
Date published
February 2024
GRDC Project Code: AGI2206-002OPX,
