Predicting and mapping grain protein content to better understand variability – utilising John Deere’s new Harvestlab™ 3000 grain sensing system
Author: Mikaela J. Tilse (Sydney University), Thomas F. A. Bishop (Sydney University), Patrick Filippi (Sydney University) | Date: 29 Feb 2024
Take home message
- Maps of grain protein content are useful for understanding how and why grain protein varies and for informing management decisions
- While maps of grain protein content are not available for every field, farm, and season, a combination of on-farm and/or publicly available data can be used to build a model to predict and map grain protein content to fill information gaps across fields and farms
- Predictions of grain protein content within a field can be improved if at least one header is equipped with a grain protein sensor within a field at harvest
- The relationship between yield and grain protein content is not always negative. Further research is needed to understand what is driving variations in grain protein content within and between fields, farms, and seasons.
Background
Grain protein content is one of the key determinants of the price that grain growers receive for grain. Like grain yield, within and between field variation of grain protein content can be large (Figure 1). Grain protein content is determined by a range of factors, including crop type, crop variety, nitrogen available in the soil and applied as fertiliser, and moisture availability during the growing season. Accurately measuring grain protein content within a field, across a farm, and over multiple seasons, can be useful to manage the quality of marketed grain, better understand and improve nitrogen nutrition decisions, and assess the outcomes of agronomic programs or consider alternate management strategies (Whelan, 2019).
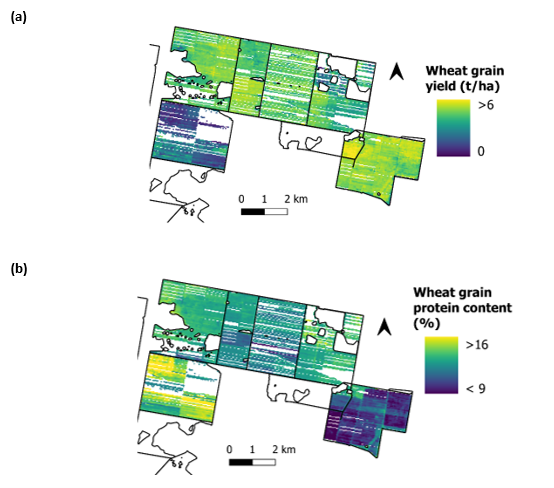 Figure 1. Spatial variation of (a) wheat grain yield, and (b) wheat grain protein content across a northern New South Wales farm.
In 2023, John Deere commercially released the HarvestLab 3000TM grain sensing system in Australia for real-time, on-the-go measurement of protein, starch, and oil values for wheat, barley, and canola. The sensor is mounted onboard the harvester and uses near infrared (NIR) spectroscopy to take measurements of continuous grain flow. The sensor emits NIR radiation which passes through a glass window onto the grain sample. A portion of this radiation is absorbed by the grain, while some is reflected back to the sensor. This NIR reflectance is then measured and the wavelengths are analysed and used to determine properties such as grain protein, oil, or moisture content.
While more growers are adopting the use of grain protein sensors, maps of grain protein content are not available across every field, farm, or for every season. This is resulting in considerable knowledge gaps. There is the potential to utilise this grain protein sensor data to understand how and why grain protein content varies and to improve management. Together with grain yield maps, grain protein content maps can provide an opportunity to make future nitrogen management decisions and optimise both yield and quality, for more profitable and environmentally sustainable production systems.
Today, we have vast amounts of public data that is free to access, including remote sensing imagery. These data layers can represent variability and the factors driving grain protein, including soil moisture stress or potential limitations like a nitrogen deficiency, both within a season and over longer time scales. These publicly available data layers can be used on their own, or in conjunction with on-farm data such as yield maps or cropping history information, to model and map grain protein content.
We present a data-driven, machine learning approach which utilises a combination of on-farm and/or publicly available data layers and sources to model and predict grain protein content within fields and fill knowledge gaps across farms. The aims of this project were to:
- Create a model to predict grain protein content in areas of a farm without a grain protein sensor, using readily available data;
- Assess the benefits of using on-farm and/or publicly available data for improving predictions; and
- Map grain protein content within fields at different spatial resolutions.
In addition, the relationship between grain protein content and yield was also examined spatially within fields.
By building a predictive model to predict grain protein content in areas of a farm without a grain protein sensor, growers and advisors can be equipped with the necessary information and tools to make better management decisions for more profitable and environmentally sustainable production systems. As growers are faced with increasing production costs, maps of grain protein content can be used in conjunction with yield maps, input costs, and the final grain price to map gross margins and better understand the costs of variable grain protein content. Likewise, grain protein maps can be useful to understand nitrogen dynamics and agronomy, including variation in nitrogen availability and the implications of fertiliser decisions prior to or during the growing season. Improving this understanding can have positive outcomes for on-farm economics, production efficiencies, and environmental sustainability. This project aims to demonstrate the value in collecting grain protein data, and the use of this information alongside the growing amount of on-farm and publicly available information to better understand grain protein content.
Method
We present the use of grain protein sensor data from the John Deere HarvestLab 3000TM grain sensing system for mapping and modelling grain protein content in ~80 fields of winter wheat from 2020 to 2022 across two large aggregations in Western Australia (WA) and northern New South Wales (NNSW). Different combinations of on-farm and/or publicly available data layers that can represent variability in grain protein content and the factors that drive this variation were used with machine learning (Random Forest) models to predict and map grain protein content. All data used within the models are described in Table 1. All on-farm data, including agronomic details such as sowing/ harvest dates and variety, and cropping history, was accessed via Precision Cropping Technology (PCT) AgCloud. All publicly available data layers, including remote sensing imagery and terrain attributes, were accessed via the R package ‘dataharvester’ (Haan et al., 2023; Harianto et al., 2023), and are available for every field and farm across Australia. Two different data combinations were compared to assess the value of collecting field-specific information compared to using only publicly available data layers:
- On-farm + publicly available data: all on-farm and publicly available data was used to build predictive models for grain protein content;
- Publicly available data only: no on-farm information was used to build predictive models for grain protein content, and only publicly available data layers were used.
Table 1. On-farm and publicly available data layers for modelling grain protein content using machine learning (Random Forest) models.
Data | Source | Data category | Data layers | |
|---|---|---|---|---|
On-farm | PCT AgCloud | Agronomic data | Sowing date | |
Harvest date | ||||
Variety | ||||
Cropping history | 1 season prior | |||
2 seasons prior | ||||
Publicly available | ‘dataharvester’ | Remote sensing (Sentinel-2A, 10 m spatial resolution) | Current season maximum | Normalised Difference Red Edge (NDRE) |
Normalised Difference Vegetation Index (NDVI) | ||||
Enhanced Vegetation Index (EVI) | ||||
Long-term averages | EVI: 1, 5, and 10 year averages | |||
NDVI and Red Band: 5th, 50, and 95th percentiles | ||||
Bare Earth Imagery | ||||
Terrain attributes | Digital Elevation Model | |||
Radiometrics | Dose rate, Thorium, Uranium, Potassium | |||
Grain protein sensors may not be available across all fields or farms. In some cases, entire fields may not have maps of grain protein content, or only one header may be equipped with a grain protein sensor. This leaves information gaps across parts of or for an entire field. These two scenarios were tested using two validation methods:
- A leave one field-year-out cross validation (LOFYOCV) method was used to simulate cases where grain protein sensor data was not available for an entire field; or
- A two-fold cross validation (2FCV) method was used to simulate cases where only one header is equipped with a grain protein sensor and grain protein data is only available for part of a field.
Grain protein maps were then produced for the different data combinations (on-farm and/or publicly available data) and validation methods (LOFYOCV or 2FCV). Predictions were made at a fine (30 m) resolution and were also aggregated to management zones within each field to reduce noise and provide maps of grain protein content that are more informative for management decisions such as for nitrogen removal and prescription application maps. Each field was divided into six management zones based on yield data for the current season by splitting the data into six even categories. For model validation, all predictions were compared to the observed grain protein values recorded by the John Deere HarvestLab 3000TM grain sensing system at the same location.
While this study did not aim to identify the drivers of grain protein content variability within each model, the relationship between grain yield and protein content was explored. Local correlations between grain yield and protein content were mapped across each field to better understand how this relationship varies spatially and between seasons.
Results and discussion
The model quality was assessed by calculating the root-mean-square error (RMSE) and the Lin’s Concordance Correlation Coefficient (LCCC). The RMSE represents the accuracy of the predictions (how close the predictions are to the true values) and provides a measurement of prediction accuracy in the variable’s units (in the case of grain protein content, %). The LCCC is a measure of both the precision (how close the predictions are to each other) and the accuracy of predictions. The LCCC value explains the fit of the observed and predicted values to a 1:1 line, where values of 0 are a poor fit (poor agreement between observed and predicted values) and 1 for a perfect fit (perfect agreement between observed and predicted values). The LCCC is unitless and is useful for comparing the precision and accuracy of predictions between variables of different magnitudes (Lin, 1989).
Two different data combinations were tested: on-farm + publicly available data, and publicly available data only. Predictions were made at a fine-resolution (Fine-Res) and were aggregated to management zones (M. Zones) within each field, and models were validated using leave one field-year-out cross validation (LOFYOCV) and two-fold cross validation (2FCV). The results are presented in Figure 2.
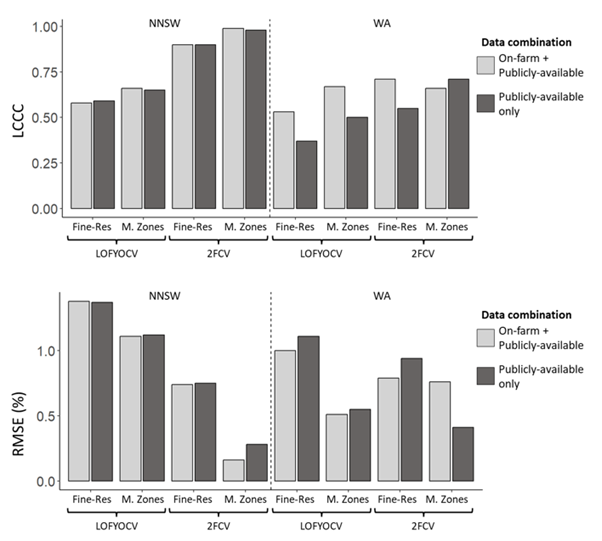
Figure 2. Lins Concordance Correlation Coefficient (LCCC) and Root Mean Square Error (RMSE) values for northern NSW (NNSW) and Western Australia (WA) aggregations for models built using two different data combinations: on-farm + publicly available data layers, and publicly available data only. Fine-Res: Fine-resolution, M. Zones: Management zones. RMSE values are presented in the units of grain protein content, %.
For the NNSW aggregation, there was little difference in both the LCCC and RMSE between the two different data combinations. This suggests collecting on-farm data (e.g. yield data, sowing and harvest dates, cropping history) is not necessary and publicly available data alone is sufficient to build a predictive model for grain protein content in NNSW. For the WA aggregation, the combination of both on-farm and publicly available data layers produced better model quality results.
The agreement between observed and predicted grain protein content values when validated at a fine (30 m) resolution and when aggregated to management zones using the LOFYCV and 2FCV methods are presented in Figure 3 for the NNSW aggregation. Model quality statistics from the data combination that had the best performance (i.e. highest LCCC and lowest RMSE) for both the NNSW and WA aggregations are presented in Table 2.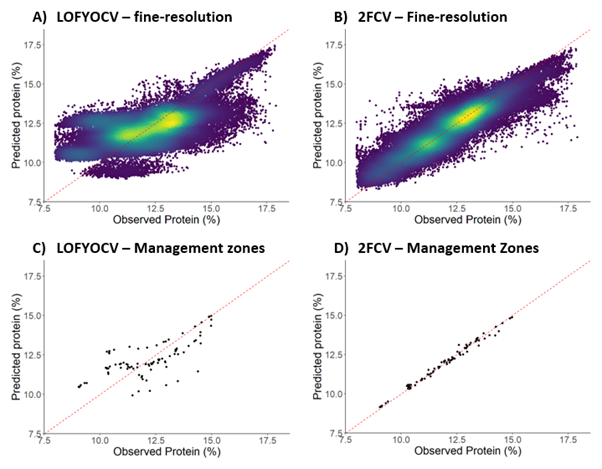
Figure 3. Observed and predicted values of grain protein content from Random Forest models for the northern New South Wales (NNSW) aggregation. Models were validated using leave one field-year out cross validation (LOFYOCV; A and C) and two-fold cross validation (2FCV; B and D) with validations performed at a fine (30 m) resolution (A and B) and aggregated to management zones
(C and D).
Table 2. Model quality statistics for grain protein content (Random Forest) models for the northern NSW (NNSW) and Western Australia (WA) aggregations. Predictions were made at a fine-resolution and were aggregated to management zones using the leave one field-year-out cross validation (LOFYOCV) and two-fold cross-validation (2FCV) methods. Model quality statistics (Lins Concordance Correlation Coefficient, LCCC; Root Mean Square Error, RMSE) are presented for the best data combination for each aggregation (NNSW = Publicly available data only, WA = On-Farm + Publicly available data).
Aggregation | Validation Method | Statistic | Fine resolution | Management Zones |
|---|---|---|---|---|
NNSW | LOFYOCV | LCCC | 0.59 | 0.65 |
RMSE | 1.37 | 1.12 | ||
2FCV | LCCC | 0.90 | 0.98 | |
RMSE | 0.75 | 0.28 | ||
WA | LOFYOCV | LCCC | 0.52 | 0.67 |
RMSE | 1.01 | 0.50 | ||
2FCV | LCCC | 0.70 | 0.92 | |
RMSE | 0.80 | 0.23 |
Overall, model quality improved when predictions were aggregated to management zones, compared to when they were validated at a fine (30 m) spatial resolution (Figures 2 and 3, Table 2). While fine-resolution grain protein maps provide a high-degree of detail describing the spatial variability of grain protein content, these may be difficult to use to make operational decisions. When implementing precision agriculture (PA) practices it is common practice to divide a field into management zones. Aggregating grain protein content predictions to management zones can smooth small-scale noise and may be useful for informing management decisions such as nitrogen prescription maps.
Model quality was better when the 2FCV method was used compared to the LOFYOCV method (Figures 2 and 3, Table 2). This is logical because only half of a field is removed when using the 2FCV method, compared to the entire field being removed during LOFYOCV. By retaining half of the field in 2FCV, valuable field-specific information that may describe and explain variability in grain protein content is used in the model building process. The 2FCV method simulated cases where only one header within a field is equipped with a grain protein sensor, resulting in grain protein content data being collected for only half the field. On the other hand, the LOFYOCV method simulated cases where grain protein data is not available for an entire field. Model quality can be improved if some harvest data within a field is collected for the current season. Available data for part of a field may help capture any seasonal interactions between grain protein and environmental (e.g. rainfall or temperature) or soil conditions (e.g. constraints or moisture), or management implications (e.g. variety choice, fertiliser application).
While the uptake of grain protein sensors is increasing, it is unlikely that we will see a map of grain protein content for every field, farm, or season in the near future. Here, we highlight the potential to use existing on-farm agronomic information and publicly available data layers to model and map grain protein content to fill-in previously unmapped areas of a farm. Publicly available data layers were chosen to represent the factors that drive variability in grain protein content, meaning that bespoke soil samples or Electromagnetic (EM) surveys, for example, are not required for individual fields and growers should not be burdened with additional data collection. Further, this approach did not aim to produce a bespoke model for every field, and instead one model was built for each aggregation. The addition of more fields and seasons worth of data within an aggregation should improve model performance by capturing a greater range of growing conditions. If several seasons of yield and protein data can be collected which represent a range of environment conditions and management scenarios, it is likely that we will be able to map previous seasons of grain protein content data to better understand long-term trends or make forecasts for the current or future seasons.
Figure 4 shows a comparison of observed (Figure 4a) and predicted (Figure 4b) grain protein content values at a fine resolution for a field in the NNSW aggregation using the 2FCV method.
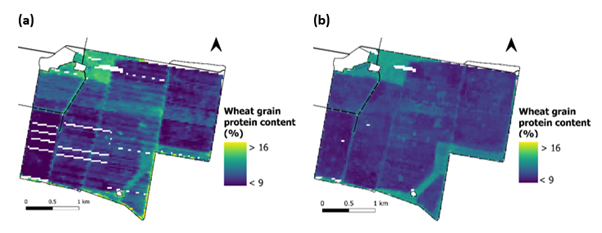
Figure 4. Observed grain protein values (a) were compared with Random Forest model predictions at a fine-resolution using the two-fold cross validation (2FCV) method (b).
Overall, model quality for the entire NNSW and WA aggregations was moderate-to-good (Figures 2 and 3, Table 2), but it is still unclear what is driving variability. The factors driving grain protein content predictions within models will be examined in future research, but seasonal fluctuations in environmental conditions and management decisions may influence predictions between fields and seasons. High-yielding, high-protein grain may be desirable for some markets, but grain yield and protein content are often negatively correlated. This inverse relationship is considered to be the result of grain protein dilution by total carbohydrates, which is predominately driven by soil moisture and nitrogen availability. In non-limiting soil moisture situations, increasing the soil nitrogen supply will typically increase grain yield, whereas increasing the nitrogen supply where soil moisture is severely limited will typically increase grain protein (Whelan et al., 2009). Generally, high yield/low protein at harvest may be the result of sub-optimal nitrogen management, whereas low yield/high protein may be the result of a lack of soil moisture supply and a dry finish (Scott, 2022). Other factors such as variety, environmental conditions, and soil constraints also influence the grain yield/protein relationship.
To explore this yield/protein relationship, local correlations between grain yield and protein content were mapped within fields and an example is shown in Figure 5. These grain yield and protein content maps showed considerable variation in both the strength and direction of the relationship between yield and protein.
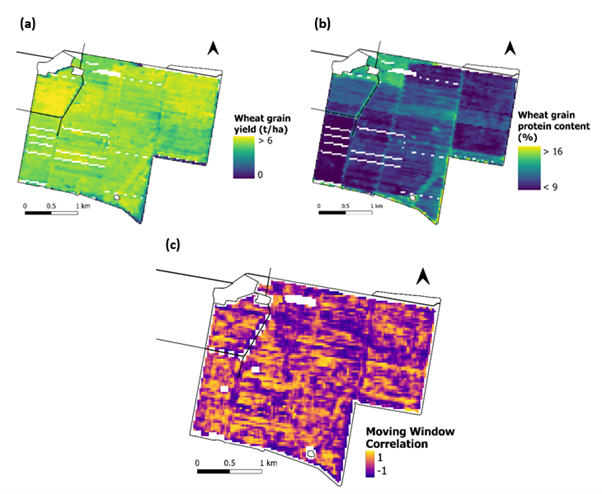
Figure 5. Observed wheat grain yield (t/ha; a) and protein content (%; b) for a field in northern NSW, and their correlations across the field (c). Values closer to -1 indicate a negative relationship between yield and protein, whereas values closer to 1 indicate a positive relationship between yield and protein.
Future research aims to investigate these relationships further through the use of interpretive machine learning models and additional data layers. Typically, machine learning models like Random Forest models are considered a “black box”, where it can be difficult to understand what factors are driving predictions within the model. Interpretive machine learning can be used to overcome this limitation. Interpretive machine learning refers to a collection of techniques developed to identify the importance of individual predictors in a model and determine what was used to make a prediction (Jones et al., 2022). Interpretive machine learning has been used to identify the causes of crop yield variability in cotton (Jones et al., 2022), where digital soil maps and terrain information was used to map cotton lint yield and interpretive machine learning was then used to identify the contribution of each predictor variable to the modelled yield prediction. Interpretive machine learning can be used to understand what may be driving variations in grain protein content and what may explain these changing relationships between yield and protein within and between fields, farms, and seasons. By identifying the contribution of each variable to modelled grain protein predictions, we can then map the major drivers of grain protein content within a field and across farms. Applying this over multiple seasons may also help to identify any seasonal fluctuations or changes in the drivers of grain protein over time.
Future research
This research is part of a PhD project currently being undertaken by Mikaela Tilse at the Precision Agriculture Laboratory, The University of Sydney, titled ‘Assessing yield, fibre, and grain quality variability in cropping systems through data science for improved management’. This research, alongside output from several GRDC-funded projects will be used in the future to better understand the drivers of grain protein content variability.
SoilWaterNow: Soil water nowcasting for the grains industry (GRDC code UOS2002-001RTX) is a GRDC-funded project led by The University of Sydney which aims to predict soil water content in near-real-time within and between fields and at multiple depths in the soil profile.
Next Generation Machine Learning models for 3D soil-mapping applications (GRDC code UOS2206-009RTX) is another GRDC-funded project led by The University of Sydney that aims to build and test machine learning models to map soil constraints and plant available water capacity across a range of environments in Australia’s grain growing regions. This project also aims to develop constraint-limited plant available water capacity maps based on soil x crop dynamics.
The output from these projects may be useful as inputs within interpretive machine learning models to help understand and describe some of the factors that drive variability in grain protein content, including soil moisture dynamics. Overall, future work aims to better understand the drivers of grain protein content and the interactions between grain protein, soil water, and soil constraints.
Conclusions
In the absence of grain protein sensor data, a combination of on-farm and publicly available data layers can be used to build a predictive model to predict grain protein content. Model performance was moderate-to-good overall and the addition of at least some grain protein sensor data within a field improved model performance. Model quality improved when predictions were validated using 2FCV compared to LOFYOCV, and performance also improved when predictions were aggregated from a fine (30 m) resolution to management zones. Moving forward, future research will investigate the drivers of grain protein content within and between fields and seasons through the use of interpretive machine learning and outputs from current GRDC-funded projects led by The University of Sydney.
Acknowledgements
We would like to thank Viridis Ag for providing access to the data and being a partner in this research, and Precision Cropping Technologies (PCT) for their collaboration in this research and facilitating access to the yield and protein datasets. We would also like to thank John Deere for their ongoing collaborations. We also acknowledge the support of the Sydney Informatics Hub, a Core Research Facility of the University of Sydney, and the Agricultural Research Federation (AgReFed) for their development of the data harvester.
References
Haan S, Harianto J, Butterworth N, Bishop T (2023) Geodata-Harvester: A Python package to jumpstart geospatial data extraction and analysis. Journal of Open Source Software, 8(89), 5205. https://doi.org/10.21105/joss.05205
Harianto J, Haan S, Butterworth N (2023) dataharvester: Download and Process Geospatial Data (R package version 0.1.2). https://sydney-informatics-hub.github.io/dataharvester/
Jones EJ, Bishop TFA, Malone BP, Hulme PJ, Whelan BM, Filippi P (2022) Identifying causes of crop yield variability with interpretive machine learning. Computers and Electronics in Agriculture, 192(December 2021), 106632. https://doi.org/10.1016/j.compag.2021.106632
Lin L-K (1989). A concordance correlation coefficient to evaluate reproducibility. Biometrics, 45(1), 255–268. https://doi.org/10.2307/2532051
Scott E (2022). Protein mapping - getting more bang for your fertiliser buck. GRDC 2022 Grains Research Update – South. https://grdc.com.au/resources-and-publications/grdc-update-papers/tab-content/grdc-update-papers/2022/02/protein-mapping-getting-more-bang-for-your-fertiliser-buck
Whelan B (2019). On-the-go protein sensors. GRDC 2019 Grains Research Update – Pallamallawa. https://grdc.com.au/resources-and-publications/grdc-update-papers/tab-content/grdc-update-papers/2019/03/on-the-go-protein-sensors
Whelan BM, Taylor JA, Hassall JA (2009) Site-specific variation in wheat grain protein concentration and wheat grain yield measured on an Australian farm using harvester-mounted on-the-go sensors. Crop and Pasture Science, 60(9), 808–817. https://doi.org/10.1071/CP08343
Contact details
Mikaela Tilse
Precision Agriculture Laboratory, Sydney Institute of Agriculture, School of Life and Environmental Sciences, The University of Sydney
Level 3, Biomedical Building, 1 Central Avenue, Australian Technology Park, Eveleigh NSW 2015
Ph: 0458 033 311
Email: mikaela.tilse@sydney.edu.au
Date published
February 2024
TM Trademark
GRDC Project Code: UOS2002-001RTX, UOS2206-009RTX,
Was this page helpful?
YOUR FEEDBACK
