Redlegged earth mite (RLEM) and pesticide resistance: the latest in best practice management and new decision-aid tools
Take home messages
- Rising RLEM resistance issues are prompting a re-evaluation of the dependence on insecticides for control
- New tools for better management:
- A new interactive tool summarises RLEM management strategies in canola for users, analysing impacts on RLEM, other pests, beneficials, and resistance development
- A predictive tool for estimating hatch timing improves the timing of RLEM autumn monitoring
- TimeRite® strategy revisions have led to earlier estimated TimeRite dates as RLEM responds to climatic changes.
Background
The redlegged earth mite (Halotydeus destructor, RLEM) is a destructive and economically important pest in Australia’s grain and pasture crops. The repeated use of limited chemical control options for RLEM has resulted in resistance issues across large areas of Western Australia and parts of south-eastern Australia. Many RLEM populations in these areas are resistant to synthetic pyrethroids (SPs), organophosphates (OPs), or both. This rise in resistance demonstrates a need to change the way insecticides are used to minimise the risk of further resistance in RLEM.
In this update, we will:
- present data on the current resistance status of RLEM in Australia;
- present the new seasonal risk tool for RLEM and other pests in canola;
- demonstrate the new RLEM hatch timing tool; and
- present research on updating the TimeRite® strategy.
The current resistance status of RLEM in Australia
Resistant RLEM populations have been detected across Western Australia, South Australia, and Victoria since resistance surveillance began in 2006. Screening undertaken between 2006 and 2023 found SP resistance to be widespread across the southern regions of Western Australia and in some parts of South Australia (Arthur et al. 2021). Organophosphate resistance has been detected in the southern regions of Western Australia and parts of South Australia and Victoria. Presently, no neonicotinoid resistance has been detected, but resistance monitoring is being conducted.
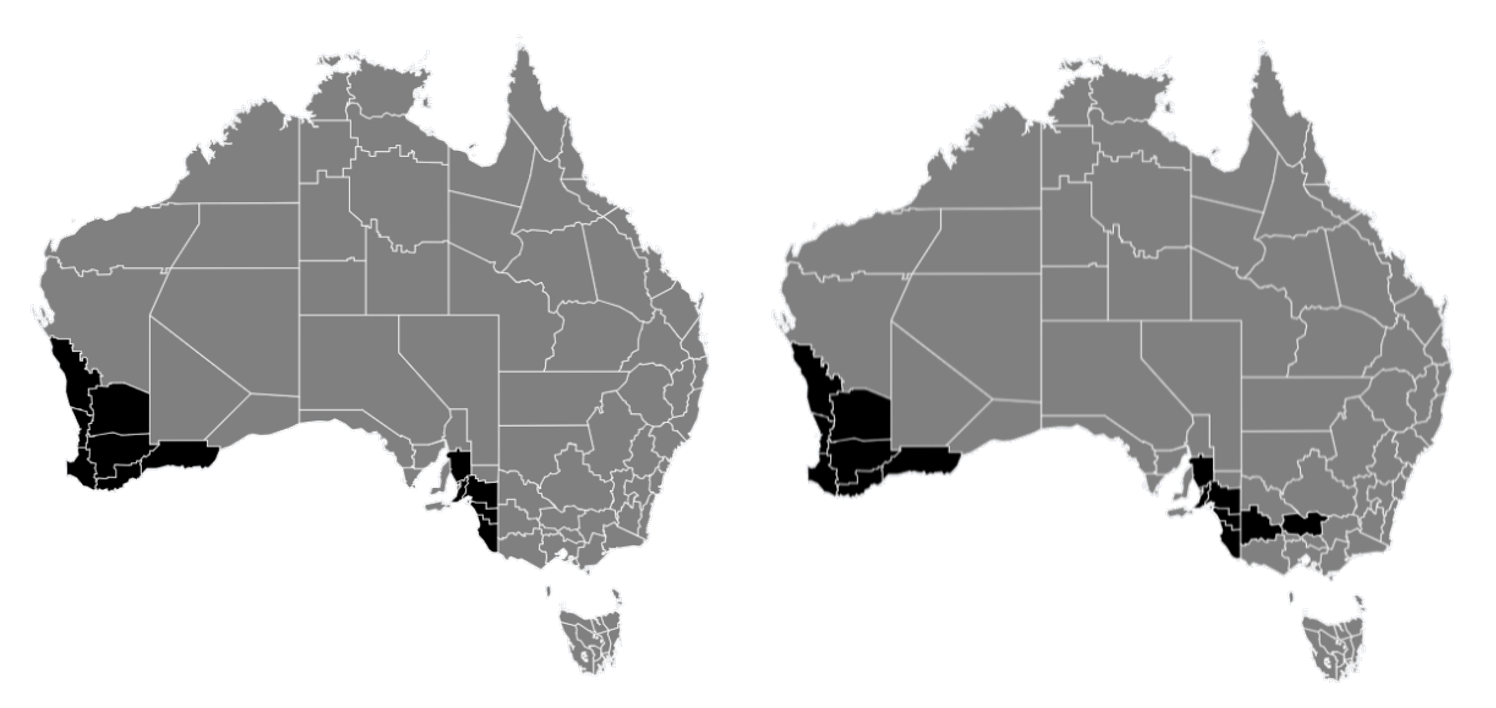
Within Western Australia, the current distribution of SP and OP resistance is widespread, covering the southwest, great southern, south coastal and wheatbelt regions (Figure 1).
In South Australia resistance to OPs and SPs was first discovered in 2016 with new detections continuing to accumulate. Approximately 60% of the RLEM possessing resistance in eastern Australia were collected from pasture seed sites. More recently, resistant populations have been detected in the mid-north region.
Resistance to OPs in Victoria was first detected in 2018, at Wanalta in north central Victoria (Arthur et al. 2021). Since then, several OP resistant populations have been detected in Victoria in the north central region and Minimay in the Wimmera region. There has been no SP resistance detected within Victoria to date.
In New South Wales, there have currently been no cases of resistance detected.
Figure 1. The current distribution of RLEM resistance to pyrethroids (left) and organophosphates (right). Regions with known resistant populations are shown in black.
Seasonal risk tool for RLEM and other pests in canola
Understanding management options for RLEM control is complicated by the wide range of pest and beneficial insects that can inhabit a single paddock. For example, a pesticide used for one pest can be toxic to other insects, which has consequences for resistance evolution and beneficial insects. To help improve management decisions, we developed an interactive seasonal risk tool for RLEM in canola. The tool allows users to explore the impact of various management options to reduce RLEM risk and their consequences on other pests, beneficials, and resistance evolution. The tool is currently in beta release, so users are encouraged to access the tool and submit any feedback through the feedback button on the right side of the tool.
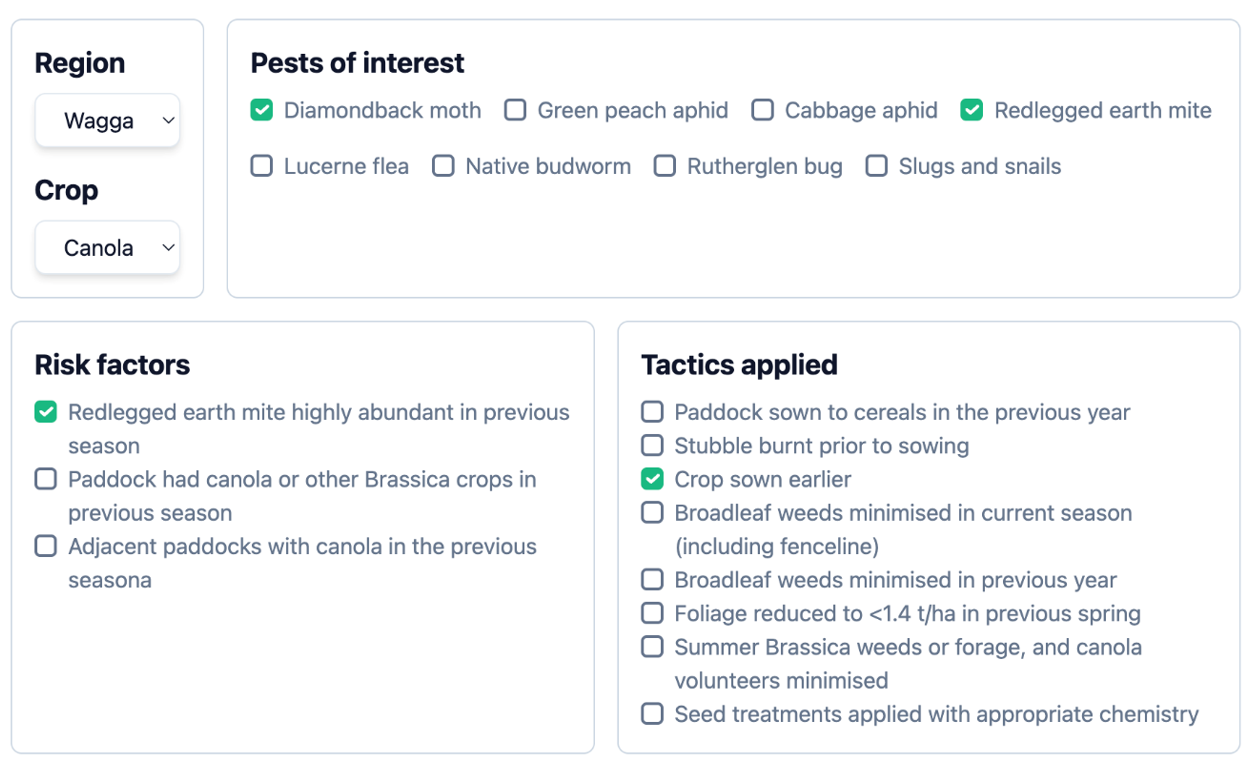
The expected user journey for the tool is shown in the figures below but follows these general steps:
- Users selects their location
- Users select pests of interest to their situation (pests are filtered by location)
- Known risk factors and management tactics for selected pests are presented
- Users select the applicable risk factors and tactics
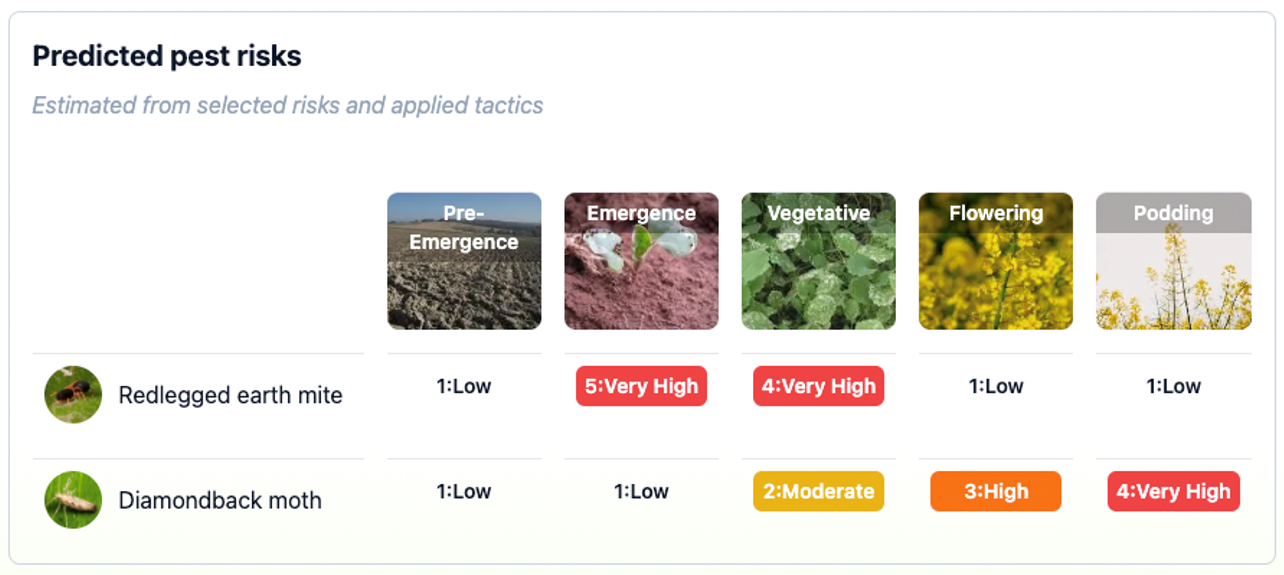
- Based on risk factors and tactics applied, a calendar of estimated pest risks is returned
- Users can experiment with hypothetical management programs to understand the effect on pest risk
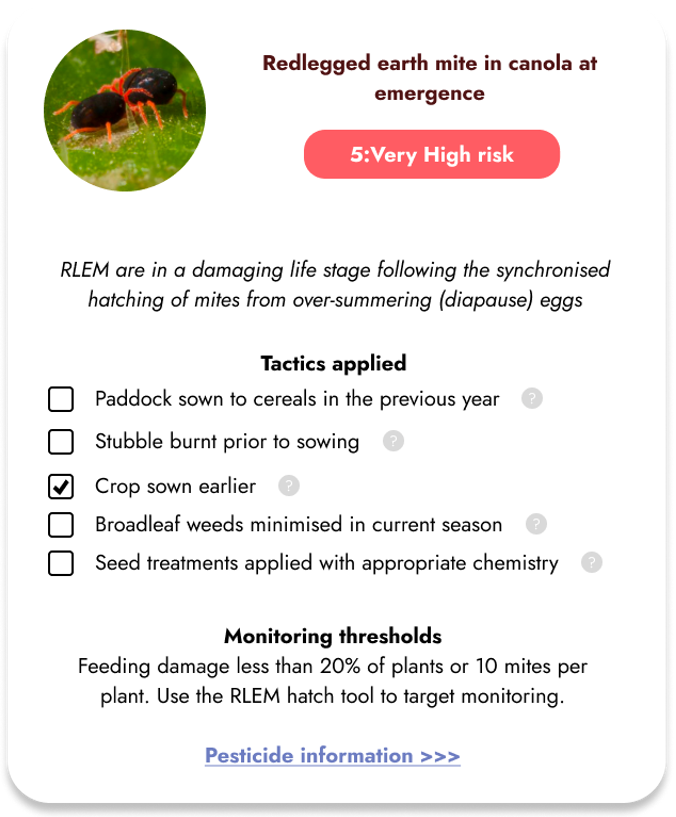
- Action thresholds for pests are provided (where available) and pesticide options can be explored if further action is required
- Known resistance issues and beneficial toxicity information are summarised for each pesticide option
Figure 2. Relevant canola pests for a given location are retrieved and then for the selected pests of interest (e.g. redlegged earth mite and diamondback moth) risk factors and available management tactics are shown. The effects of these risk factors and tactics on pest risk are shown in the next figure.
Figure 3. A crop calendar of risks for selected pests is shown based on the user-selected risk factors and management tactics. Clicking on a risk estimate shows a popup with further monitoring and management information. Users can experiment by selecting different tactics to see how pest risks change.
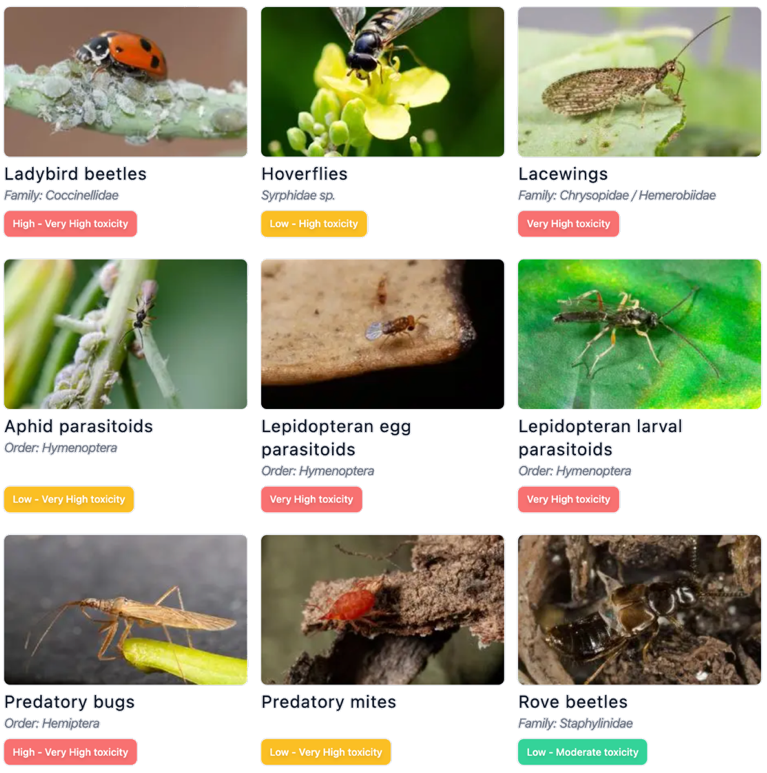
Figure 4. As an illustrative example, pyrethroid pesticides (Group 3A) toxicity is retrieved for beneficial insect groups. This helps users understand off-target impacts associated with pesticide usage. Ratings for toxicity are based on International Organisation for Biological Control (IOBC) protocols for laboratory studies and reflect percent mortality of insects within a particular beneficial group exposed to each chemical. A rating of L represents <30% mortality, M 30–79%, H 80–99% and VH >99% mortality. Further information on the toxicity status for each beneficial group can be accessed by clicking on the beneficial of interest.
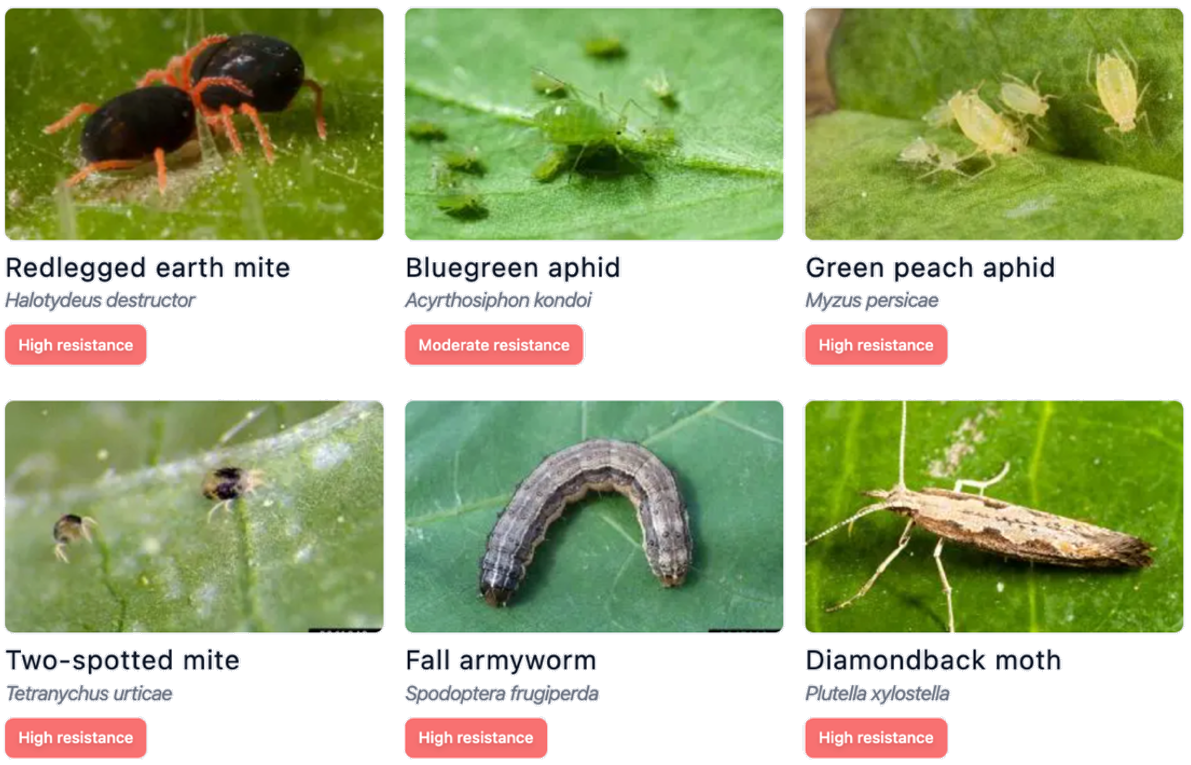
Figure 5. As an illustrative example, pyrethroid pesticide (Group 3A) resistance information is retrieved for pests of Australian grains. This helps users understand which pest species have resistance to a particular class of chemical in Australia. Further information on the resistance status of each pest can be accessed by clicking on the pest of interest. This data was developed through GRDC’s Australian Grains Pest Innovation Initiative (AGPIP).
RLEM hatch timing tool
The ability to predict when RLEM eggs will hatch can help growers understand crop risk during the autumn period and optimise monitoring for RLEM pressure at crop emergence. We developed a tool that predicts the hatch status (unhatched, soon-to-hatch, and hatched) of RLEM. The tool also provides historical estimates so users can understand typical hatching patterns for their region.
We extended a previous study on predicting hatch dates from regional temperature and rainfall conditions (McDonald et al. 2015) to an easy-to-use web interface that will provide the predicted hatch date for a user-defined location. This includes an option for real-time weather data for the current growing season, or long-term average conditions.
The model was validated against field collected mites and available data from the literature. Comparison of the observed hatch dates with predicted hatch dates revealed that the model error was no more than 15 days across all samples, with a mean error (and standard error) of -4.68 (4.03) days. The tool was successful in predicting mite activity before the most economically injurious life stage (i.e., the adult phase), which should allow sufficient time for intervention where necessary.
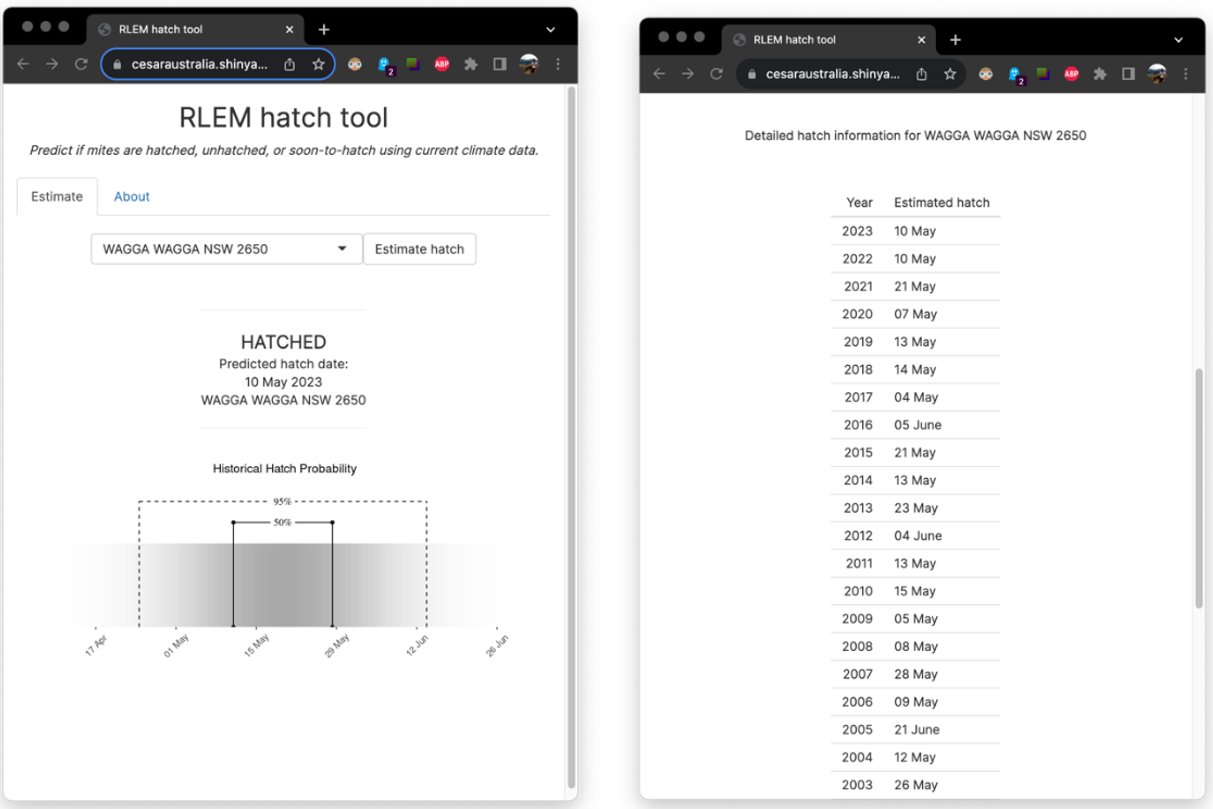
The final version of the hatch tool (Figure 6) is available here.
The app has two tabs, ‘Estimate’ and ‘About’. The ‘Estimate’ tab (Figure 6 - left) shows a simple output of the hatch estimate, while the ‘About’ tab (Figure 6 - right) shows additional information, including historical hatch dates and current climatic data for the season up to the current day.
Figure 6. User interface for the hatch prediction app, showing the ‘Estimate’ (left) and ‘About’ (right) tabs. The location selector in the ‘Estimate’ tab allows users to easily select their location of interest.
Updating the TimeRite® strategy
Pest management strategies may need to change to adapt to new climatic and environmental conditions. TimeRite has been a widely used tool among Australian growers, which has helped improve control outcomes for RLEM and avoid unnecessary pesticide applications. However, the strategy has remained unchanged since its development more than two decades ago.
We aimed to update and improve the TimeRite strategy in several key areas:
- improved model accuracy through the incorporation of changing climates,
- increased flexibility of control programs through a better understanding of control efficacy before and after TimeRite, and
- improved accessibility through a modern and easy-to-use online interface.
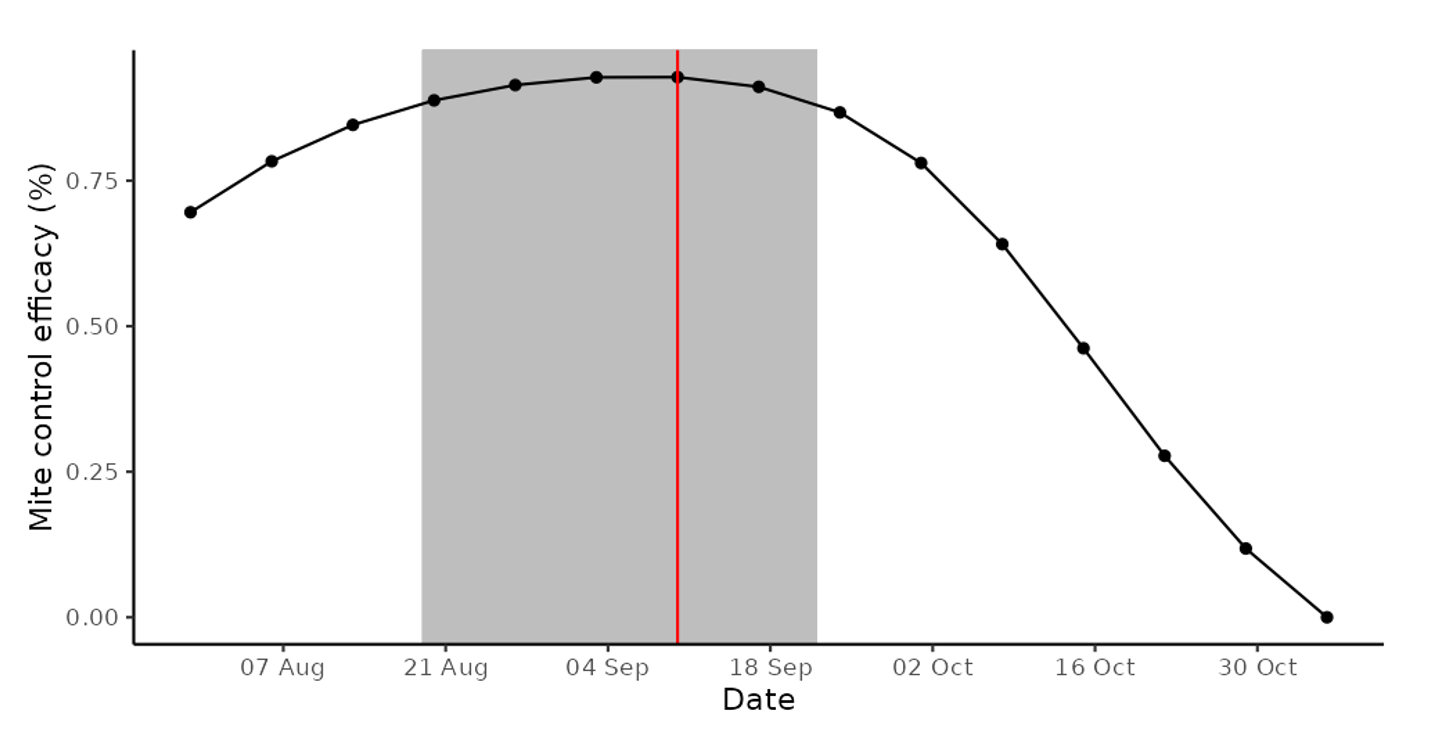
It is envisaged the updated TimeRite tool will be made available to users in mid-2024 at wool.com/land/TimeRite/ where the original TimeRite tool is housed. For example, at Wagga Wagga, NSW, the original TimeRite date was calculated at 29th September, while the updated date is estimated at 7th September reflecting an earlier date for optimal control. Figure 7 shows how the efficacy of control is expected to diminish before and after the TimeRite date. In addition to Wagga Wagga, Table 1 summarises the old and new TimeRite date for other illustrative regions including Port Lincoln, SA, Bendigo, VIC, and Esperance, WA.
Table 1. Comparison of previous TimeRite dates with the new updated TimeRite model predictions. Note that the new model automatically updates as climatic trends shift so should be check every couple of years.
Location | State | Old TimeRite date | New TimeRite date (2024) |
|---|---|---|---|
Wagga Wagga | NSW | 29th September | 7th September |
Port Lincoln | SA | 18th September | 13th September |
Bendigo | VIC | 28th September | 11th September |
Esperance | WA | 26th September | 10th September |
Figure 7. Updated TimeRite estimate for Wagga Wagga, NSW predicts an earlier date for optimal control timing of 7th September compared with original TimeRite date of 29th September. The vertical line denotes the optimal control date, while the grey region denotes the period where efficacy remains at least 95% of the optimum.
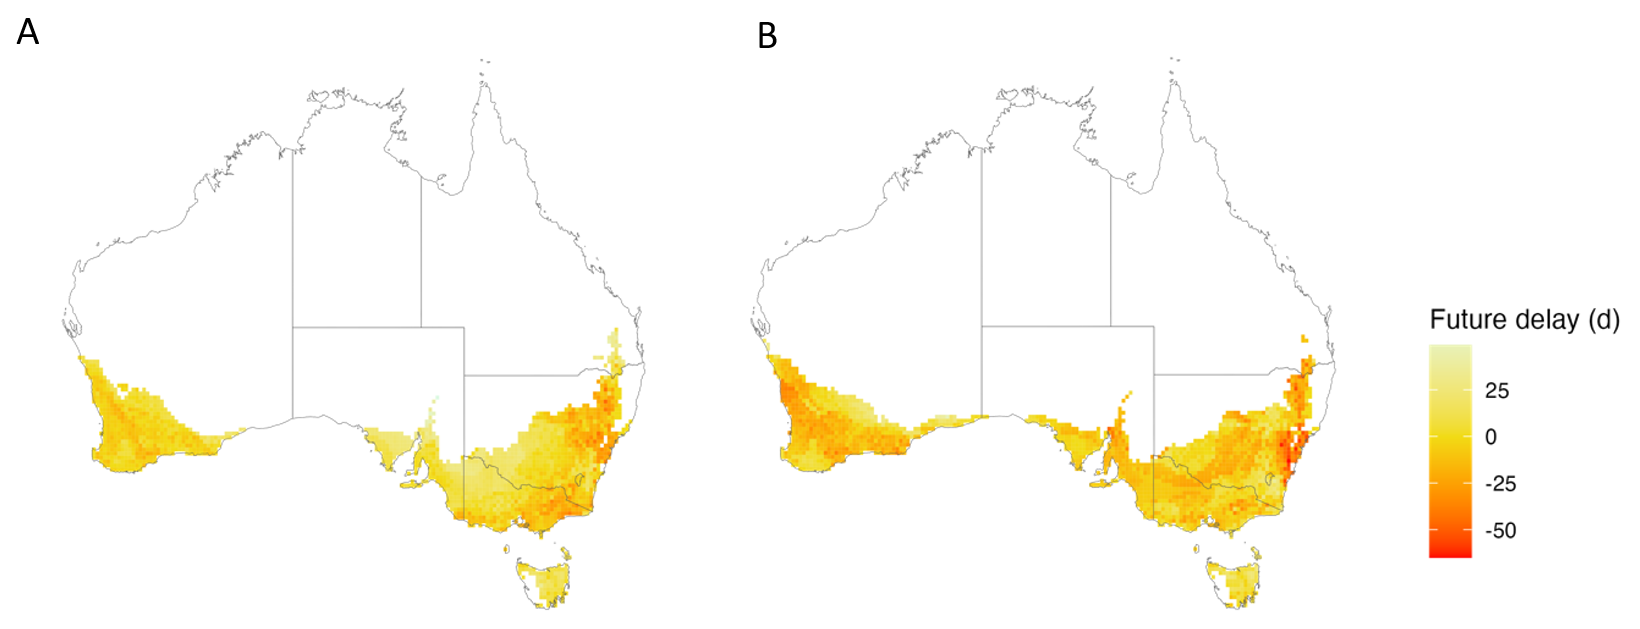
Figure 8 shows that future climate scenarios are likely to bring about further shifts in optimal control to earlier in the season. Generally warmer and drier forecast conditions are expected to cause RLEM to enter diapause earlier in spring and so TimeRite dates are likely to continue to shift earlier in the season.
Figure 8. Predicted shifts in the point of 90% diapause by 2050 under the SSP245 warming scenario (A) and the more extreme SSP585 scenario (B). The shaded regions show the estimated delay in a population reaching 90% diapause. A positive delay represents diapause occurring later in the year relative to 2020 historical data, while a negative delay represents earlier diapause.
Conclusion
The research presented here highlights significant advancements in the understanding and management of RLEM, a critical pest in Australian grain crops. The escalating issue of pesticide resistance, particularly in regions of Western Australia, South Australia, and Victoria, underscores the need for a strategic shift in our approach to managing RLEM.
The introduction of new decision-aid tools, such as the interactive seasonal risk tool for canola and the RLEM hatch timing predictor, represent a major step forward. These tools enable growers to make more informed decisions about pest management, reducing reliance on chemical controls and their impacts on beneficial invertebrates and resistance evolution. Lastly, the revisions to the TimeRite strategy, which include (generally) earlier estimated dates for RLEM management, will help to maintain the effectiveness of this widely adopted management strategy amid changing environmental conditions.
Acknowledgements
The research undertaken as part of this project is made possible by the significant contributions of growers through both trial cooperation and the support of the GRDC, the authors would like to thank them for their continued support. The authors would also like to acknowledge support from AWI, MLA, AgriFutures, DPIRD, and the CSIRO.
References
Arthur AL, Maino J, Hoffmann AA, et al (2021) Learnings from over a decade of increasing pesticide resistance in the redlegged earth mite, Halotydeus destructor Tucker. Pest Manag Sci 77:3013–3024.
McDonald G, Umina PA, Macfadyen S, et al (2015) Predicting the timing of first generation egg hatch for the pest redlegged earth mite Halotydeus destructor (Acari: Penthaleidae). Exp Appl Acarol 65:259–276.
Contact details
Dr James Maino
Senior Scientist, Cesar Australia
95 Albert St, Brunswick, VIC 3052
Ph: 03 9349 4723
Email: jmaino@cesaraustralia.com
Dr Luis Mata
Research Team Lead, Cesar Australia
95 Albert St, Brunswick, VIC 3052
Ph: 03 9349 4723
Email: lmata@cesaraustralia.com
Date published
February 2024
® Registered trademark
GRDC Project Code: CES2010-001RTX,
Was this page helpful?
YOUR FEEDBACK

