Strategies to improve crop establishment and yield on repellent sandy soils after amelioration
Author: Melissa Fraser (Soil Function Consulting), Jack Desbiolles (University of South Australia), Amanda Pearce, Nigel Wilhelm (South Australian Research and Development Institute, PIRSA) | Date: 06 Feb 2024
Take home messages
- Crop establishment can be improved following amelioration by adequately consolidating the seed-bed pre-sowing, which reduces seeder sinkage and excessive soil throw.
- Combining seed broadcasting with in-row seeding in vulnerable paddock zones can increase early ground cover and reduce in-crop wind erosion risks.
- When amelioration of water repellence is successful, sowing rates can be reduced, with seed cost-savings and no penalty to grain yield, providing adequate nutrition is supplied to meet the new crop potential.
- Despite successful amelioration of constraints (clay spreading, delving, spading), crop yields are rarely consistent across different soil types, both spatially and temporally, hence zone-based approaches to soil sampling and in-crop nutrition are still needed to achieve potential yields in different soil types.
Background
Sandy soils that have been deep tilled to eliminate water repellence often have soft seedbeds, face high wind erosion risks and have diluted or re-distributed nutrients through the profile. These consequences of amelioration can hinder crop establishment in the first year and limit grain yield and quality in subsequent years.
A paddock scale trial at Coomandook in the Upper Southeast of South Australia was set up on a water repellent sandy soil to test responses to different deep tillage types and seeding strategies. Results presented here outline the impact of treatments on barley crop establishment in the same year as amelioration (2022), and agronomic strategies to enhance canola yield in the second year (2023).
Data are also presented for two sites at Sherwood, also in the Upper SE. The first site sought to quantify the new yield potential in different paddock zones after amelioration (clay spread deep sand versus delved heavy flat) and to identify economically viable agronomic strategies to ‘close the yield gap’ in each zone. This site was established in 2022 and monitored for a second year in 2023 to measure legacy effects of different nutrient packages. The second site was set up in 2023 and sought to build on 2022 results by further exploring nitrogen demand and attainable yields in two different paddock zones.
Method
Coomandook year 1
Two tillage-based soil amelioration treatments were contrasted against an unmodified control: topsoil inversion to 350mm depth (Plozza Plow, conducted on the day of sowing; the soil was at field capacity following rain); or chisel ploughing to 550mm depth with topsoil dilution from sublayer lifting (Bednar Terraland, conducted in dry soil 10 weeks prior to sowing, including 5 weeks of surface consolidation via grazing). Treatments were applied in strips 24m wide and 850m long, separated by controls; both tillage strips were rolled just before sowing using a 1.5m diameter straight-rib roller.
Commodus barley (medium coleoptile length) was sown on 22nd June 2022 at 73kg/ha using the following techniques.
- Furrow seeding: John Deere 1870 Conserva-Pak (30cm row spacing) operated at 8.5km/h, set for 3cm seeding depth in the control area and kept the same across the ripped/ploughed strips to monitor their impact.
- Seed broadcast: An additional 50kg/ha of seed was broadcast pre-seeding to 20m x 12m subplots over both tillage strips in an exposed section of a deep sandy rise. The broadcast seeds were then incorporated by the seeder during the sowing pass.
Sowing depth and crop establishment were recorded for both rear and front seeder rows (replicated x 3). Grain yield was measured using a plot harvester for each tillage type (replicated x 3).
Coomandook year 2
A small plot trial was sown across the Plozza, control and Bednar strips on 9 May 2023 in a semi-randomised split plot design, replicated three times. Three sowing rates of 44Y94CL canola (162 200 seeds/kg) were used: 1.6kg/ha, 2.8kg/ha and 4.0kg/ha, targeting plant populations of 20, 35 and 50 plants/m2 respectively, assuming 96% germination and 80% field emergence. Two nutrition strategies were applied to split plots: baseline nutrition, reflecting district practice (target yield of 1.8t/ha) and improved nutrition that was designed to accommodate the economic water limited yield potential of 2.3t/ha (Table 1), a target supported by pre-sowing soil test data.
Table 1: Nutrition treatments applied at Coomandook in canola in 2023. Nitrogen (N) was supplied as urea at three different timings, phosphorus (P) as MAP, potassium (K) as muriate of potash and copper (Cu) as fluid copper sulphate, banded below the seed. Note, sulphur (S) was supplied across the whole site pre-sowing as gypsum (800kg/ha = 100–110kg/ha of S).
Treatment | N kg/ha | P kg/ha | K kg/ha | Cu kg/ha | |||
|---|---|---|---|---|---|---|---|
Sowing | 1–4 leaf | Early stem elongation | Total | ||||
Baseline | 8 | 40 | 46 | 94 | 16.4 | 10 | 0 |
Improved | 30 | 80 | 40 | 150 | 16.4 | 15 | 1 |
Sherwood a, 2022 and 2023
Two identical small plot trials were sown across a delved flat and clay spread hill that had both been spaded in 2020. Nutrition treatments were designed to reflect district practice or to accommodate the economic water limited yield potential of 3.9t/ha (Table 2).
Table 2: Nutrition treatments applied to wheat at Sherwood in 2022.
Treatment | Nutrients supplied (kg/ha) from fertiliser | |||||
|---|---|---|---|---|---|---|
# | Name | N | P | K | S | Cu |
T1 | Nil fertiliser | 0 | 0 | 0 | 0 | 2 |
T2 | District practice | 100 | 18 | 0 | 11 | 2 |
T3 | T2 + N | 200 | 18 | 0 | 11 | 2 |
T4 | T2 + P | 100 | 27 | 0 | 11 | 2 |
T5 | T2 + K | 100 | 18 | 20 | 11 | 2 |
T6 | T2 + N + P + K shallow | 200 | 27 | 20 | 11 | 2 |
T7 | T2 + N + P + K deep | 200 | 27 | 20 | 11 | 2 |
Nutrients were supplied in either of two positions: banded with and below the seed (shallow); or banded with, below the seed and at 15–20cm (deep). Scepter wheat was sown on 24 May 2022 and the trials were oversown with 44Y94CL canola on 26 May 2023. In 2023, all plots received the same nutrient package to test the legacy effects of 2022 fertiliser additions.
Sherwood b, 2023
Two identical small plot trials were sown across a delved flat and clay spread sandhill that had both been spaded in 2021. Nitrogen rates of 0kg/ha, 50kg/ha, 75kg/ha, 100kg/ha, 125kg/ha, 150kg/ha and 200kg/ha were tested, along with a treatment allowing for starting soil N and K status, supplying 75kg N/ha and 20kg K/ha on the delved flat, and 125kg N/ha and 20 kg K/ha on the clay spread hill. The trials were sown to RockStar wheat on 26 May 2023.
Results and discussion
Crop establishment after amelioration at Coomandook, 2022
Average sowing depth in the control was 50mm (Table 3) and the crop established at 120 plants/m2 (71% of seed sown; Table 4). The seeder front rows were 9mm deeper than the rear rows due to soil throw. Under the Bednar Terraland treatment, which was consolidated by grazing prior to sowing, the sowing depth was similar (59mm), with no impact on crop establishment. Conversely, under the Plozza disc treatment, which still had a soft seedbed post-rolling, the sowing depth was strongly affected by seeder sinkage and excessive soil throw. The greatest impacts were measured on the seeder front rows (+94mm), leading to a reduction in plant population (-19 plants/m2). Even more plant losses would be expected if a shorter coleoptile variety and pre-emergence herbicides had been used.
Table 3: Barley seeding depth (mm) at Coomandook in 2022 by treatment and seeder row position.
Seeder row position | Unmodified control | Plozza | Bednar | |||
|---|---|---|---|---|---|---|
mean | s.e. | mean | s.e. | mean | s.e. | |
Rear row | 45.3 | 4.2 | 78.4 | 7.8 | 52.7 | 6.0 |
Front row | 54.1 | 6.4 | 148.0 | 13.0 | 65.3 | 8.4 |
Average depth | 50 | 5.3 | 113 | 10.4 | 59 | 7.2 |
Seed broadcasting combined with seeder sowing added an extra 41 plants/m2 on the Bednar plots (Table 4) and an extra 34 plants/m2 in Plozza plots and displayed greater protection during a high wind event in August that caused substantial drift damage in surrounding areas.
Table 4: Year 1 barley crop establishment (plants/m2) at Coomandook.
Seeder sowing | Unmodified control | Plozza | Bednar | |||
|---|---|---|---|---|---|---|
mean | s.e. | mean | s.e. | mean | s.e. | |
Rear row p/m2 | 113 | 4.9 | 115 | 6.2 | 113 | 9.6 |
Front row p/m2 | 127 | 5.7 | 108 | 6.2 | 140 | 4.4 |
Average p/m2 | 120 | 5.3 | 112 | 6.2 | 126 | 7.0 |
% seed rate | 71% | - | 66% | - | 74% | - |
Combined seeder + broadcast sowing | ||||||
Mean row p/m2 | - | - | 123 | 5.8 | 121 | 3.1 |
Inter row p/m2 | - | - | 23 | 3.3 | 46 | 2.7 |
Average p/m2 | - | - | 146 | 4.6 | 167 | 2.9 |
Optimised year 2 agronomy at Coomandook
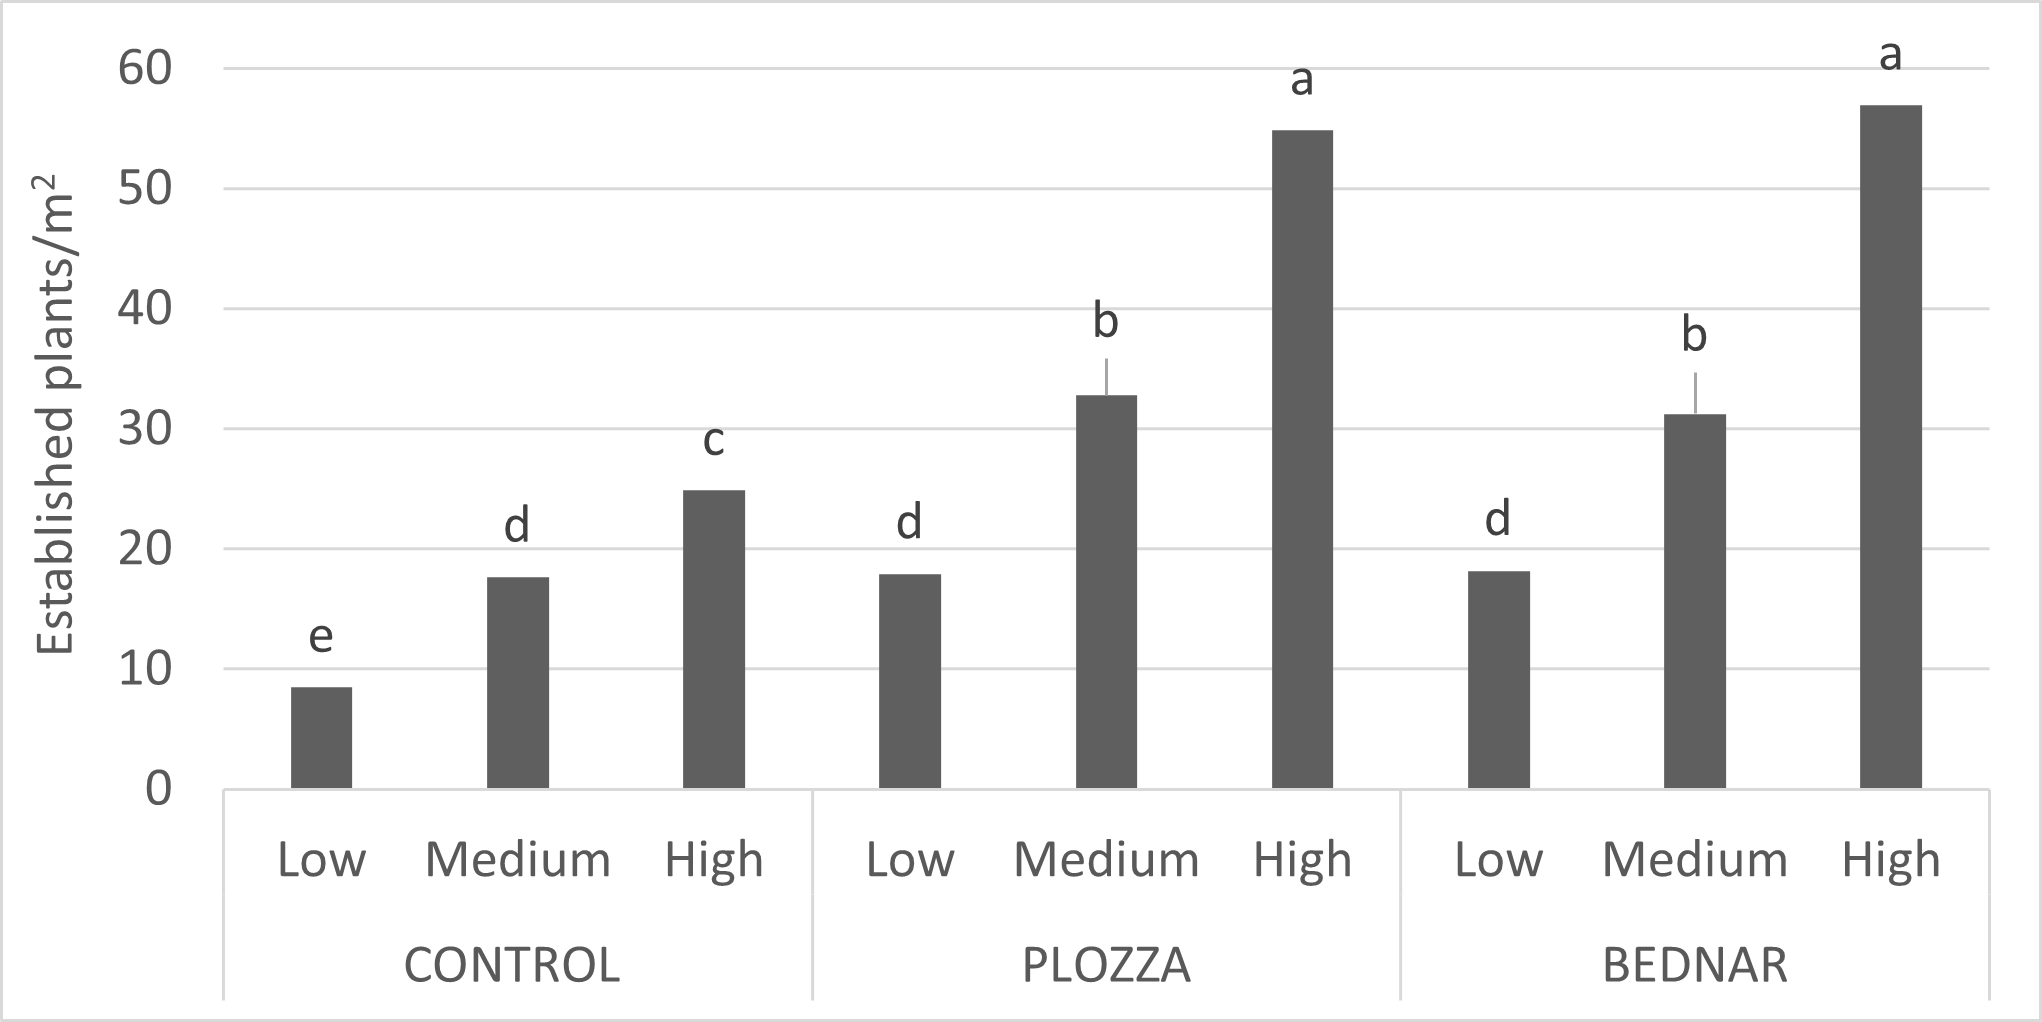
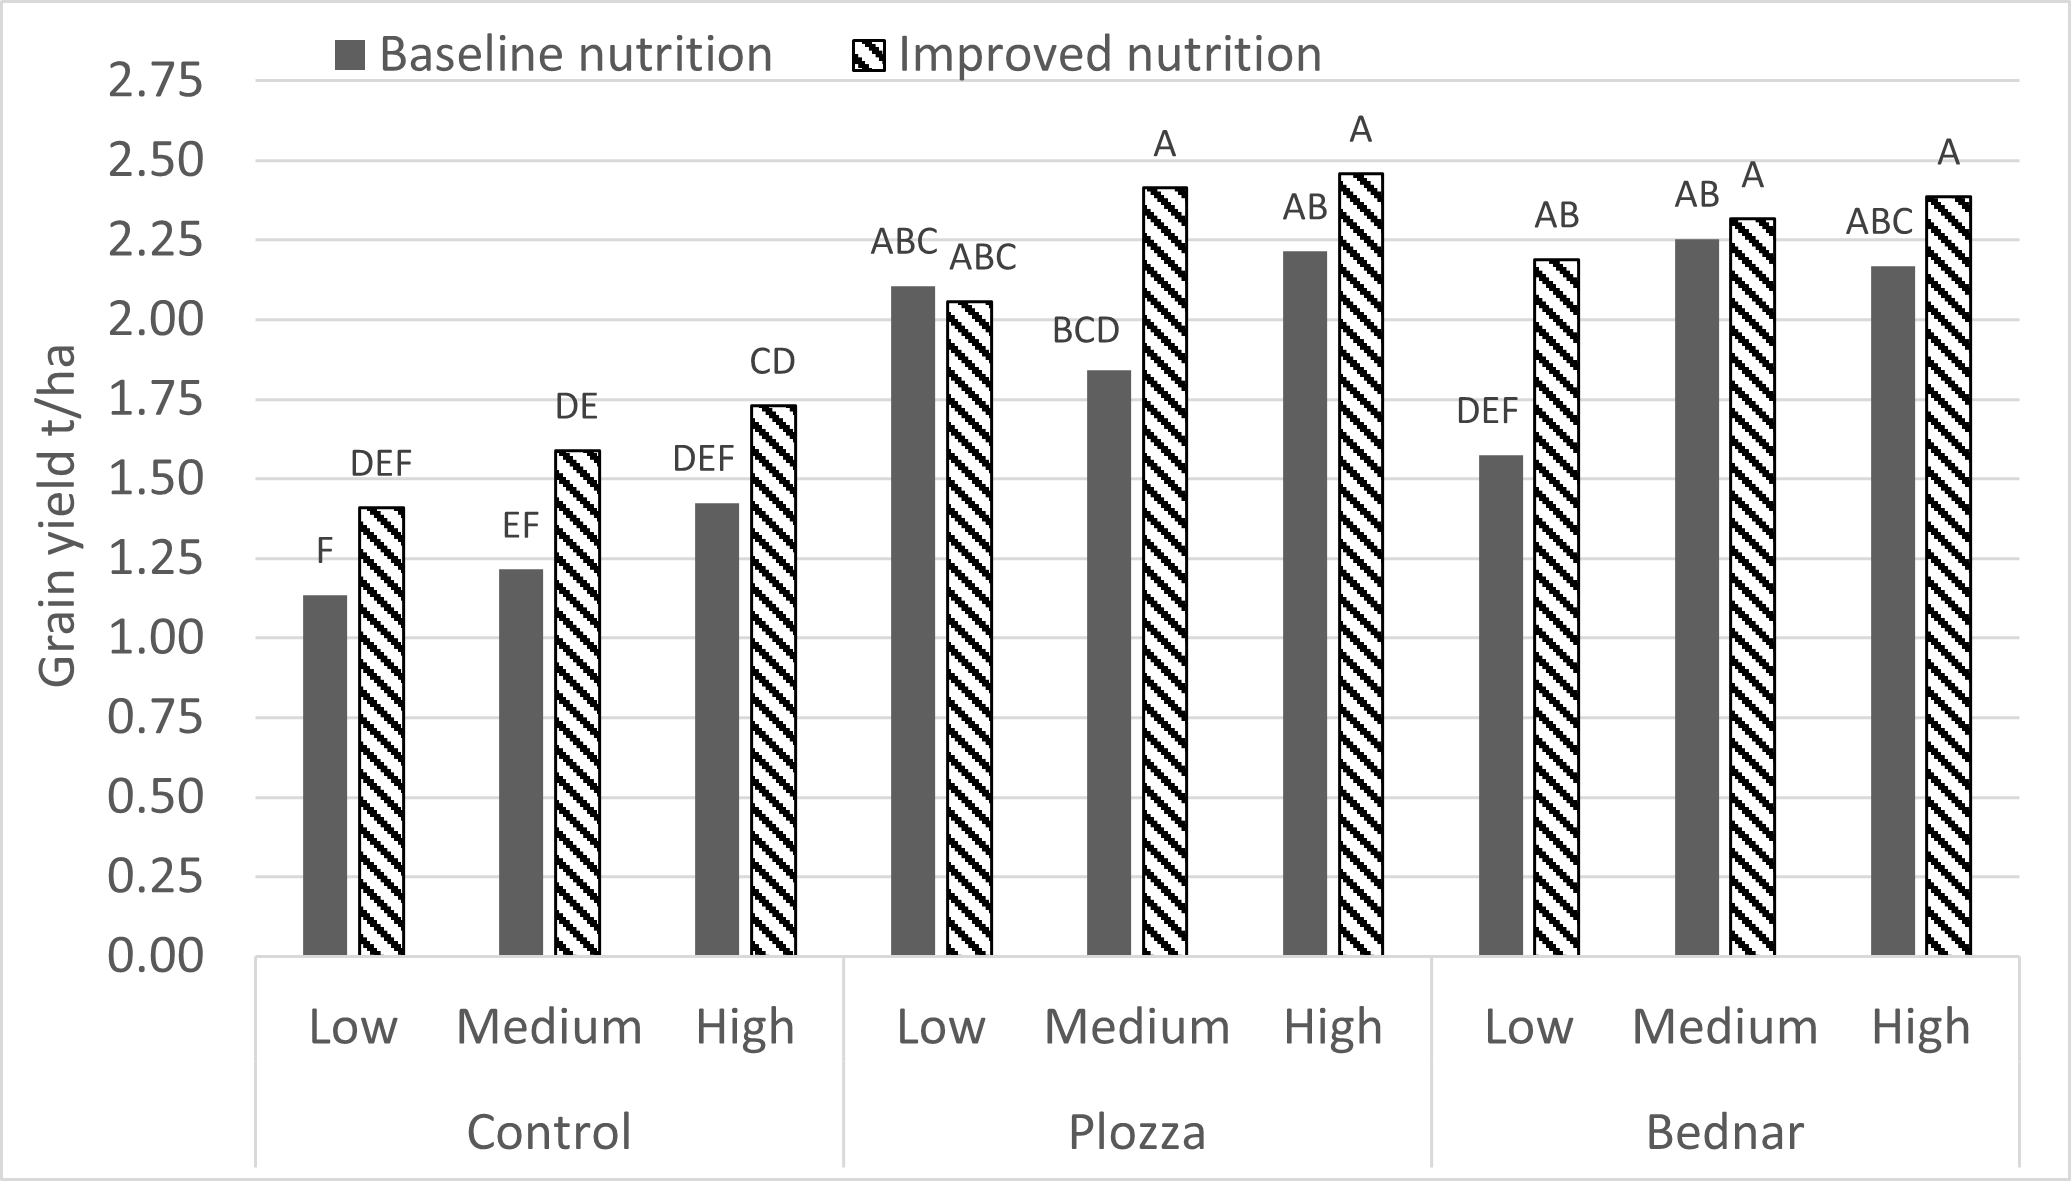
Treating water repellence at Coomandook via inversion or chisel ploughing in 2022 resulted in average canola plant populations of 18 plants/m2, 32 plants/m2 and 56 plants/m2 in 2023, for the low, medium and high sowing rates respectively (Figure 1), achieving 72%, 73% and 90% field establishment. In contrast, the unmodified control only achieved 34–40% field establishment, with populations of 9 plants/m2, 18 plants/m2 and 25 plants/m2 for the low, medium and high sowing rates respectively. Even with the highest sowing rate of 4kg/ha, the target plant population of 35 plants/m2 was not achieved and produced only 1.43t/ha of grain with district practice agronomy, improving to 1.73t/ha of grain with extra N and K applied (Figure 2).

Figure 1. Canola crop establishment at Coomandook in 2023 for each tillage type and sowing rate (low=1.6kg/ha, medium=2.8kg/ha, high=4kg/ha), showing higher sowing rates are needed to achieve the target plant population (dashed line) when water repellence is present (control). Letters denote significance (p<0.001, Lsd=6.2).

Figure 2. Canola grain yield at Coomandook in 2023 for each tillage type, sowing rate (low, medium and high, as per Fig. 1) and nutrition strategy (solid columns = baseline nutrition, N@93kg/ha; dashed columns = improved nutrition, N@150kg/ha). Letters denote significance (p<0.05, Lsd=0.40).
The improved nutrition treatments performed the most consistently across the Plozza and Bednar treatments, yielding 2.3t/ha on average (0.3t/ha above the district practice at 2.0t/ha; Figure 2). There was no benefit to increasing the sowing rate >2.8kg/ha. These results show that sowing rates can be substantially reduced when water repellence is treated and that yields can be improved, even with plant populations <20/m2. At $35/kg for the latest hybrid seeds, lower seeding rates can deliver substantial savings.
Nutrition response – Sherwood a 2022 and 2023
Nitrogen was the major driver of wheat yield responses to nutrition additions in 2022, achieving an average of 4.5t/ha on the delved flat and 3.9t/ha on the clay spread hill for all treatments that contained 200kg N/ha, more than 1.3t/ha better than the district practice treatment (3.1t/ha and 2.6t/ha respectively; Table 5). Canola yields in 2023 were also consistently improved by the extra N applied in 2022, achieving 3.9t/ha and 3.2t/ha, more than 1t/ha better than district practice. There was no response to extra P or K fertiliser in either location.
Table 5: Wheat (2022) and canola (2023) yields (t/ha) at Sherwood, showing higher yields on the delved flat than on the clay spread hill in both years. A different letter in the Lsd group indicates a significant difference between treatments.
Treatment | Delved flat | Clay spread hill | ||||||
|---|---|---|---|---|---|---|---|---|
Wheat 2022 | Canola 2023 | Wheat 2022 | Canola 2023 | |||||
Yield | Lsd group | Yield | Lsd group | Yield | Lsd group | Yield | Lsd group | |
Nil fertiliser | 1.62 | a | 0.88 | a | 1.17 | a | 0.98 | a |
District practice | 3.12 | b | 2.61 | b | 2.87 | b | 2.19 | b |
T2 + N | 4.36 | c | 3.73 | c | 3.78 | c | 3.17 | d |
T2 + P | 3.49 | b | 2.85 | b | 3.01 | b | 2.52 | c |
T2 + K | 3.03 | b | 3.16 | bc | 2.98 | b | 2.49 | c |
T2 + N + P + K shallow | 4.62 | c | 3.66 | c | 3.94 | c | 3.21 | d |
T2 + N + P + K deep | 4.37 | c | 3.65 | c | 3.86 | c | 3.23 | d |
P Value | <.001 | - | <.001 | - | <.001 | - | <.001 | - |
Lsd (0.05) | 0.55 | - | 0.73 | - | 0.32 | - | 0.27 | - |
Nitrogen response – Sherwood b 2023
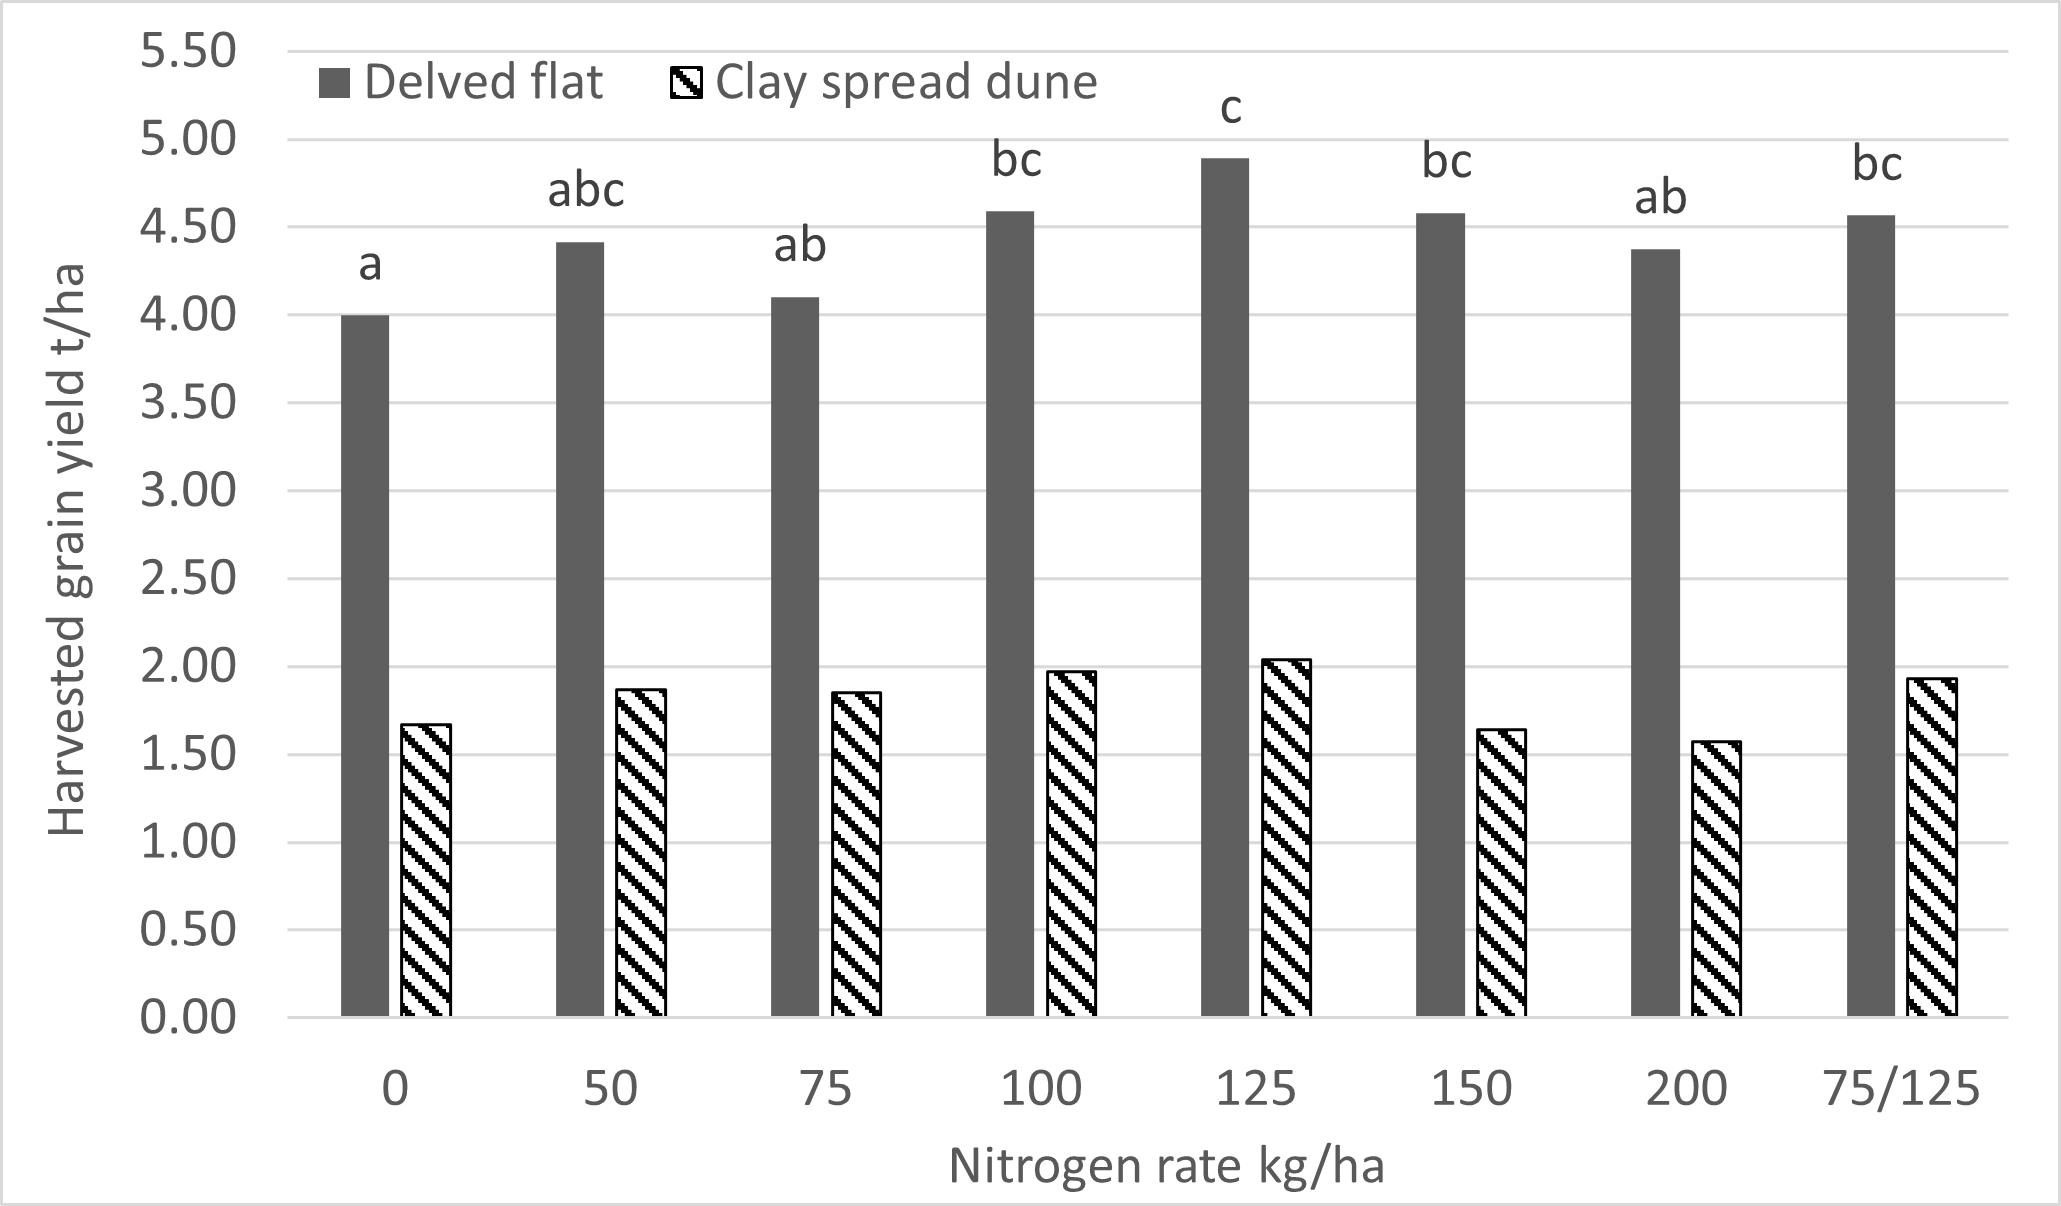
Wheat at Sherwood in 2023 yielded 4t/ha on the delved flat and 1.7t/ha on the clay spread hill with no N fertiliser applied, following beans in 2022 (Figure 3). The crop on the hill suffered severe moisture stress in late spring and no N response was recorded. Down on the flat however, yields were improved by >0.5t/ha with the addition of 100kg N/ha and maximised at 125kg/ha, resulting in improved grain quality via higher protein (Table 6). Although screenings were elevated, particularly for N rates >150kg/ha, all N treatments achieved a grade of AUH2. There was no benefit to grain yield by applying more than 125kg N/ha, but the data presented above (Sherwood a) show that residual N may benefit subsequent crops.
Results from these trials confirm that yields can be improved by matching N additions to water limited yield potential and starting soil chemistry, but that yield gaps still exist between different soil types/zones both spatially and temporally, even after amelioration. Adopting strategic zone-based soil sampling and variable rate fertiliser technology is the next step to enhance grain yields and optimise economic returns after amelioration.

Figure 3. Wheat grain yield (t/ha) at Sherwood in 2023 in response to increasing rates of nitrogen fertiliser. Solid columns = delved flat; dashed columns = clay spread dune (not significant). Letters denote significance (p<0.05, Lsd=0.5).
Table 6: Grain quality at Sherwood in 2023 for different nitrogen (N) application rates.
Treatment kg N/ha | Test Weight kg/hl | Protein | Screenings | Receival grade | ||
|---|---|---|---|---|---|---|
% | Lsd group | % | Lsd group | |||
0 | 77.03 | 11.3 | a | 6.0 | a | AGP1 |
50 | 77.48 | 12.7 | b | 8.6 | bc | AUH2 |
75 | 77.52 | 13.0 | bc | 7.3 | ab | AUH2 |
100 | 76.79 | 13.3 | bcd | 7.4 | ab | AUH2 |
125 | 77.65 | 13.7 | cd | 7.9 | abc | AUH2 |
150 | 76.64 | 13.7 | cd | 8.9 | bc | AUH2 |
200 | 77.26 | 13.9 | d | 9.3 | c | AUH2 |
75N + 20 K | 77.79 | 13.1 | bc | 7.5 | abc | AUH2 |
P Value | 0.338 | <.001 | - | 0.045 | - | - |
Lsd (0.05) | NS | 0.8 | - | 1.9 | - | - |
Conclusion
Crop establishment can be improved following amelioration by adequately consolidating the seed-bed pre-sowing, which reduces seeder sinkage and excessive soil throw. Combining seed broadcasting with in-row seeding in vulnerable paddock zones can increase early ground cover and reduce in-crop wind erosion risks. Options to ‘spade and sow’ in one pass or broadcast seeds pre-spading also exist to minimise soil erosion risks and these techniques have been shown in other projects (CSP1606-008RMX) to achieve uniform crop establishment where there is moisture within the soil profile.
When amelioration of water repellence is successful, sowing rates can be reduced, with substantive seed cost savings and no penalty to grain yield, providing adequate nutrition is supplied to meet the new crop potential. Nitrogen has proven to be the major driver of yield responses after amelioration.
Despite successful amelioration of constraints (clay spreading, delving, spading), attainable yields are rarely consistent across different paddock zones, both spatially and temporally, hence zone-based approaches to soil sampling and in-crop nutrition are still needed to achieve potential yields in different soil types and topography.
Acknowledgements
The research undertaken as part of this project is made possible by the significant contributions of growers through both trial cooperation and the support of the GRDC, the authors would like to thank them for their continued support. We particularly would like to thank the Jaeschke and Pfitzner families along with agronomists Matt Howell and Adam Hancock.
References
Desbiolles J, Fraser M, Pearce A, Ludwig I, Johnson T (2023)Optimising crop establishment on freshly ameliorated sand – Coomandook trial 2022 results. MacKillop Farm Management Group Annual Results Book
Fraser M, Pearce A, Ludwig I, Johnson T, Desbiolles J (2023) Closing the yield gap after sandy soil amelioration – Sherwood trial 2022. MacKillop Farm Management Group Annual Results Book
Contact details
Melissa Fraser
Soil Function Consulting
Naracoorte SA
0407 773 369
mel@soilfunction.com.au
@Mel_Fraser1
GRDC Project Code: MFM2106-001RTX,
Was this page helpful?
YOUR FEEDBACK
