Taking the lab to the field
Taking the lab to the field
Author: Peter Johnston (Hone Corporation) | Date: 06 Feb 2024
Take home message
- Agricultural producers need accurate, reliable real time data to support better management decisions.
- Rapid on-farm sampling can enable production decisions to be optimised, ensuring farm enterprises reap the economic benefit of the quality that they produce.
- Advances in Machine learning provides in spectroscopy, create the opportunity for hardware developments and design that allow infield applications
- Further creation of models for pasture quality, tissue testing (macro- and micronutrients) will further enhance the economic value of in-field application of Near Infra-Red spectroscopy.
Background
Australia’s on-farm grain storage has exceeded 18m tonnes, with 90% of growers storing an average of 41% of normalised grain production (GRDC 2021 – ‘boosting the efficiency of on farm storage’). The catalyst for this has been a combination of increased domestic demand (local market), increased mechanisation (header throughput), tax incentives to support grower’s drought resilience and accelerated asset depreciation.
This seismic shift has required grain producers to act as the first mile of the supply chain, where quality attributes of grain need to be tested, validated, and monitored to ensure the resilience of Australia’s access to international and domestic markets.
Concurrently, wheat producers are harnessing the value of their production through segregating grain to optimise its quality, both at point of initial storage and then subsequent out loading. Industry figures indicate that the average farmgate value through the correct segregation of wheat can nett between 1–2%.
These structural changes have required grain producers to adopt technology akin to what a bulk handler has for the testing and subsequent management of grain quality. Recognising this, Hone Corporation has developed a field-based spectrometer for the testing of cereal grain protein and moisture called Hone Lab Red. This initial use case has led to Hone developing a range of spectral models for soil, leaf, and feeds to provide the core data that agricultural producers need in real time.
The challenge
Agricultural producers require timely and accurate data to make decisions. Laboratory facilities are typically located a long way from where the samples are taken. This has limited producers’ ability to make timely decisions at harvest for grain segregation. This created a dependency of producers to rely on access to bulk handlers’ desktop-based testing equipment.
Testing grain quality through the application of NIR (Near Infrared) spectroscopy has been widely practiced and forms the mainstay of grain testing in Australia (Walker et al. 2023). These desktop instruments require extremely specific environmental conditions to operate within tolerances required by industry. Models and calibrations are stored locally on each instrument and require regular and ongoing servicing and calibrations. These instruments typically cost between $35K to $45K.
The science
In the last decade, the development of portable spectrometers has enabled the technology to move on-farm (Yan et al. 2023). With the rise of on-farm storage and increased climatic variability, portable instruments are increasingly in demand (Walker et al. 2023). The portable instrumentation offers farm managers a high degree of throughput, versatility, and simplicity to quantify a range of analytes in their crop (Du et al. 2022).
Concurrently, there has been an increase in computing power and efficient learning algorithms (Chadalavada et al. 2022). This has enabled the development of user-friendly software applications that move the technology out of the hands of researchers and into the hands of growers (Yan et al. 2023). As a result, growers can now rapidly classify the market value of grain to optimise economic return and minimise production risk at the farmgate (Walker et al. 2023).
Understanding the limitations of adoption
Spectroscopy is well established as a methodology for testing grain analytes. In Australia, most grain producers will be familiar with NIR spectrometers utilised for testing cereal grain protein and moisture. But the application is not limited to just cereal grain, nor protein and moisture. Spectroscopy is used in over dozens of industries.
The opportunity presented across three areas:
- All samples start in the field; why not take the laboratory to the field?
- Many analytes can be measured by NIR; why not design and develop technology that can span across multiple applications?
- Traditional methodologies for building models and calibrations required chemometricians with specific skills, limiting the development of new applications; why not use machine learning (ML) and artificial intelligence (AI) to bridge this constraint?
Guiding principles
Hone developed a view that anyone should be able to test anything, anywhere. It was identified that agricultural producers have one of the highest needs by frequency and volume of analyte testing from pre-production (soil), in crop (plant tissue) to post-production (grain and fodder). However, testing remained at low levels due to cost and accessibility.
The solution needed to satisfy the constraints that producers faced.
- The technology needed to be mobile first, designed for field use in agriculture.
- Test results needed to be available as close to near real time as possible.
- Analytes to be tested should be narrowed to those for which decisions can be made that provide tangible economic and agronomic benefits.
Challenges to be overcome
To build models to measure specific analytes, there was a requirement for vast amounts of spectral data to be assessed against wet chemistry results. This data was difficult to acquire and typically required skilled chemometricians to assess and validate the data to build the models. This led to the realisation that we needed a methodology of capturing and analysing spectral data at a resolution and speed that would circumvent the technical knowledge of a chemometrician. To do this, we developed Hone Create, a cloud-based ML engine that has been specifically designed and engineered to create extraordinarily complex models and calibrations.
This enabled Hone to:
- Design, engineer and produce a handheld spectrometer specifically for infield agricultural applications
- create models and calibrations extremely quickly from less samples utilising the processing depth of the cloud
- develop a self-learning validation process to ensure model performance
- deploy enhanced models to the cloud for all devices to utilise
- focus the instrument spectral capture range to that of the target analyte, resulting in higher resolution and model performance.
Applications and outcomes
Cereal grain
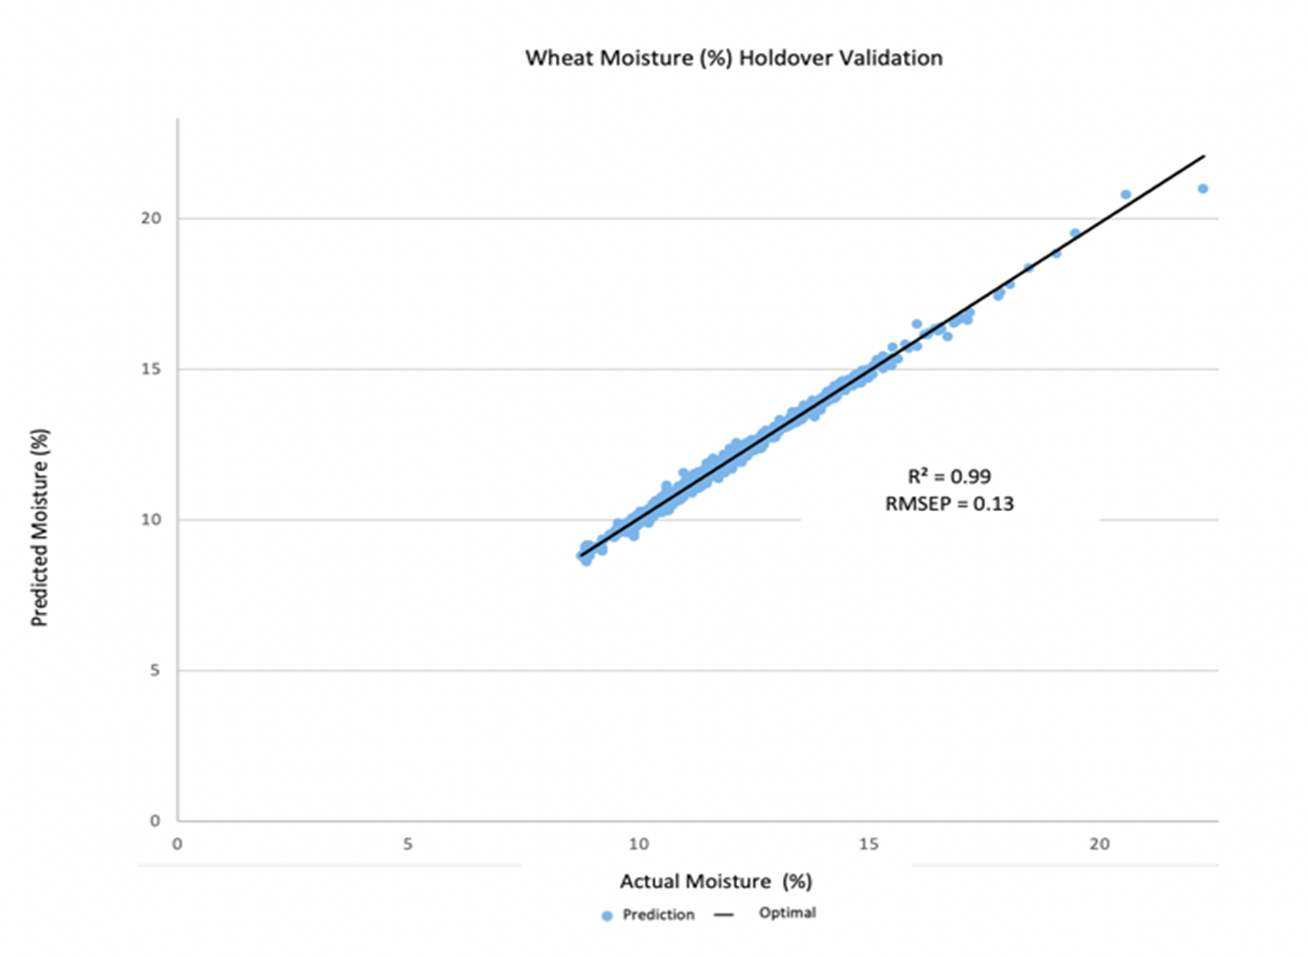
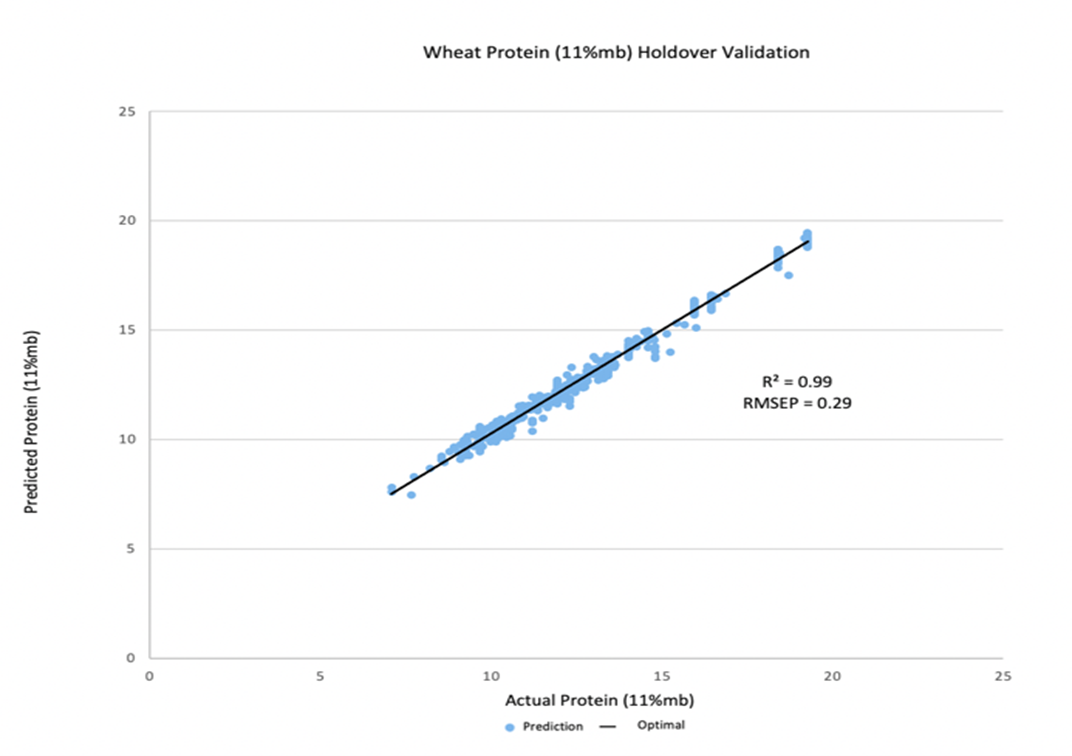
Displayed in below are Hone’s resulting models for wheat grain. For wheat, the total number of samples scanned was 476 for protein and 1576 for moisture (Figure 1) across multiple varieties in a composite sample resulting in an R squared value of 0.99 for moisture and in Figure 2 we can demonstrate a R squared value of 0.99 for protein. The ‘predicted’ axis represents samples that were scanned on Hone’s HLR1A device (hone’s handheld spectrometer), whereas the ‘actual’ axis represents samples that were from a NATA accredited analytical reference lab.

Figure 1. Wheat moisture predictive model.

Figure 2. Wheat protein predictive model.
Feed grain
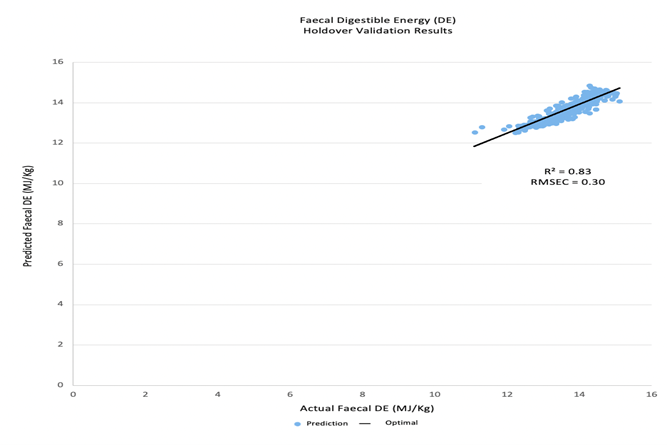
Displayed in Figure 3 are Hone’s models for ‘feed grade grain’. Within the holdover validation set, there were 356 samples for the faecal digestible energy model and 314 samples for the illeal digestible energy model (Figure 3). The ‘predicted’ axis represents the samples scanned on the HLR1A device, produced by Hone, whereas the ‘actual’ axis represents samples that were from a NATA accredited analytical reference lab from in-vivo experiments.

Figure 3. LHS; Faecal digestible energy (MJ/kg) cross validation results.
Economics
Decisions on what silo / location to store wheat enables wheat producers to extract value from the quality (Protein) of the grain that they produce. As wheat in Australia is priced through Grain Trade Australia (GTA) standards, there is the opportunity to blend grain on farm to maximise its value within this grade structure. Decisions on segregating wheat quality load by load on farm prior to storage typically results in an overall increase in the value of their production by greater than 0.5%.
The table below highlights how a 1500 tonne wheat producer, making informed segregation decisions can achieve a 0.5% increase in farmgate values based on 1:10 upgrade ratio (conservative).
On-Farm wheat segregation
Table 1. The annualised cost of the Hone Lab Red is $2450 (+GST) per annum, resulting in a nett ROI of over 70% per annum. The additional value of being able to assess cereal grain for feed quality will open further opportunities for producers and consumers of feed grain.
Grade | Price (Murtoa) | Quantity (t) | Value | % Upgrade | Quantity (t) | Value | Delta Value |
|---|---|---|---|---|---|---|---|
ASW | $ 320 | 500 | $ 160,000 | 10% | 475 | $ 152,000 | -$ 16,000 |
APW | $ 337 | 500 | $ 168,500 | 10% | 500 | $ 168,500 | $ - |
H2 | $ 375 | 500 | $ 187,500 | 10% | 500 | $ 187,500 | $ - |
HI | $ 405 | $ - | 50 | $ 20,250 | $ 20,250 | ||
Total | $ 344 | 1500 | $ 516,000 | 1500 | $ 518,125 | $ 4,250 |
References
Chadalavada K, Anbazhagan K, Ndour A, Choudhary S, Palmer W, Flynn JR, Mallayee S, Pothu S, Prasad KVSV, Varijakshapanikar P, Jones CS, Kholová J (2022) NIR instruments and prediction methods for rapid access to grain protein content in multiple cereals. Sensors22(10), 3710. doi:10.3390/s22103710.
Du Z, Tian W, Tilley M, Wang D, Zhang G, Li Y (2022) Quantitative assessment of wheat quality using near‐infrared spectroscopy: a comprehensive review. Comprehensive Reviews in Food Science and Food Safety 21(3), 2956-3009. doi:10.1111/1541-4337.12958.
Miskelly DM (2019) Analytical testing to support Australian wheat export quality
Walker CK, Assadzadeh S, Wallace AJ, Delahunty AJ, Clancy AB, McDonald LS, Fitzgerald GJ, Nuttall JG, Panozzo JF (2023) Technologies and data analytics to manage grain quality on-farm – a review. Agronomy 13(4), 1129. doi:10.3390/agronomy13041129.
Yan H, De Gea Neves M, Noda I, Guedes GM, Silva Ferreira AC, Pfeifer F, Chen X, Siesler HW (2023) Handheld near-infrared spectroscopy: State-of-the-art instrumentation and applications in material identification, food authentication, and environmental investigations. Chemosensors 11(5), 272. doi:10.3390/chemosensors11050272.
Contact details
Peter Johnston
Hone Corporation
pj@honeag.com
Date published
February 2024
