The 2023 seasonal outlook – were the models right or wrong?
Author: Dale Grey (Agriculture Victoria, Bendigo) | Date: 20 Feb 2024
Take home messages
- Trade wind activity in 2023 was not enough to get El Niño to form until later in the season.
- A strong positive IOD did form in August and probably did influence late winter and early spring dryness.
- Ocean temperatures around northern Australia refused to cool off, creating large amounts of moisture which were fed into south-eastern Australia during spring and harvest.
- Early predictions of El Niño and +IOD in 2023 were well versed in potential given the deep ocean conditions at that time, but do not guarantee the phenomena following through.
- Caution should always be exercised when using forecasts in autumn.
Climate drivers and El Niño predictions
El Niño, La Niña, positive IOD and negative IOD are phenomena coupled to the ocean atmosphere. When these events are mature and in full swing, the ocean temperatures at the surface and at depth, the winds, cloud and pressure patterns across the equator all have distinctive and characteristic behaviour. For each climate driver to be fully functional and capable of delivering the classic climatic effects, each of these five characteristics needs to be present and when they aren’t, then uncertainty arises as to what might occur.
There was much talk throughout 2023 about a possible El Niño, in fact, it started as early as February. Climate models were emphatically sniffing a potential event in the wind. The problem was, at that time of the year, models are notoriously inaccurate at predicting such events. We have seen similar model excitement about El Niño or La Niña in the autumns of 2014 (El Niño), 2016 (La Niña), and 2017 (El Niño). Each of these failed to fire once the season progressed into winter. The reasons for this are varied, but common to the autumn season in all years, is the fact that the world’s tropical oceans are reverting from what they have been in summer or spring the previous year to a period of normality. In autumn, it is rare to have a tropical climate driver like the El Niño Southern Oscillation (ENSO) or the Indian Ocean Dipole (IOD) in action - the 2015 El Niño was a rare exception, as it was fully formed in late May.
So how are models even coming up with these predictions? In almost all cases, the main signal of a possible climate driver’s formation comes from the deep ocean. The existence of colder or warmer water to depth in key regions around the equator in some years indicates the increased possibilitythat these phenomena could form. Whether this water arises to the surface and manifests itself as a climate driver often comes down to surface wind activity to kick things off. Much of this wind activity occurs due to tropical weather, with a predictability timeframe of seven days or less. Sometimes this change of wind starts the progression of water movement to the surface and sometimes it simply fails to fire up. The earlier the pre signal in the deep ocean occurs in autumn, the more time there is for the winds to change, so sometimes models eventually get things right after many months of nothing happening. In the three years when the predictions failed (indicated earlier), reversed trade winds around the Solomon Islands did not occur for the El Niños, and stronger trade winds across the Pacific failed to intensify for the La Niña. The 2015 El Niño was different in that the winds reversed strongly in early autumn and continued for the rest of the season, maintaining the El Niño.
What happened in 2023?
2023 followed three La Niña events in the previous years, which has only happened three times previously. When the triple La Niña’s occurred in the past, an El Niño has formed in either the first or second following year, and it appears that La Niñas prime the ocean for El Niño soon after. The La Niñas prior to 2023 had produced a lot of surface and undersea heat in the western Pacific, and every climate model was predicting the warm water to make a transition over to the South American coast and form an El Niño.
The trade winds which had been strong since mid-2022 finally relaxed in March, and this warmed the undersea ocean which started to appear at the surface off South America in the space of six weeks. In mid-June, the central region of the Pacific (scientist’s title NINO3.4) finally achieved the El Niño threshold of 0.8oC warmer than normal. Almost immediately, the pressure increased at Darwin and decreased at Tahiti in the South Pacific, and hence, the Southern Oscillation Index (SOI) went strongly negative below a value of -8.0. This indicated the pressure patterns around the equator were showing El Niño behaviour. We then had three of the five key characteristics of an El Niño, but increased cloud at the dateline and reversed trade winds in the western Pacific remained elusive.
This continued until mid-September when the Bureau of Meteorology declared an El Niño was underway, after the fourth El Niño characteristic commenced. Classic El Niño’s exhibit reversed trade wind activity from a westerly direction off the Solomon Islands. This causes two things to happen: it pushes the warm water pool over towards the central Pacific, and cooler water upwells to the north of Australia to replace it. This has the effect of reducing evaporation and cloud formation north of Australia and causing greater cloud to accumulate around the junction of the International Date Line with the Equator. The reversed winds also calm the central Pacific Ocean surface, allowing the sun to heat it up further. In 2023, reversed trade winds took until November to occur. However, they were still short-lived, returning to normal in December, demonstrating that the ocean and atmosphere were not fully coupled.
Coral Sea temperatures were close to record highs for almost 12 months until mid-2023, evaporating large amounts of moisture into the atmosphere, and resulting in record amounts of rainfall in Qld, NSW, Victoria, Tasmania and New Zealand. The Coral Sea remained warm, eventually returning to normal, but this was ‘the bogey’ in the climate predictions. Without the reduction in Coral Sea temperatures as a result of reversed trade winds, it was hard to see how a drying effect could occur from the Pacific Ocean and an El Niño drought. During late spring and early summer 2023, conditions in the Coral Sea were such that large volumes of moisture in the atmosphere were fed over south-eastern Australia as low-pressure troughs or systems.
Over in the Indian Ocean in early autumn 2023, sea temperatures were cooler than average off Sumatra and warmer than average off Africa to depth. The models were all predicting a +IOD, but once again, this was only a pointer that a +IOD was possible, but not guaranteed. Yet again, random weather derived winds would be the key. In June, the conditions had flipped with the overarching pattern looking more negative IOD than not. After much uncertainty, a large high pressure off system Western Australia sent stronger northwest winds off the Kimberly coast, pushing cooler water towards Sumatra in July - this was a new mechanism of +IOD formation I had not seen before.
A fully coupled +IOD formed in August and persisted until December 2023, but dry conditions started from June through to September before and after formation. This has been observed in the past. The pressure conditions that lead to a positive IOD also led to dry conditions. The event itself proved to be very strong in terms of; its difference in temperature between east and west; the massive lack of cloud emanating west of Sumatra; the very strong easterly winds pushing warmer water to the African coast; and the higher pressure over Sumatra and lower off Africa. There was one defining difference though - the cooling was very much situated west of Sumatra.
Previous positive IODs have usually developed large areas of cold water from Broome around to Brisbane, which usually decreases the moisture sources in the northwest. As was the case with the Coral Sea, the lack of cool water developing in the Timor Sea was a defining feature different to previous events that led to uncertainty with predictions of an El Niño drought. The flukey October rain that finished off two thirds of Victoria’s crops beautifully, sourced some of its moisture out of the Indian Ocean which was very unusual for a positive IOD. September was a transition from the high-pressure dominance during August and the low-pressure troughs during October that allowed moisture down into Victoria.
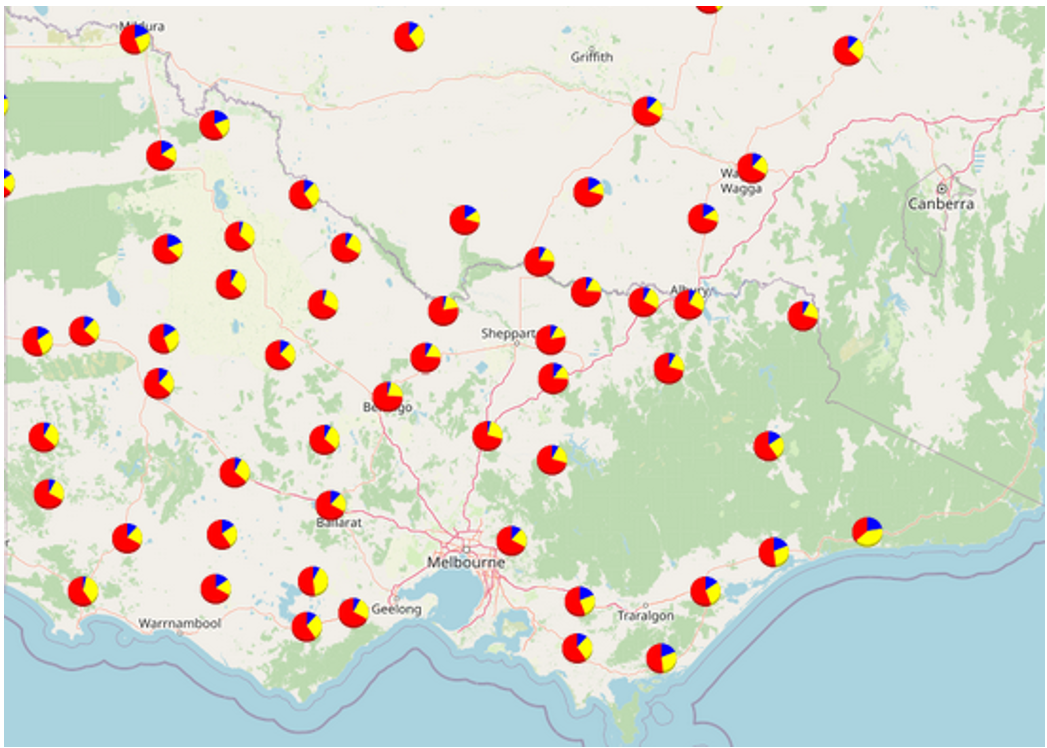
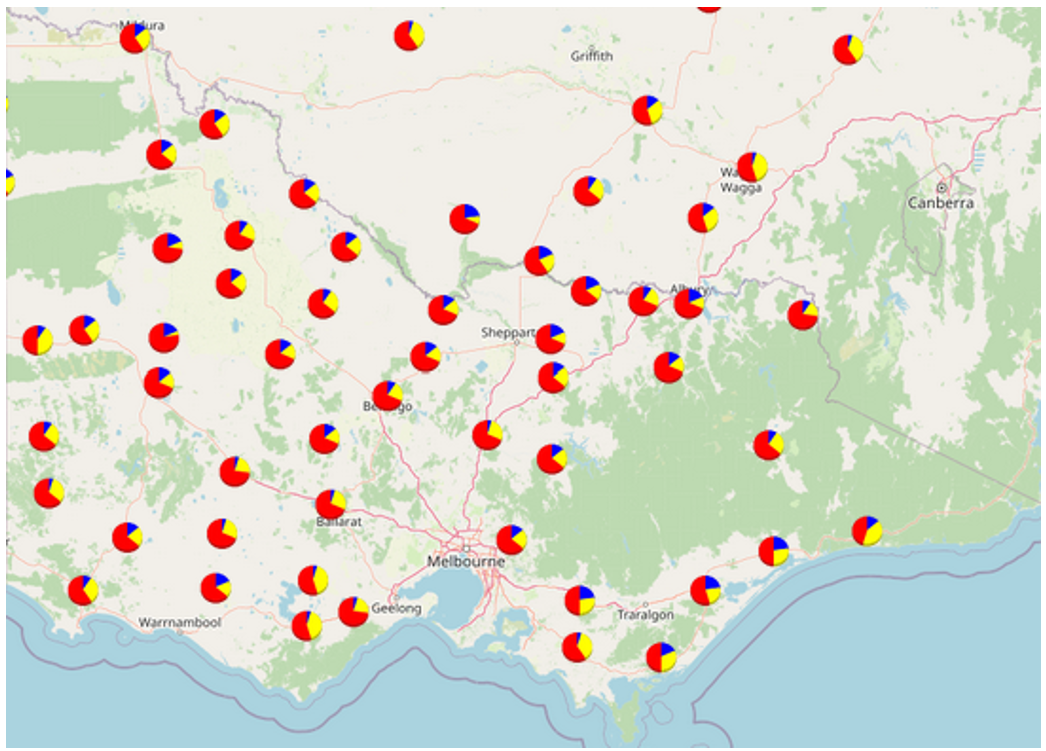
It's important to remember that both El Niño and the positive IOD have not always led to drier conditions. Either phenomenon increase the chance of decile 1 spring rainfall to around 25% and the chance of a dry spring (lowest third of records) to greater than 50%. Nevertheless, the chances of average rainfall is around 10–15%, with smaller chances of wetter than average (see Figures 1 and 2). While it’s easy to be critical of the majority of model predictions of a dry hot spring, the above discussion of events has the benefit of hindsight and we are all learning about the many drivers of climate and weather. It is uncertain as to why most models were unable to take the differences in sea surface temperature into their forecasts and that is an active area of investigation by researchers at the moment.
What about 2024?
Climate predictions made in summer for southern Australia are typically unreliable. At the moment, both El Niño and the positive IOD are decaying which will progress further into autumn. Cool water has built up to depth in the western Pacific Ocean around the equator, which is a clear indicator that the El Niño is declining. At least three of the world climate models are predicting something like a La Niña during winter, but the rest are sitting on the fence. The presence of cooler water under the Pacific is certainly essential for the formation of a La Niña, but in no way guarantees it.
Historically, El Niño slightly increases the chance of La Niña in the following year, with around one third of all El Niño’s being followed by a La Niña. Much random weather will need to happen to push more of that cool Pacific water over to South America, including a brief reversing of trade winds in the western Pacific. As we come into autumn, phenomena like the Madden Julian Oscillation (MJO) in phases six and seven can reverse the winds. The MJO is an area of cloud and tropical weather that spins around south of the equator and takes roughly 40 days to transit the globe. Positions six and seven position the MJO to our northeast and can provide a source of westerly wind around the Solomon Islands. Tropical weather events like cyclones could also give the trade wind a reversal if they formed in the Coral Sea south of the equator.
In the meantime, monitoring soil moisture levels will provide a better guide to crop potential in 2024 than climate model predictions made in summer or autumn. Of course, summer weed control is important to conserve moisture and nitrogen for winter crops.

Figure 1. August to October rainfall in El Niño years, red chance of being in the driest third, yellow average third, blue wettest third.

Figure 2. August to October rainfall in +IOD years, red chance of being in the driest third, yellow average third, blue wettest third.
Useful resources
GRDC South rainfall history and climate driver tool
Contact details
Dale Grey
0409 213 335
dale.grey@agriculture.vic.gov.au
@Eladyerg
GRDC Project Code: DJP2106-008SAX,
Was this page helpful?
YOUR FEEDBACK
