The Cool Soil Initiative: A farmer-focused, scalable framework for emission reporting through the supply chain
The Cool Soil Initiative: A farmer-focused, scalable framework for emission reporting through the supply chain
Author: Fiona McCredie (Cool Soil Initiative) | Date: 15 Feb 2024
Take home message
There’s an increasing need for the food industry to demonstrate sustainable sourcing and to report on, and seek to reduce, all emissions created at every stage of a product’s supply chain. This includes those generated on farm. For farmers, that means:
- A need-to-know on farm emissions,
- A need for a robust process for estimating on farm emissions that are allocated along the supply chain for individual products, and
- Most importantly, there is a need to consider how the practices, systems and seasonal conditions are influencing farm emissions, and what can be done to improve farm performance and lower emissions.
What is the Cool Soil Initiative?
The Cool Soil Initiative provides a scientifically credible, pre-competitive and market-recognised framework for delivering research, analysis and reporting, that supports farmers to improve soil health, environmental outcomes and reduce farm (and scope 3) greenhouse gas (GHG) emissions using sustainable farming practices.
The Cool Soil Initiative (CSI) has been operational for five years, working with 200 farmers to improve soil health and environmental outcomes, as well as providing impact reporting to both farmers and the supply chain on the GHG emissions associated with growing wheat, maize and canola. The current members of CSI are Kellanova (formerly Kelloggs), Manildra, Pepsico, Mars, Allied Pinnacle and Corson Grain, and Charles Sturt University.
As CSI’s partners operate in Australia and internationally, and much of Australia’s grain is exported, the CSI program is designed to ensure the GHG emission numbers and impact reporting, are recognised both here at home and globally, and are accepted throughout the whole supply chain. This is why CSI uses the Cool Farm Tool and aligns its measurement, verification and reporting system with relevant global and Australian protocols
How does it work?
CSI brings together both farmers and the companies which buy and use grain, streamlines reporting AND ensures the supply chain is focused on sustainable farming practices (rather than just an emission number), recognising that greenhouse emissions are the outcomes of the farming system, rather than a driver. CSI is free for growers as it is funded by the member consortia.
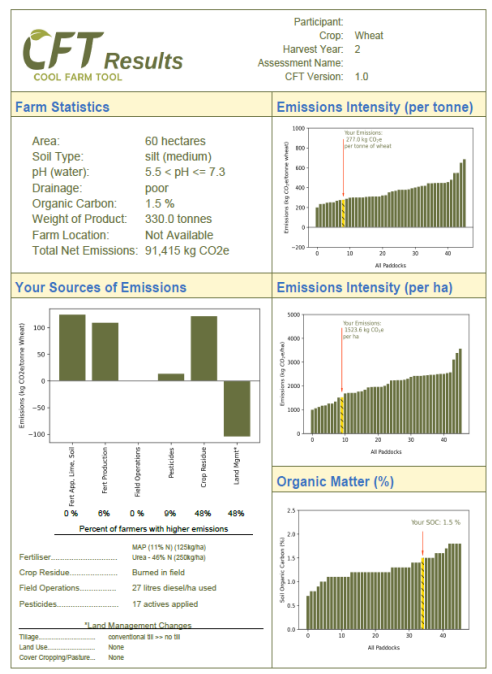
CSI currently works with 4 farming systems group (FSG) in NSW and Victoria, namely FarmLink, Riverine Plains, Central West Farming Systems and Irrigation Research and Extension Committee (IREC). These FGSs work directly with 200 farmers to collect, analyse and identify opportunities to remove soil constraints and improve agronomic, economic and environmental performance. Every CSI farmer gets free soil testing, and receives an annual emissions and soil health report which is benchmarked across the region an example of which is shown in Figure 1.
Figure 1. Example of an annual emissions and soil health report which is benchmarked across the region.
The CSI’s soil scientists spend time with the CSI farmers to work through the results and key drivers of GHG emissions, identify which practices could be most beneficial, and then support farmers to trial various practice changes. CSI collects crop and paddock data from each farm each year and consolidates these into regional results, which are shared with the group and tracked over time. The supply chain members receive aggregated regional emission, soil health and farm practice results and trendlines for their supply shed – noting they do not have visibility of individual farm results.
The CSI now uses an Application Programming Interface (API) version of the Cool Farm Tool specifically for Australian farms, which it commissioned to ensure modelled emissions are based on Australian climatic conditions and with alignment to the National Greenhouse Gas Inventory. CSI's technical review (Melland et al., 2023) has shown that the Australian version (compared with the CFT 1.0 and CFT 2.0) results in a smaller GHG footprint calculated due to better understanding of leaching potentials, better accounting for crop residue and nitrogen input emissions sources.
As part of this technical review, the emission profile analysis identified that median emission intensities calculated using CFT1.0 for wheat paddocks in 2020 in the Riverine Plains (278 kg CO2e/t) and Central West (158 kg CO2e/t) regions were similar or lower than those calculated by Sevenster et al. 20222 for a census of paddocks in the Australian southern (261 kg CO2e/t) and northern (295 kg CO2e/t) regions for their baseline analysis year of 2005. The median emissions intensity per hectare was similar in the Central West (565 CO2e /ha) and twice as high in the Riverine Plains (1399 CO2e /ha) in 2020 than the 2005 baseline national median (618 kg CO2e /ha). The main GHG emission sources identified in both studies were similar, with Scope 1 nitrogen and lime application dominating. Large differences in soil organic carbon stock change emission estimates would reflect differences in the year of study but moreover would reflect large differences between IPCC Tier 1 and Tier 3 methods of estimation for this emission source. Emissions or sequestration from this source can be justifiably excluded from the Cool Soil Initiative use of the Cool Farm Tool because long term changes in soil organic carbon that are reflected by these emissions are not able to be attributed to investment in practice change support by value chain corporate partners. Regional differences in the relative influence of fertiliser production and use were evident in the CFT1.0 analysis and in other Australian studies, which are a reflection of different nitrogen fertiliser use patterns.
What are the results to date?
The CSI Impact Report for 2023, based on ~350,000 ha, showed:
- A 50% increase in legume hectares over the last 3 years, noting the inclusion of legumes is the best way to maintain and build soil carbon, while building soil fertility and reducing reliance on fertiliser N
- A 35% increase in lime being incorporated – important because soil acidity is the single biggest constraint to crop production in north-east Victoria, southern NSW, which is ameliorated through lime addition with incorporation
- A reduction in emission intensity (emissions per tonne) over the period from 2017–2022, noting yield is the significant factor which impacts emissions per tonne
- CSI’s innovation program had 800 innovation hectares, assessing 10 practices
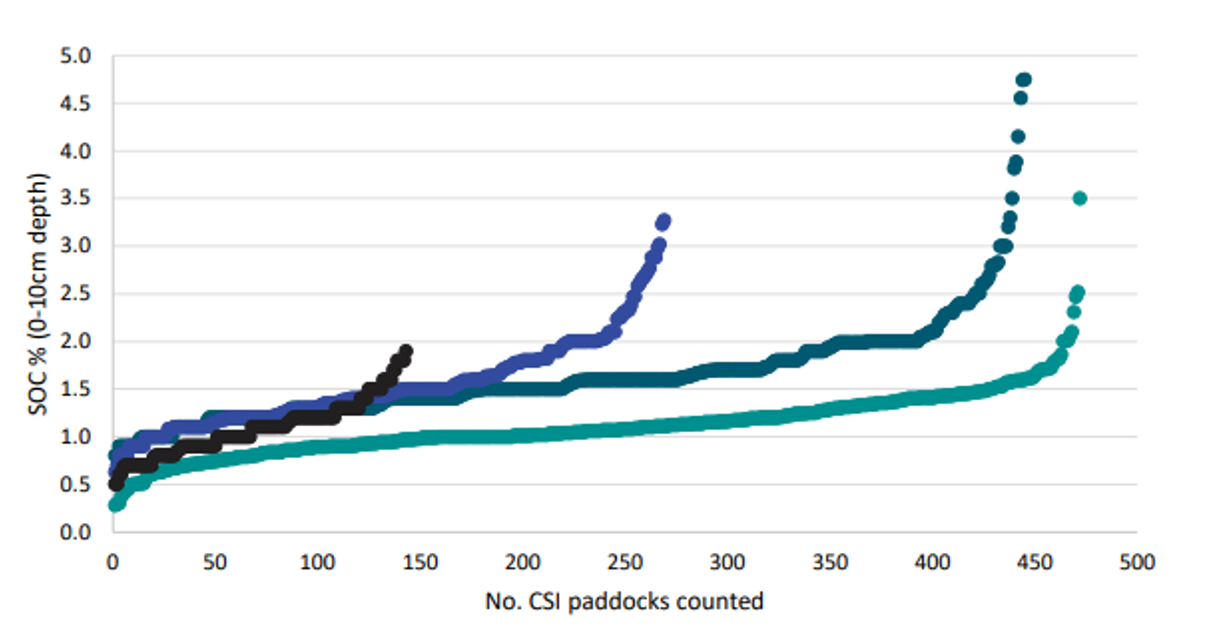
- Paddocks in CSI with soil organic carbon (SOC) values of 1.5% and greater tend to have a history of pulse and/or pasture phase integration (Figure 2)
- The CSI results indicate that SOC% is strongly aligned with diversity in cropping systems
- Farmers with a longer history of multiple soil health practices are showing higher SOC, which has correlated to more resilient yield compared to their neighbours during drought years.
Figure 2. Soil organic carbon (SOC) (%) values (measured at 0-10 cm depth) from 1,331 paddocks across four regions,
sampled from 2018 – 2022. The regions are supported by the relevant farming groups;
RP – Riverine Plains, FL – FarmLink, CWFS – Central West Farming Systems, IREC – Irrigated Research and Extension Committee.
Median values for each region are RP SOC = 1.55%, FL SOC = 1.45%, CWFS SOC = 1.06%, IREC SOC = 1.1%
A survey of CSI farm participants showed:
- 95% understand more about soil health and how to maintain/improve it
- 82% understand more about the type and amount of emissions on farm
- 50% have/may change practice as a result of CSI
- 68% say CSI emission baseline and reporting is useful for making decisions on farm.
From 2024, CSI is expanding into new crops, new regions, and new commodities, starting with oats in Western Australian, and livestock. There will also be new supply chain members, both pre- and post-farm gate, joining CSI, enabling greater investment on the ground.
Conclusion
It’s important to recognise that we can’t manage what we don’t measure – the Cool Soils Initiative allows paddock, farm, and regional based metrics on GHG emissions and other eco-system services to be collected so benchmarks on points of interest can be established and tracked through time to assess progress and test new management interventions, while providing a consistent, transparent framework for supply chain Scope 3 reporting. It is anticipated that participating in the Cool Soil Initiative will provide the on-ground support needed to help grain growers and other farming business to meet product specifications, market access and GHG targets set by existing and future governments and global food supply chains.
To register with the Cool Soils Initiative, you can do so at https://www.csu.edu.au/cool-soil-initiative/join-the-initiative.
Reference
Melland, A.R., Crabbe, R. and Schefe, C. (2023) Evaluation of the Cool Farm Tool for its suitability for application to GHG emissions estimation and reporting in dryland wheat production in south-eastern Australia. Cool Soil Initiative Technical Report. (Charles Sturt University; Wagga Wagga, Australia).
Sevenster, Maartje; Bell, Lindsay; Anderson, Brook; Jamali, Hizbullah; Horan, Heidi; Simmons, Aaorn; Cowie, Annette; Hochman, Zvi. Australian Grains Baseline and Mitigation Assessment. Main Report. Canberra: CSIRO; 2022. csiroEP2022 0163.
Contact details
Cool Soil Initiative
Charles Sturt University, Wagga campus
Contact via www.csu.edu.au/cool-soil-initiative/home
Date published
February 2024


