Cover crop mixtures – do they offer improved agronomic and environmental outcomes?
Author: Ismail I. Garba (CSIRO / UQ), Lindsay W. Bell (CSIRO), Alwyn Williams (UQ) | Date: 06 Mar 2024
Take home messages
- Economic benefits to the following winter grain crop have been previously demonstrated for summer cover crops in subtropical grain production systems, however research reported here demonstrates that winter cover crops have a significantly lower probability of providing an economic benefit to the following summer grain crop.
- Grain yield increases equal to or above the traditional winter fallow were highest for Maize following the winter cover crop mixture oats monoculture (100:0:0) and for Mungbean following monocultures of oats or legume.
- Winter cover crops reduced soil water and soil mineral nitrogen to subsequent crops by 17% and 15%, respectively and also improved a range of eco-systems services traits measured with active carbon accrual highest in oats:legume:brassica (15:15:70 and 15:70:15).
- A cover crop mixture of 64% grass and 36% legume had the best outcome for soil water and mineral nitrogen (N) management and the least cash crop yield penalty or negative gross margins.
- Long-term modelling showed that a grass-legume cover crop mixture offered the lowest risk and delivered improved eco-system services compared to conventional fallow, monoculture cover crops or those dominated by brassicas.
- Cover crop selection should be defined based on specific management goal, such as improving fallow efficiency or as break crop.
Introduction
Cover crops can be sown during part of the conventional fallow period to provide additional groundcover, improve rainfall capture and storage, build soil health, reduce soil erosion and nutrient losses, and improve a range of eco-system services (Ghimire et al., 2018; Lamichhane and Alletto 2022). In dryland cropping systems, understanding the implications of replacing fallows with cover crops on plant-available water (PAW), soil mineral nitrogen (N) and carry-over effects on subsequent grain crops is critical for understanding their potential use as a fallow replacement. Hence, quantifying the risks and probabilities of economic outcomes for cover crops options is critical. This approach however can add complex as the risks and rewards playout differently with the variability of rainfall amount and intensity. In addition, outcomes can be impacted by underlying soil characteristics, and interactions with crop management histories that together make it difficult to predict the following crop yield and likely economic outcome (Verburg et al., 2012; Garba et al., 2022).
Previous studies in this region have focused on evaluating efficacy of summer cover crops for winter wheat–fallow rotations (e.g., Whish et al., 2009; Wunsch et al., 2017). Studies on efficacy of winter cover crops for following summer crop yield are limited and no studies exist for the subtropical Northern Grain Region. This study examines the likely response of different winter cover crop combinations (grass vs. legume vs. brassica) on fallow soil water, mineral N, and legacy effects on the following crop yield, yield stability, economic returns and eco-system services.
Methods
This paper presents data from a series of field experiments (2020 – 2022) in a 3-year fallow–maize–fallow–mungbean–wheat rotation established at The University of Queensland, Gatton. A range of aspects of the cover crops and following grain crop were measured, including cover crop biomass production, following grain crop yield and profitability, weed suppression, soil active carbon accrual, soil aggregate distribution, nitrogen (N) mineralisation, N supply and N retention, parasitic nematode suppression, promotion of free-living nematodes, soil respiration, and soil water conservation.
The 3-year experiments were extrapolated using the Agricultural Production Systems sIMulator (APSIM) (Holzworth et al., 2014) to explore how long-term (70 years) integration of different types of cover crops alters fallow soil water and N dynamics and subsequent grain crop production compared with conventional fallow.
The cover crop species tested included monocultures and mixtures of a grass (forage oat, cv. Comet); a legume (common vetch in Year 1 and fababean (cv. Nasma) in Year 2); and a brassica (forage rape - cv. Greenland SF).
The treatments compared were:
- conventional fallow as control
- stubble addition; three cover crop monocultures
- 100% grass
- 100% legume
- 100% brassica, three two species mixtures
- 50% grass + 50% legume
- 50% grass + 50% brassica
- 50% legume + 50% brassica, and four three-species mixture
- 33% grass: 33% legume: 33% brassica
- 70% grass: 15% legume: 15% brassica
- 15% grass: 70% legume: 15% brassica
- 15% grass: 15% legume: 70% brassica
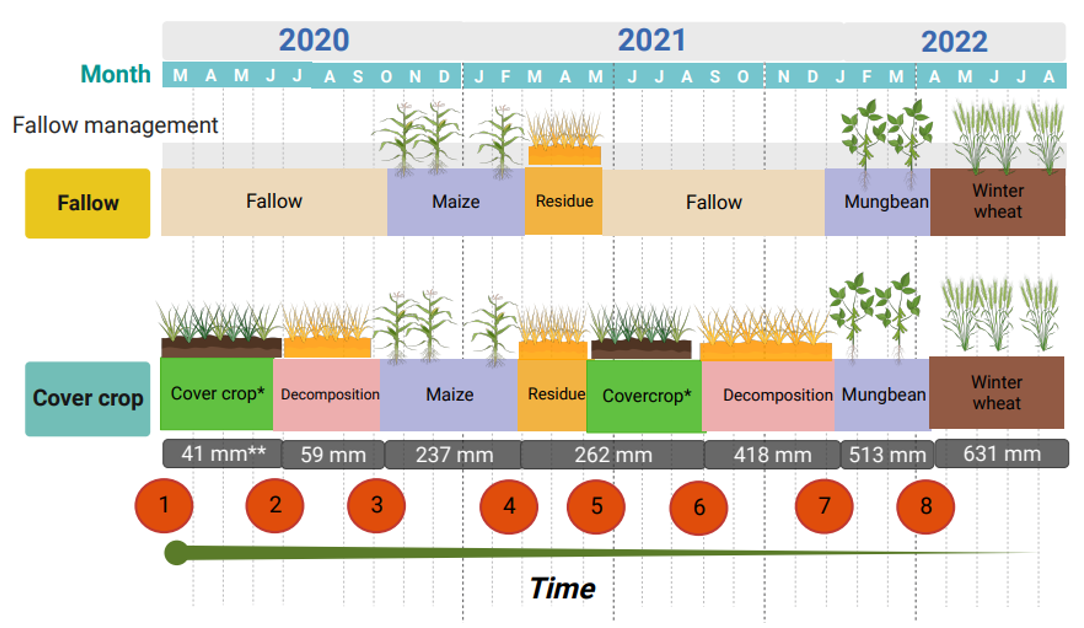
The sowing proportions of each species were applied as an adjustment to the standard (100% monoculture) sowing rates of 40 kg seeds ha–1 forage oat, 4 kg seeds ha–1 forage rape, and 200 kg seeds ha–1 fababean. Cover crops were terminated with glyphosate at ~80 days after sowing (Figure 1). Conventional fallow plots were kept weed free with glyphosate. Cover crop residues were left on the soil surface and plots were maintained as chemical fallows until grain crop sowing. Maize (Zea mays L.) was planted as the summer grain crop in 2020/2021 at 5.6 plants m–2 on 81 cm row spacing. Mungbean (Vigna radiata (L.) R. Wilczek) was planted in 2021/2022 at 30 plants m–2 on 50 cm row spacing. Mungbean was followed by a double crop of winter wheat at 150 plants m–2.
Figure 1. Schematic representation of the crop-fallow systems showing the time of cover crop sowing, termination, and the sowing and harvesting of the grain crop. The red circles show the timing of soil sampling. The * indicates cover crop phase. ** showed the total rainfall (mm) received during each rotation phase. Soil aggregate fractions were determined at point eight only. Soil POXC was measured at points 5-7 only after the stabilization period of 1 year.
Results
Cover crop effects on subsequent grain crops
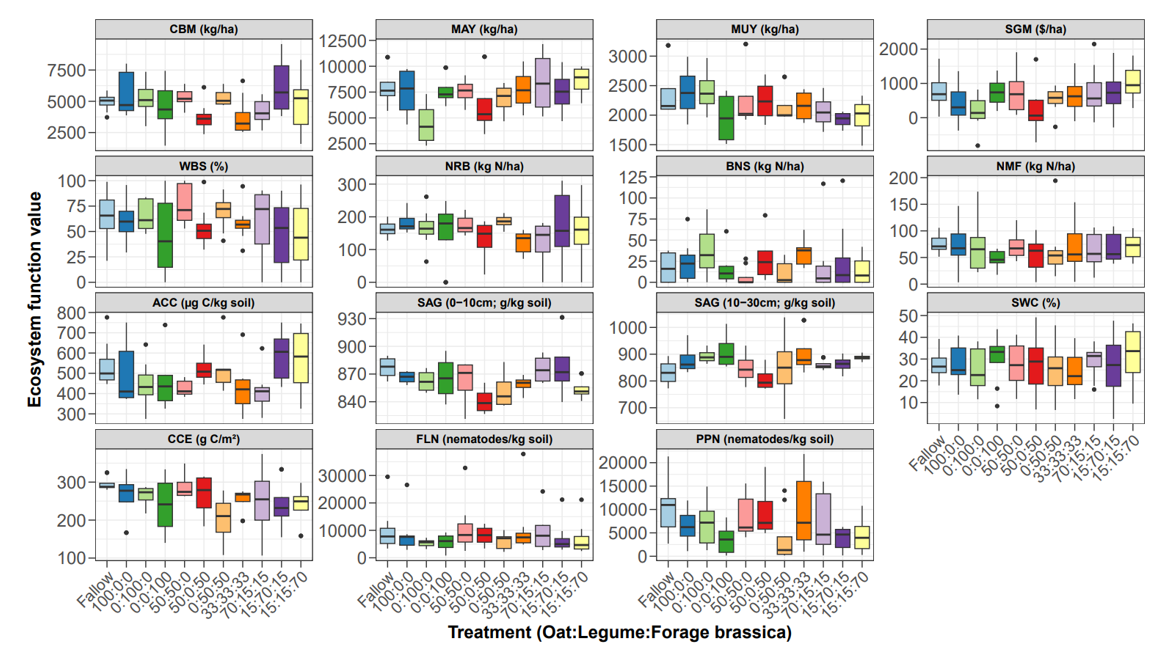
The effects of cover crops on subsequent grain crop yields and profit varied between treatments. Grain crop yield was consistently high in the conventional fallow (yield range inserted here), and highest for Maize following the winter cover crop mixture oats:legume:brassica (15:15:70) and highest for Mungbean following monocultures of oats or legume. System gross margins were highest for oats:legume:brassica (15:15:70) and conventional fallow and lowest in the oats:brassica mixture (Figure 2).
Growing cover crops instead of the conventional fallow increased total cost and consequently a significant difference was observed in farm gross margin in Year 1 for maize. The highest gross margin benefit was following stubble ($2,278 ha–1), 100:0:0 (grass:legume:brassica; $1,145 ha–1), fallow ($1,049 ha–1), 33:33:33 ($990 ha–1), 50:50:0 ($913 ha–1), and 0:100:0 ($820 ha–1). Compared to conventional fallow, the 100:0:0 resulted in a +9% increase in farm gross margin ($+96 ha–1), while the lowest gross margin in order were 0:0:100 (‒$862 ha–1), 50:0:50 (‒$734 ha–1), 70:15:15 (‒$703 ha–1), 15:15:70 (‒$686 ha–1) and 0:50:50 (‒$677 ha–1).
In Year 2, fallow management significantly (p < 0.05) affected both mungbean grain yield and gross margin. The 50:0:50 cover crop mixture had the highest mungbean grain yield (2,458 kg ha–1) and following conventional fallow was the lowest (1,739 kg ha–1). The average gross margin was highest following 50:0:50 ($1,019 ha–1) and 100:0:0 ($1,000 ha–1), and lowest following 0:50:50 ($327 ha–1), and 0:100:0 ($392 ha–1).
Following two years of cover cropping, winter wheat grain yield and farm gross margin in Year 3 were also significantly affected by fallow management. Average grain yield was highest following 100:0:0 (4,736 kg ha–1), while 0:100:0 had the lowest yield (3,727 kg ha–1). A similar trend was observed with gross margin where the 0:100:0 had the lowest followed by 50:50:0 and control fallow.
Figure 2. Distributions of the measured traits across three-site years for the conventional fallow and cover crop treatments (grass: legume: brassica). The boxplot shows the median (mid solid line), the 25th and 75th percentile (solid box), and 5th and 95th percentiles (whiskers). Units are given in the shaded box at the top of each graph. The ratios (x axis) show the sowing proportion (grass: legume: brassica) of the different cover crop species. CMB = cover crop biomass; MAY = maize grain yield, MUY = mungbean grain yield, SGM = system gross margin; WBS = weed biomass suppression; NRB = N retention in biomass; BNS = N supply via N fixation; NMF = N mineralized during fallow; ACC = active carbon accrual; SAG = soil aggregates >250 µm; CCE = cumulative CO2 emissions; FLN = free-living nematodes; and PPN = plant-parasitic nematodes.
Simulation of long-term impact of cover crop integration
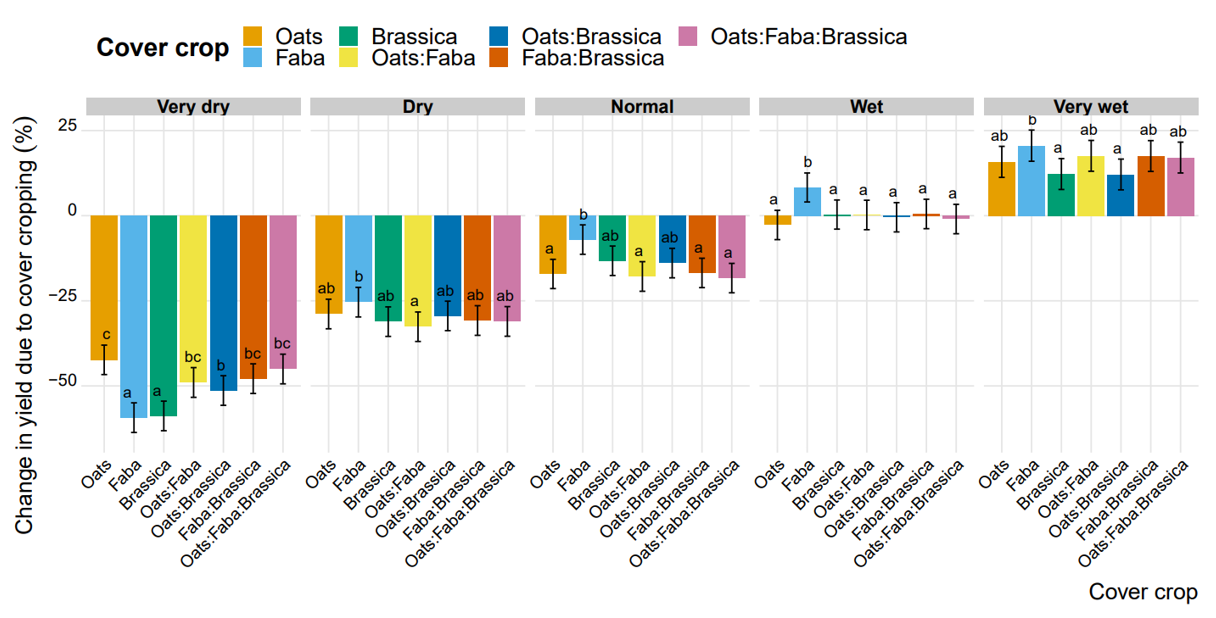
Following local validation of simulation model (APSIM) with 3-site-years of field data, 70 years of crop-fallow rotations were simulated comparing crop yields following conventional fallow compared with a diverse range of cover crops comprising monocultures and mixtures of grass, legume and brassica. By separating the annual crop-fallow into precipitation quintiles (i.e., 20% of years in each) the model predicted lower yield reductions (−13 to +5%) occurred in years with normal to above-median rainfall (quintiles 3 – 5), while much larger yield reductions (−20 to −37 %) occurred in years with below median rainfall (quintiles 1–2). In the very dry years (quintile 1), the grass monoculture had the lowest yield reduction (−20%; −1,636 kg ha–1) compared with the conventional fallow, while the brassica and grass:brassica mixtures had the greatest yield reductions (−37%; −2,450 kg ha–1). In median precipitation years (i.e., quintile 3), grass cover crops had a greater yield reduction (<−23%) compared to legume (−14%) and brassica (−18%). Interestingly, in the very wet years (quintile 5), both the grass and brassica monocultures had low yield reductions (<−5%) while there were predicted yield gains relative to conventional fallow of +1, +4, +3, and +3% for legume, grass:legume, grass:brassica and the three-species mixtures, respectively (Figure 3).
Figure 3. Average change in simulated maize grain yield (%) induced by cover cropping relative to conventional fallow during the 70 years of crop-fallow rotations (1950-2020) along annual precipitation quintiles: very dry (quintile 1; 216 – 596 mm), dry (quintile 2; 597 – 718 mm), normal (quintile 3; 719 – 823 mm), wet (quintile 4; 824 – 934 mm), and very wet (quintile 5; >934 mm). Bars show mean ± standard error for each cover crop treatment. Mean values followed by the same letter(s) are not significantly different at p < 0.05.Cover crop growth
Cover crop biomass production varied with cover crop type and ranged between 1.45 to 9.6 t ha−1 (Figure 2). Cover crops containing brassica consistently had the highest biomass, followed by the grass cover crop mixtures. Consequently, N accumulated in biomass was highest with brassica-associated cover crops (>200 kg N ha−1) and lowest in the legume based cover crops (<120 kg N ha−1). The C:N ratio of the cover crop biomass ranged from 8:1 to 15:1 and was lowest for brassica-based cover crops.
Nitrogen fixation
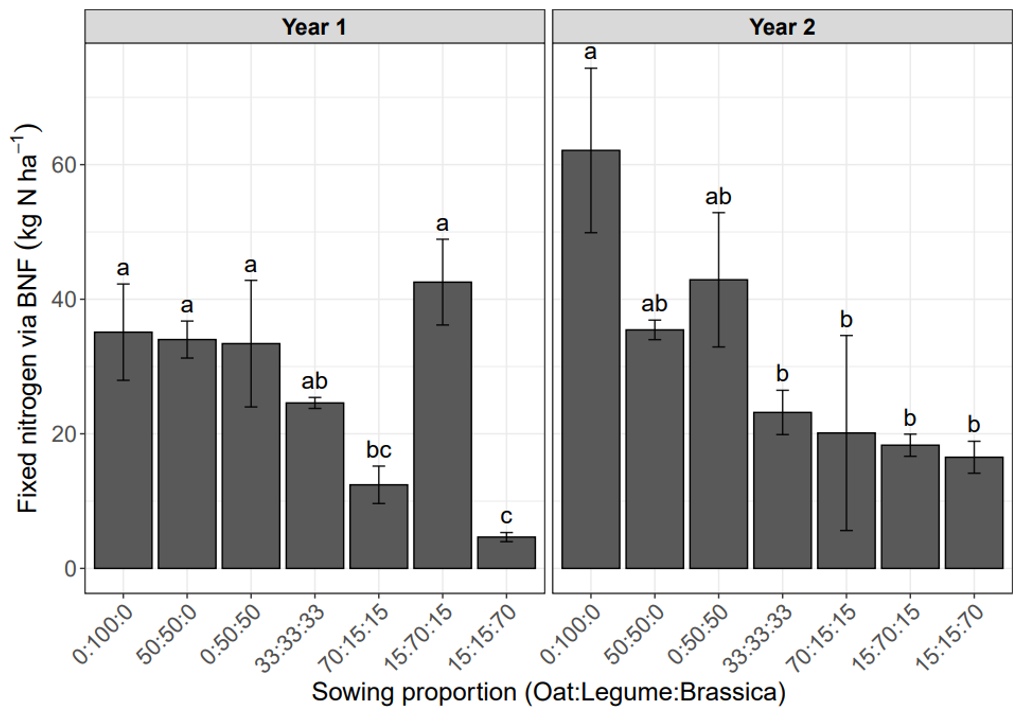
Nitrogen fixation by biological N fixation (BNF) legumes averaged 45 kg N ha−1 in the monoculture and from 11 to 53 kg N ha−1 in cover crop mixtures (Figure 4) and was also consistently higher in fababean compared with the common vetch monoculture in both years. In Year 1, the 15:70:15 mixture fixed the most N (42 kg N ha−1) while the fababean fixed the most in Year 2 (63 kg N ha−1).
Figure 4. Aboveground N fixed by the legume-associated cover crop treatments. Error bars are standard error (±) of the mean. Within each figure panel, mean values labelled with the same letter were not significantly different at p < 0.05 (Tukey’s HSD).
System N balance following cover crops
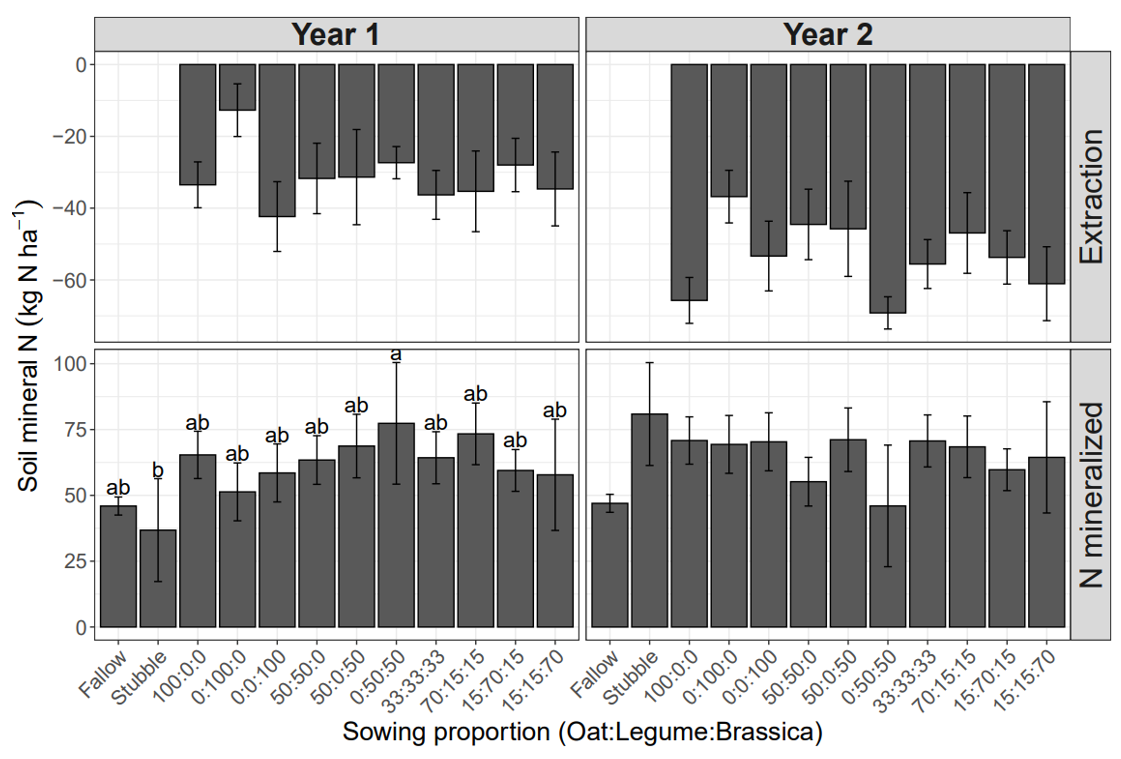
Starting soil mineral N averaged 196 kg N ha−1. In both years, average soil mineral N content at cover crop termination was higher in control fallow compared to cover crop plots. This is explained by soil mineral N conversion to organic N by cover crops and the extent to which this occurred differed significantly between the cover crop treatments (Figure 5). The forage brassica monoculture (0:0:100), had the highest conversion of soil N to organic N, highest soil mineral N removal (42 kg N ha−1) and lowest mineral N at termination (93 kg N ha−1). The legume-associated cover crops had the lowest mineral N extraction and added 12 to 28 kg N ha−1 compared to other cover crops.
At the end of the fallow period, soil mineral N did not differ significantly between the cover crop treatments in both years but was 26 kg N ha−1 lower than in the control fallow. Although the legume-based cover crops had higher soil mineral N content at termination, the relative net N mineralisation post-termination of the cover crops was greater in grass:legume (50:50:0) mixture in year 2 compared to year 1. Both monoculture and mixtures of the three species had higher N mineralisation post cover crop termination than the control fallow and the stubble treatments (Figure 5).
Figure 5. Soil mineral N recovery by cover crop treatments relative to control fallow (top panel) and soil mineral N accumulation (bottom panel) during the subsequent fallow period after cover crop termination Year 1 (n = 8) and Year 2 (n = 4). Error bars are standard error (±) of the mean. Within each panel, mean values labelled with the same letter were not significantly different at p < 0.05 (Tukey’s HSD). Soil mineral N presented as the aggregated total for soil layers 0–120 cm depth.
Cover crop effects on soil water extraction and fallow efficiency
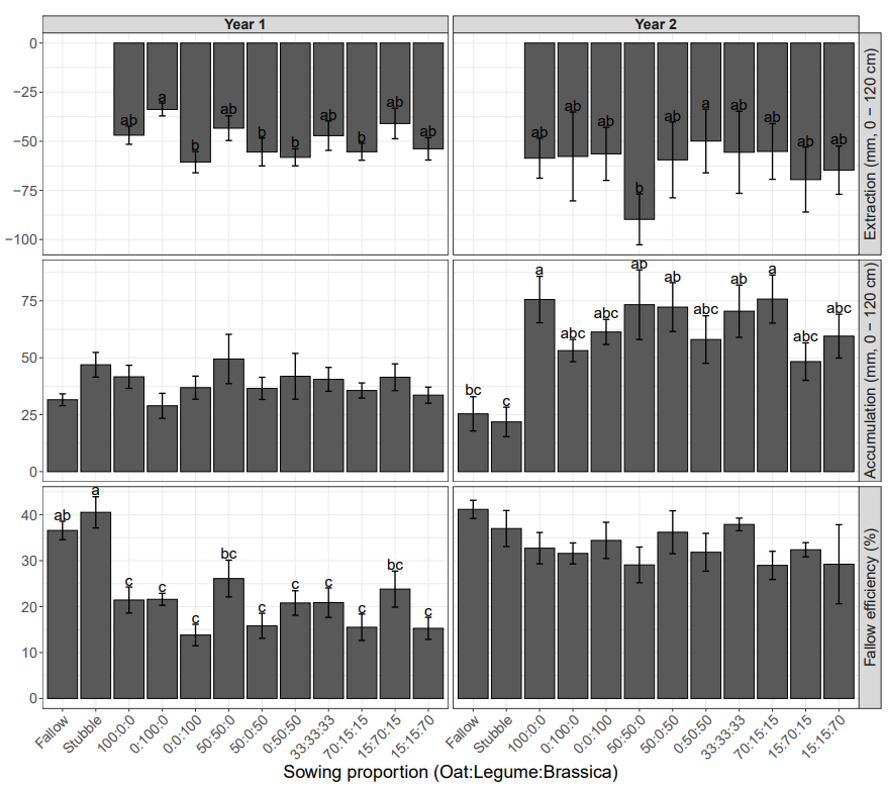
At cover crop sowing, PAW averaged 44 mm in Year 1 and 159 mm in Year 2, respectively. Cover crop water use was highest in cover crops that had high biomass production i.e., forage brassica monoculture and the brassica 2-way and 3-way cover crop mixtures. At cover crop termination, PAW was consistently higher in the control fallow (101 mm and 140 mm in Year 1 and Year 2, respectively) than after cover crops (pls show PAW for cover crops min and max here). In Year 1, the forage brassica monoculture (0:0:100) had the highest soil water deficit compared to the control (61 mm) while the common vetch monoculture (0:100:0) had the lowest (34 mm). In Year 2, the grass-legume mixture (50:50:0) had the highest soil water deficit (90 mm) while the forage brassica-fababean mixture (0:50:50) had the lowest (50 mm) compared to the control fallow (Figure 6).
At the end of the fallow period at sowing of the subsequent grain crops, the control fallow and the stubble treatments had a PAW of 127 mm while the cover crops had 107 mm. Net soil water accumulation post cover crop termination and grain crop sowing (end of fallow) did not differ significantly between cover crop treatments but was lower in the control fallow plots over the same period. Soil water deficits were lowest with legume-associated cover crops compared to grass and brassica. The forage brassica-dominated treatments had the lowest fallow efficiency, and highest soil moisture extraction relative to the control fallow. In addition, the magnitude of the soil water deficit was higher in mixtures than in monoculture. The overall fallow efficiency (i.e., change in soil water relative to rainfall over the period) in Year 1 was higher in the stubble (41 %) followed by the control fallow (37 %) and cover crop treatments (<30 %). In Year 2, the overall fallow efficiency did not differ significantly between the treatments (p > 0.05) and averaged 32% under cover crops compared to 37% in the stubble and 41% in the control fallow (Figure 6).
Figure 6. Cover crop soil water extraction relative to control fallow (top panel), soil water accumulation (middle panel) during the subsequent fallow period after cover crop termination, and fallow efficiency (%) (bottom panel) in Year 1 (n=8) and Year 2 (n=4). Error bars are standard error (±) of the mean. Mean values labelled with the same letter are not significantly different at p <0.05 (Tukey’s HSD); where no lettering is present within a panel, treatments do not differ statistically from one another. Plant-available water (PAW) is presented as the aggregated total for soil layers 0–120 cm depth.
Cover crop benefits for pest suppression and soil health
The grass-dominated cover crop mixtures had better weed biomass suppression (75%) compared to forage brassica (64%) and legume (51%) cover crops.
Averaged across the fallow period, the grass:legume mixture and grass monoculture sustained a higher number of free-living nematodes (11,236 individuals kg−1 dry soil) compared to legume:brassica (6,018 individuals kg−1 dry soil), forage brassica monoculture (5699 individuals kg−1 dry soil) and control fallow (6955 individuals kg−1 dry soil). The grass:legume mixture and legume monoculture were also associated with higher numbers of plant-parasitic nematodes compared to the forage brassica monoculture (Figure 2). Pratylenchus neglectus (root lesion nematode) and Merlinius brevidens (stunt nematode) were the major plant–parasitic nematodes present in high abundance. The abundance of M. brevidens averaged 3600 individuals kg−1 dry soil at the beginning of the experiment and increased by more than 3–fold following oat and 4-fold following legume cover crops. The brassica and legume–brassica mixture had the least proliferation of M. brevidens compared to other cover crop treatments. The conventional fallow led to a reduction in the abundance of M. brevidens by 27% by the end of the experiments compared to the start of the experiments.
Cover crop increased soil mega and macro-aggregates, soil C and soil respiration. Cumulative soil respiration (a measure of soil microbial activity) during the fallow phase was lowest in the conventional fallow, and brassica monoculture was lower than the grass- or legume- cover crop mixtures. Following two years of cover cropping, permanganate oxidizable carbon (active carbon) – an active organic matter fraction that indicates improved soil health and nutrient cycling – in the top 0–30 cm soil layer ranged from 280 to 776 μg C kg⁻¹ soil. The total active carbon increased after two years of cover cropping but did not differ significantly between the cover crops and the conventional fallow despite additional C input from cover crop residues. Soil mega- and macro-aggregates (indicating better soil structure) in the 0–10 cm soil depth were more abundant following legume-dominated mixed cover crops (879 g kg−1 soil) and lowest following legume:brassica mixtures (852 g kg−1 soil). In contrast, the forage brassica monoculture maintained a higher abundance of mega- and macro-aggregates in the 10–30 cm soil layer (912 g kg−1 soil) while the conventional fallow had the lowest (832 g kg−1 soil).
Multifunctionality of different cover crops
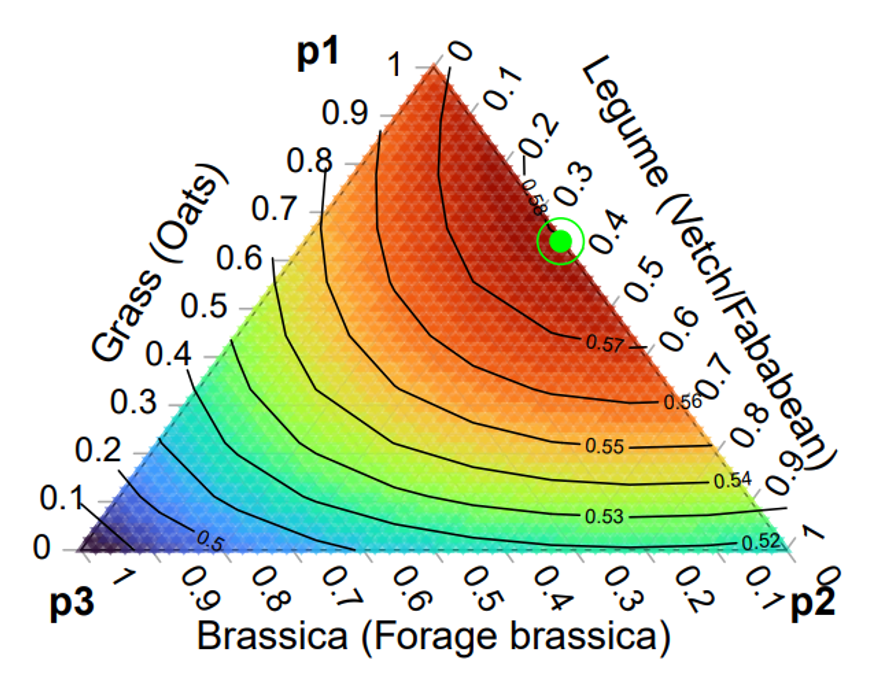
Multifunctionality, as indicated by the relative performance of each of the above listed outcomes, tended to decrease as the forage brassica seeding proportion increased. The predicted optimum mixture composition that maximized overall multifunctionality was predicted to be 64% grass, 36% legume, and 0% forage brassica (Figure 7).
Figure 7. Average multifunctionality based on the sowing proportions of grass (p1), legume (p2), and brassica (p3) cover crops, showing the predicted cover crop mixture that maximizes multifunctionality (dot and circle).
Conclusion
Integrating grass:legume cover crop mixture in a short winter fallow reduce grain crop yield (Figure 2) and farm gross margin (Figure 3). These findings are opposite to results from many summer fallow cover crop findings (reference) and is likely explained by the lower rainfall and rainfall intensity in winter relative to that experienced in summer. This study demonstrates that there is a significant a risk that winter cover crops will reduce PAW and yield in following grain crops – particularly in dry seasons, while a small positive benefit is likely in wet seasons.
The grass:legume mixture had the highest abundance of plant-parasitic nematodes (Pratylenchus neglectus and Merlinius brevidens) but fostered robust soil food webs with complex soil nematode trophic interactions, indicating promotion of soil ecosystem functions related to N and C cycling and overall improvement in soil health.
Different cover crop types are likely to offer different functions and perform better under different growing conditions. Mixed species cover crops are thought to provide a greater range of benefits and more resilience to these uncertainties. The brassica-associated cover crops were the most sub-optimal choice due to high water use, low groundcover residency and reduced soil nematode diversity. This research found that amongst a range of mixed species cover crops, implementing grass-legume cover crops was the best option providing a range of benefits, such as enhanced water conservation and increased soil C and N cycling, helping to improve soil health and nutrient supply.
Cover crops could be considered as a flexible option for a specific targeted management goal (such as weed suppression) and as an opportunistic practice to be implemented in La Nina years to provide groundcover rather than low or no ground cover which often occurs in continuous fallow phases.
Acknowledgements
The authors gratefully acknowledge the support of Drs. Graham and Marcelle Stirling for extracting, identifying, and counting the nematodes. We are grateful to Dr. Chris Baldock (Metagen Australia) for analysing soil carbon samples.
References
Garba II, Bell LW, Williams A (2022) Cover crop legacy impacts on soil water and nitrogen dynamics, and on subsequent crop yields in drylands: a meta-analysis. Agron Sustain Dev 42:34. https://doi.org/10.1007/s13593-022-00760-0
Ghimire R, Ghimire B, Mesbah AO, Idowu OJ, O’Neill MK, Angadi SV, Shukla MK (2018) Current status, opportunities, and challenges of cover cropping for sustainable dryland farming in the Southern Great Plains. J Crop Improv 32:579–598. https://doi.org/10.1080/15427528.2018.1471432
Holman JD, Arnet K, Dille J, Maxwell S, Obour A, Roberts T, Roozeboom K, Schlegel A (2018) Can Cover or Forage Crops Replace Fallow in the Semiarid Central Great Plains? Crop Sci 58:932–944. https://doi.org/10.2135/cropsci2017.05.0324
Holzworth DP, Huth NI, deVoil PG, et al (2014) APSIM – Evolution towards a new generation of agricultural systems simulation. Environ Model Software 62:327–350. https://doi.org/10.1016/j.envsoft.2014.07.009
Lamichhane JR, Alletto L (2022) Ecosystem services of cover crops: a research roadmap. Trends Plant Sci 27:758–768. https://doi.org/10.1016/j.tplants.2022.03.014
Nielsen DC, Lyon DJ, Hergert GW, Higgins RK, Calderon FJ, Vigil MFl (2015) Cover crop mixtures do not use water differently than single-species plantings. Agron J 107:1025–1038. https://doi.org/10.2134/agronj14.0504
Verburg K, Bond WJ, Hunt JR (2012) Fallow management in dryland agriculture: Explaining soil water accumulation using a pulse paradigm. F Crop Res 130:68–79. https://doi.org/10.1016/j.fcr.2012.02.016
Whish JPM, Price L, Castor PA (2009) Do spring cover crops rob water and so reduce wheat yields in the northern grain zone of eastern Australia? Crop Pasture Sci 60:517–525. https://doi.org/10.1071/CP08397
Wunsch EM, Bell LW, Bell MJ (2017) Can legumes provide greater benefits than millet as a spring cover crop in southern Queensland farming systems? Crop Pasture Sci 68:746–759. https://doi.org/10.1071/CP17223
Contact details
Ismail I. Garba
CSIRO Agriculture & Food,
306 Carmody Road, St Lucia, QLD 4067
Email: ismail.garba@csiro.au
Ph: 0478 793 244
Lindsay W. Bell
CSIRO Agriculture & Food,
203 Tor St, Toowoomba, QLD 4350
Email: lindsay.bell@csiro.au
Ph: 0409 881 988
Alwyn Williams
School of Agriculture and Food Sustainability,
The University of Queensland, Gatton, QLD 4343
Email: alwyn.williams@uq.edu.au
Ph: 0423 747 114
Date published
March 2024
Varieties displaying this symbol beside them are protected under the Plant Breeders Rights Act 1994.
Was this page helpful?
YOUR FEEDBACK

