Rutherglen bug (Nysius vinitor): risk forecasting and management. Climate, weedy pasture, and canola as factors that impact risk in summer grain crops (e.g. sorghum)
Rutherglen bug (Nysius vinitor): risk forecasting and management. Climate, weedy pasture, and canola as factors that impact risk in summer grain crops (e.g. sorghum)
Author: Hazel Parry (CSIRO), Zorica Duric (NSW DPI), Mukti Chalise (NSW DPI), Andrew Hulthen (CSIRO), James Hereward (UQ), Sandeep Dhakal (CSIRO), Chris Nunn (NSW DPI) | Date: 31 Jul 2024
Take home message
Background
Many growers are caught by surprise when an outbreak of Rutherglen bug (Nysius vinitor) occurs in a vulnerable summer crop such as sorghum, because these outbreaks are irregular and do not occur everywhere every year.
To date, outbreaks of Rutherglen bug have been quite unpredictable, and the drivers not well understood (Macfadyen et al., 2019). In northern New South Wales and the southeast of Queensland significant economic losses have been experienced in summer crops including sorghum (Sorghum bicolor) (Murray et al., 2013). It has been observed that the occurrence of intensive infestations in summer crops seems to have increased in regions where canola and summer crops are cultivated as adjacent crops (Miles et al., 2017). However, despite substantial knowledge of the crop and non-crop hosts of both Rutherglen bug and Grey Cluster bug (Nysius caledoniae), a similar species that is difficult to distinguish from the pest (Parry et al., 2019), the landscape ecology and climatic drivers of Rutherglen bug outbreaks warranted further investigation. This research has enabled us to identify landscape indicators of risk, along with potential management opportunities.
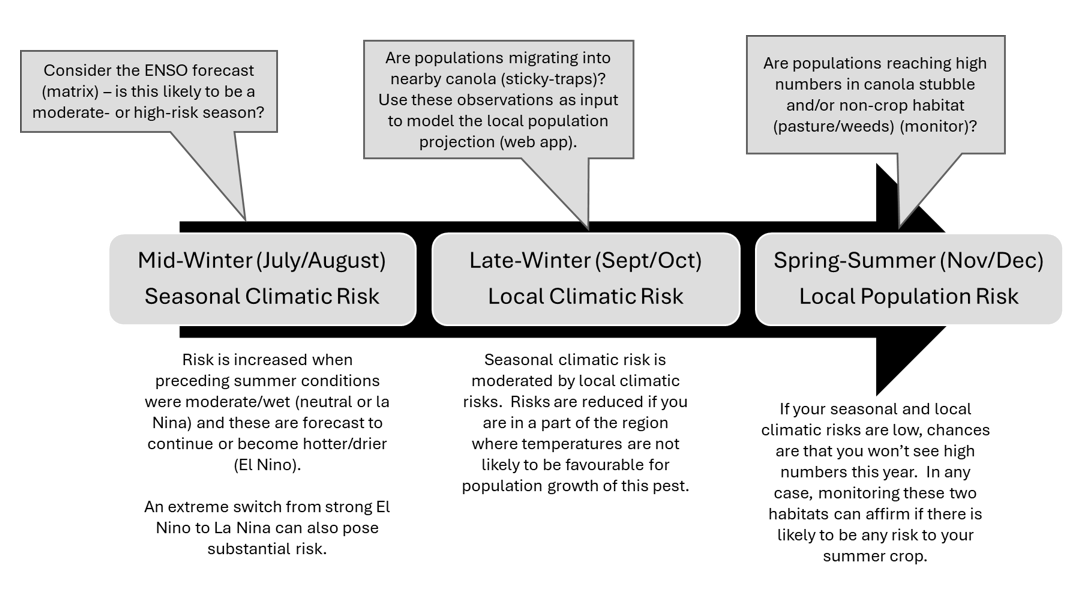
Mid-winter: consider the El Niño Southern Oscillation (ENSO) conditions
To investigate long term trends that may influence the abundance and outbreaks of Rutherglen bug, we analysed an unpublished dataset with over 1000 observations collected from control (unsprayed) plots in cotton trials during the summer season at the Australian Cotton Research Institute (Dr Simone Heimoana, CSIRO, pers. comm.). This site is approximately 25 km west of Narrabri, in north-west New South Wales, Australia, and Rutherglen bug populations were sampled approximately weekly each summer over a period of 23 years (1997–2020). The environment is semi-arid with an average annual rainfall of 656 mm. El Niño Southern Oscillation (ENSO) data was collected from the US Climate Prediction Centre. This was in the form of monthly ocean temperature deviation and summarised annual categorisation (strong to weak and El Niño to La Niña). In the eastern Australian context, an El Niño typically means reduced rainfall and warmer temperatures, while a La Niña is normally associated with higher-than-average winter, spring and early summer rainfall.
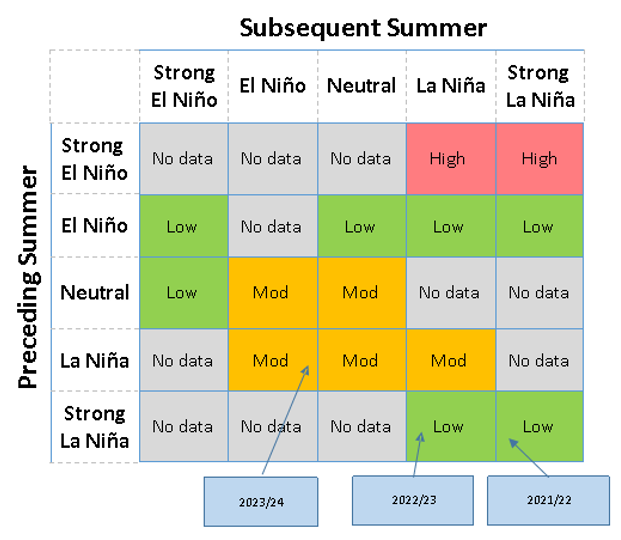
There was a range of ENSO climate conditions over the 23-year period, ranging from very strong El Niño (>2 °C ocean temperature deviation: 1997 and 2015) to strong La Niña (ocean temperature deviation lower than -1.5 °C: 1998, 1999, 2007 and 2010). High Rutherglen bug counts were recorded in seasons following strong El Niño. In this dataset, these seasons were a strong or medium La Niña. However, a strong La Niña in the present season did not correlate with high bug numbers unless the preceding season was a strong or very strong El Niño (Figure 1).
Comparing canola production in NSW over the past 20 years with the Rutherglen bug populations in this long-term study, we found a significant correlation between the amount of canola cropping at state level and Rutherglen bug numbers in the cotton crop.
Figure 1. Rutherglen bug ENSO risk matrix. Summary of significantly different risk scenarios posed by the shift from the preceding summer ENSO conditions to the subsequent summer, which can be used to indicate risk based on the ENSO predictions for the coming season issued by the Australian Bureau of Meteorology (BOM).
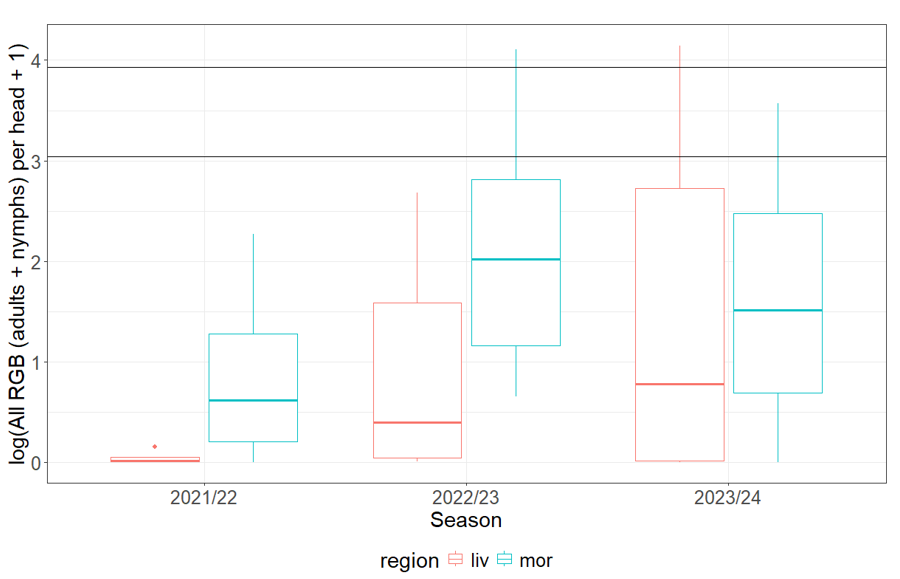
Over the past three years, samples were taken at up to six sites per year in two regions of north west NSW (NW NSW), the Liverpool Plains and Moree, within three key habitats (pasture, canola (incl. stubble) and sorghum) during late winter, spring and summer. The project team collected approximately fortnightly observations of Rutherglen bug and Grey cluster bug using either suction (D-vac) or beat box sampling depending on the vegetation growth stage. Sample counts were later converted to density per m2 and per head in sorghum. Populations of Rutherglen bug across all habitats, including the vulnerable stages of sorghum (Figure 2), were very low during the first year of our study (2021/22) during a strong La Niña period, with significantly higher populations in the following drier and warmer years (moving through La Niña (2022/23) to El Niño (2023/24) conditions), consistent with the insights we gained from our analysis of the 20 year dataset in cotton (Figure 1).
Figure 2. The mean population of Rutherglen bug per head on both flowering and mature sorghum summarised across field sites, by each of the three field seasons and two regions of NW NSW (liv = Liverpool Plains; mor = Moree).
Difference between seasons: F2,28 = 2.34, P = 0.11, R2 = 0.14.
Difference between regions: F1,29 = 2.69, P = 0.11, R2 = 0.08.
No interaction between season and region.
Horizontal lines show lower (20) and upper (50) spray control thresholds.
Late-winter: consider the local climatic conditions
We found a significant difference between populations observed in the two regions across our three-year study period, with mean populations in the Liverpool Plains consistently lower than those found in Moree (Figure 2). This can be attributed to the climatic conditions in the two regions, especially in terms of temperature and rainfall patterns. Moree typically experiences a semi-arid climate, characterized by warmer temperatures that result in a longer growing season, often earlier planting dates for crops, and accordingly earlier Rutherglen bug crop infestation. In contrast, the Liverpool Plains has a temperate climate with generally milder summers and more reliable and higher annual rainfall compared to Moree.
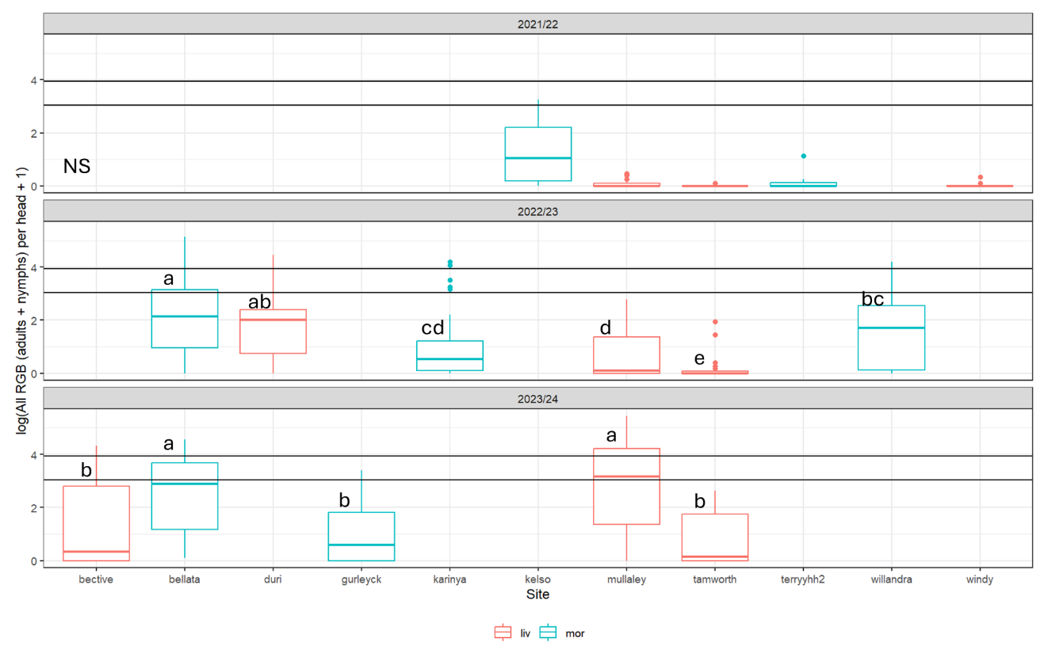
Although we found significant differences between field seasons and between the two regions, there was substantial variation between populations of Rutherglen bug in the vulnerable stages of sorghum at individual sites within regions each season (Figure 3). This variation was due both to finer scale climatic variation between sites, as indicated when we compared the field sites with climatic predictions from a population dynamic simulation model, as well as populations in nearby pasture and preceding canola stubble. These factors are explored in more detail below.
Figure 3. The population of Rutherglen bug per head on both flowering and mature sorghum, summarised by site in each of the three field seasons (liv = Liverpool Plains; mor = Moree). Letters indicate sig. differences between sites within field season. In year 1 the statistical model was not significant to determine any differences between sites (numbers were very low except at Kelso site).
Year 2 F5,214 = 13.9, P<0.001, R2 = 0.25; Year 3 F4,165 = 13.34, P<0.001, R2 = 0.25.
Horizontal lines show lower (20) and upper (50) spray thresholds.
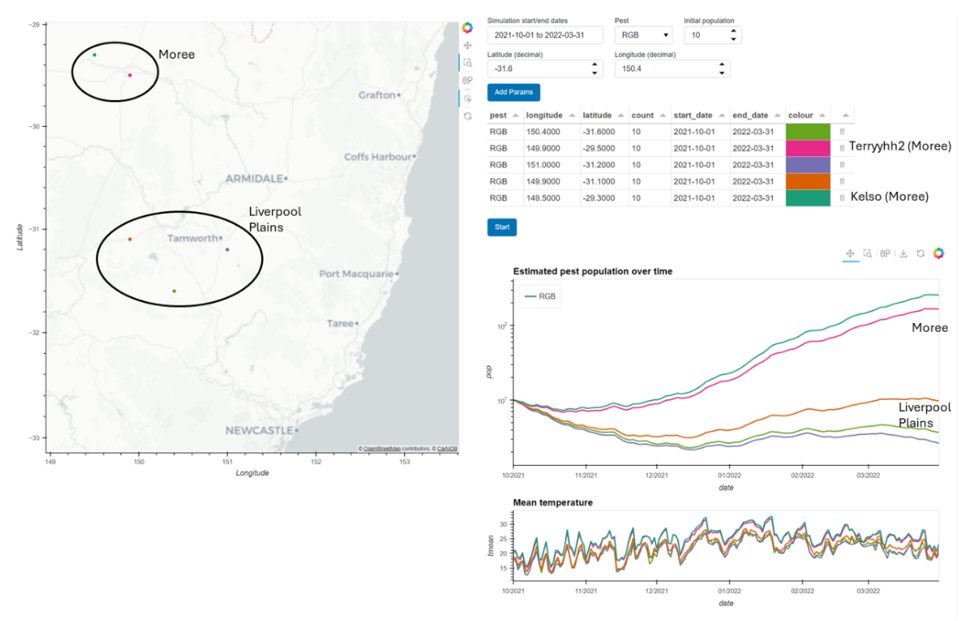
We developed a model for Rutherglen bug populations based on data in Kehat and Wyndham (1972), where exponential population growth is predicted above 20°C and population decline below this threshold. We have made this available via a web application online (Figure 4). Users can find their location dynamically on the map or input coordinates. They can then set start and end historical dates and an initial population to initialise the model. Running the model outputs a population curve which we have found to be comparable in numbers to our fortnightly sticky trap counts in the field, and the interface allows for a comparison of different dates or locations.
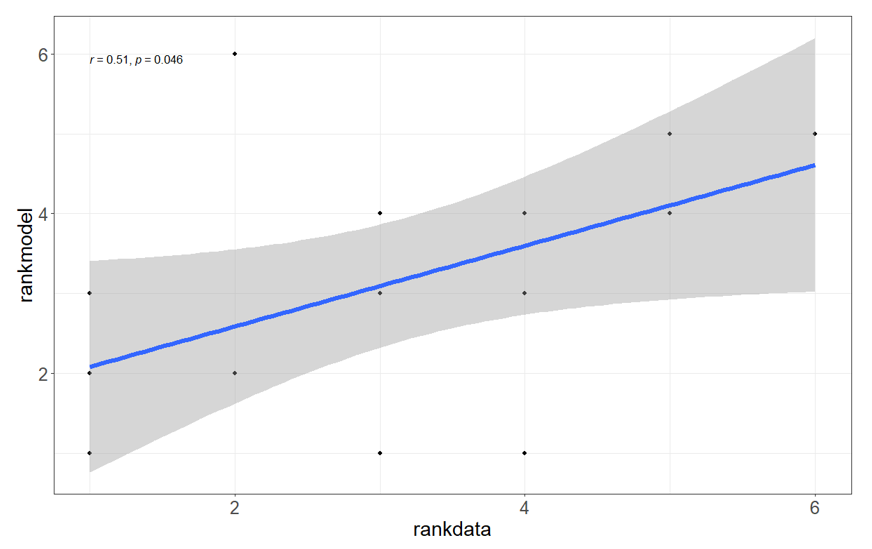
When model outputs for each site and year of our study were compared to simulation model runs, we found a significant correlation between the model predictions and the field data (Figure 5). This indicates a local within-season climate effect on population dynamics that is predicted well by this model. It is possible to use this model with forecast data (by setting an end date for the model a few weeks or months into the future), to give an estimate of the likely population trajectory for a given location.
Figure 4. Screenshot from the simulation model output. Example run for the first season of our study from the beginning of October to the end of March initialised with the same population of 10 at each site, with our two study regions (Moree and Liverpool Plains) highlighted on the map and graph, and the two Moree sites with relatively high populations predicted by the model also highlighted.
Figure 5. Correlation between the rank of Rutherglen bug populations per head on both flowering and mature sorghum summarised across field sites with the rank of simulation model Rutherglen bug population output. Simulation model was run from the beginning of October to the end of March for each field season initialised with the same population of 10 at each site.
The spearman’s rank correlation coefficient is shown with associated p-value (r = 0.51, P = 0.046).
Spring-summer: monitor canola post-harvest and weeds near your summer crop fields
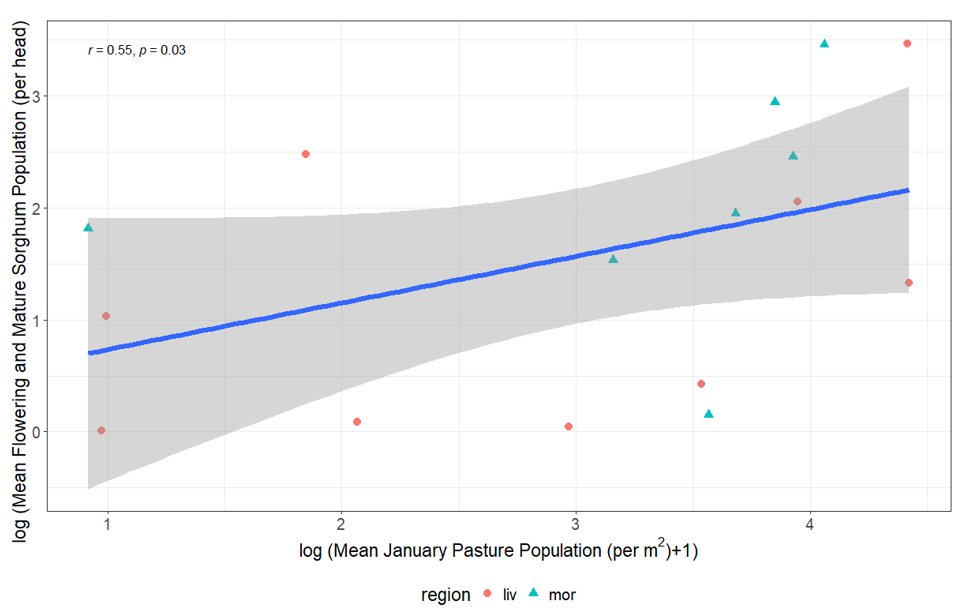
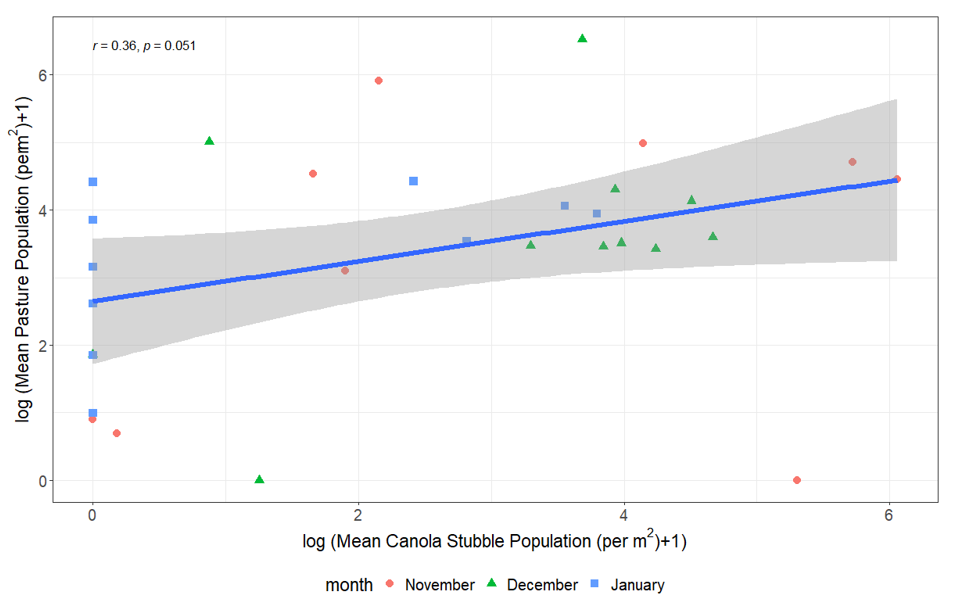
Analysis of the data from our three-year field study comparing Rutherglen bug populations in pastures with the populations in sorghum at the vulnerable flowering and mature stages indicated a positive correlation with pasture in each of the summer months (November–January), with the strongest correlation in January (Figure 6). There was no significant correlation between populations in November or December in canola stubble and sorghum (flowering/mature). However, we found a significant positive correlation between the populations in canola stubble and pasture within each month when viewed across the entire summer period (November, December, January; Figure 7). This indicates an indirect relationship, where the often-large populations we observed building up on canola stubble and volunteers remaining post-harvest in spring act as a source to build populations in pasture over summer: a green bridge that poses a risk to the sorghum crop. Therefore, risk is increased by canola in the landscape (as shown by the analysis of the 20-year dataset) and/or weedy pasture surrounding sorghum crops, particularly in years where climatic risks are also moderate or high. We are currently processing pitfall and genetic data to determine the rate of movement between these habitats.
Figure 6. The correlation between the mean population of Rutherglen bug per head on both flowering and mature sorghum summarised by site and the mean January population of Rutherglen bug per m2 on nearby pasture.
The spearman’s rank correlation coefficient is shown with associated p-value (r = 0.55, P = 0.03).
Figure 7. The correlation between the mean population of Rutherglen bug per m2 on pasture weeds vs nearby canola stubble by site, in each of November, December and January.
The spearman’s rank correlation coefficient is shown with associated p-value (r = 0.36, P = 0.051).
Conclusion
This research, focused on NW NSW, explains the long- and short-term climatic and landscape drivers of outbreaks of Rutherglen bug, and indicates key opportunities for management of this pest in the landscape before it becomes a problem for summer crops. Based on the analysis of extensive data sources by the project team, we advise that risks should be considered at multiple spatial and temporal scales. We have produced a seasonal risk forecasting matrix, a within-season population projection simulation model, and advice on the need to monitor canola stubble and/or weedy pasture near to summer crops, so growers and agronomists can make this assessment. In winter, the general outbreak risks for the following summer can be considered in relation to the long-term climatic forecast (El Niño Southern Oscillation, ENSO). As summer approaches, climatic risks can be estimated based on location using a simulation model of population increase in relation to local temperature projections for the coming months, now made available online. During spring and early summer, monitoring canola stubble and pastures provides an indicator of risk to nearby summer crops. These findings indicate that the management of populations in canola post-harvest could be an important means to minimise risks, along with suppressing weed hosts in nearby pastures.
References
Kehat M & Wyndham M (1972). The influence of temperature on development, longevity, and fecundity in the Rutherglen bug, Nysius vinitor (Hemiptera: Lygaeidae). Australian Journal of Zoology, 20 (1), 67-78.
Macfadyen S, Moradi-Vajargah M, Umina P, Hoffmann A, Nash M, Holloway J, Severtson D, Hill M, Van Helden M & Barton M (2019) Identifying critical research gaps that limit control options for invertebrate pests in Australian grain production systems. Austral Entomology, 58 (1), 9-26.
Miles M, Quade A, Volp T, Duric B, Burton B & Price L (2017). Managing Rutherglen Bug (Nysius vinitor) movement out of canola stubble into summer crops. Final Report Trial RGB17-2 2017.
Murray DAH, Clarke MB & Ronning DA (2013) Estimating invertebrate pest losses in six major Australian grain crops. Australian Journal of Entomology, 52 (3), 227-241.
Parry HR, Marcora A, Macfadyen S, Hopkinson J, Hulthen AD, Neave M, Bianchi FJJA, Franzmann BA, Lloyd RJ, Miles M, Zalucki MP & Schellhorn NA (2019) A native with a taste for the exotic: weeds and pasture provide year-round habitat for Nysius vinitor (Hemiptera: Orsillidae) across Australia, with implications for area-wide management. Austral Entomology, 58 (2), 237-247.
Acknowledgements
The research undertaken as part of the Improved Management of Rutherglen bug in the Northern Region project is made possible by the support of the GRDC. The authors would like to acknowledge the significant contributions of growers and agronomist for their cooperation, continued support, and for allowing us access to the land.
Special thanks to NSW DPI staff for continuous technical support. We are particularly grateful to Karlijn Spaans and Rodney Bambach for their invaluable contributions.
Contact details
Dr Hazel Parry
CSIRO
https://people.csiro.au/P/H/Hazel-Parry
Date published
July 2024
GRDC Project Code: CSP2104-007RTX,

