Agronomic practices for hyper yielding wheat
Agronomic practices for hyper yielding wheat
Author: Nick Poole, Max Bloomfield, Daniel Bosveld, Aaron Vague, Tom Price, Darcy Warren, Ben Morris, Rebecca Murray (Field Applied Research (FAR) Australia), Kenton Parker (CSIRO), Rohan Brill (Brill Ag) | Date: 22 Aug 2024
Take home messages
- The hyper yielding crops (HYC) project has successfully demonstrated new yield benchmarks for productivity of cereals in the more productive regions and seasons over the last four years.
- It is typically larger numbers of grains per head at harvest that generates high yields and increases the overall number of grains per unit area for wheat, barley and canola.
- At the HYC Millicent site in 2021–2023, fungicide management strategies for stripe rust and Septoria, combined with variety choice, were the most important factors in generating high wheat yields.
- Maximum wheat yields in southeast SA were achieved by red grained feed wheats and modern fungicide chemistry.
- Hyper yielding cereal crops require high levels of nutrition; rotations which lead to high levels of inherent fertility and judicious fertiliser application underpin high yields and the large nutrient offtakes associated with bigger crop canopies.
- The most important agronomic lever for hyper yielding wheat and closing the yield gap over the last four years has been the introduction of new germplasm and the correct disease management strategy, which was important despite the drier spring in 2023.
Hyper yielding crops research and adoption
The Hyper Yielding Crops (HYC) project, with assistance from three relatively mild springs (2020–2023), has demonstrated new yield boundaries for wheat, barley and canola, both in research and on commercial farms in the high rainfall zone (HRZ) of Australia. Five HYC research sites, with associated focus farms, and innovation grower groups have shown that wheat yields in excess of 11t/ha are possible in the southeast SA (Millicent). In the shorter season environments of WA, 7–9t/ha has been demonstrated at FAR’s Crop Technology Centres in Frankland River and Esperance in 2021.
Yield potential
Over the three years 2020–2023, yield potential at the HYC sites has been limited by solar radiation and temperature rather than soil water availability. Wheat and barley yield potential is driven by grain number in these mild moist springs. Whilst head number clearly contributes to high yield, there is a limit to the extent it can be used to increase yield. In most cases with yields of 10–15t/ha, 500–600 heads/m2 should be adequate to fulfil the potential.
So how do we increase grains per m2
Whilst more heads per m2 contribute to yield outcomes, it is typically larger numbers of grains per head at harvest that generates high yields and increases the overall number of grains per unit area in HRZ regions. It’s been acknowledged for several years that increasing grain number is related to growing conditions prevalent in the period from mid-stem elongation to start of flowering (approximately GS33–61). This window of growth in cereals covers the period approximately 3–4 weeks (~300°C.days) prior to flowering and is described as the ‘critical period’ (Dreccer et al. 2018). This critical period encompasses when the grain sites are differentiating, developing and male and female parts of the plant are forming (meiosis). If conditions during this period of development are conducive to growth, with high solar radiation and relatively cool conditions (avoiding heat stress), then more growth goes into developing grain number per head. The Photothermal Quotient (PTQ) or ‘Cool Sunny Index’ is a simple formula (daily solar radiation/average daily temperature) that describes how conducive conditions are for growth and, when applied to the critical period, it assists in determining the yield potential. When applied to the critical period, a high PTQ means a longer duration for photosynthesis leading to more grain and yield. The relative importance of PTQ is increased in seasons where soil moisture stress is not a factor.The relationship between yield potential and PTQ has been updated based on results from the HYC research (Figure 1). Using this data we demonstrated the new upper yield boundary created using European feed wheat varieties.
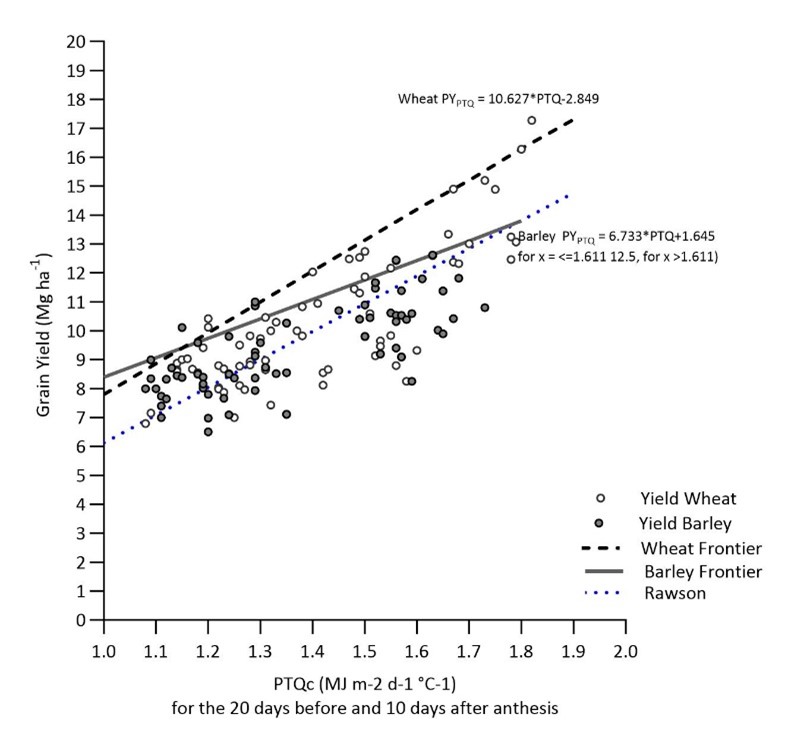
Figure 1. Relationship between photothermal quotient (PTQ) in the critical growth period and yield potential of cereals – a comparison of wheat and barley. Porker et al. (in press).
Rawson line in graph is associated with previous research on PTQ - Rawson HM (1988) Constraints associated with rice–wheat rotations
As growers and advisers, we understand the importance of cereal flowering date in order to minimise frost risk and heat/moisture stress. However, in high yielding crops, where moisture and heat stress are less problematic, optimising the flowering date enables us to maximise growth in the critical period for generating grain number per unit area. In 2021, the highest yield recorded in the HYC project on the mainland at Millicent (12.74t/ha) was achieved with a UK wheat cultivar, cv Reflection (a red grained winter wheat). Traditionally, this cultivar is considered too slow developing (i.e. flowers too late) for an Australian mainland HRZ environment, but in 2021, the mild spring and summer grain fill period allowed this cultivar to complete grain fill under more optimal conditions. The higher yield of this variety was associated with a lower thousand grain weight TGW (Figure 2). Whilst in this case, grains per head were not assessed, it was clear that to achieve such a high yield with small grains, must be a result of a high number of grains per unit area.
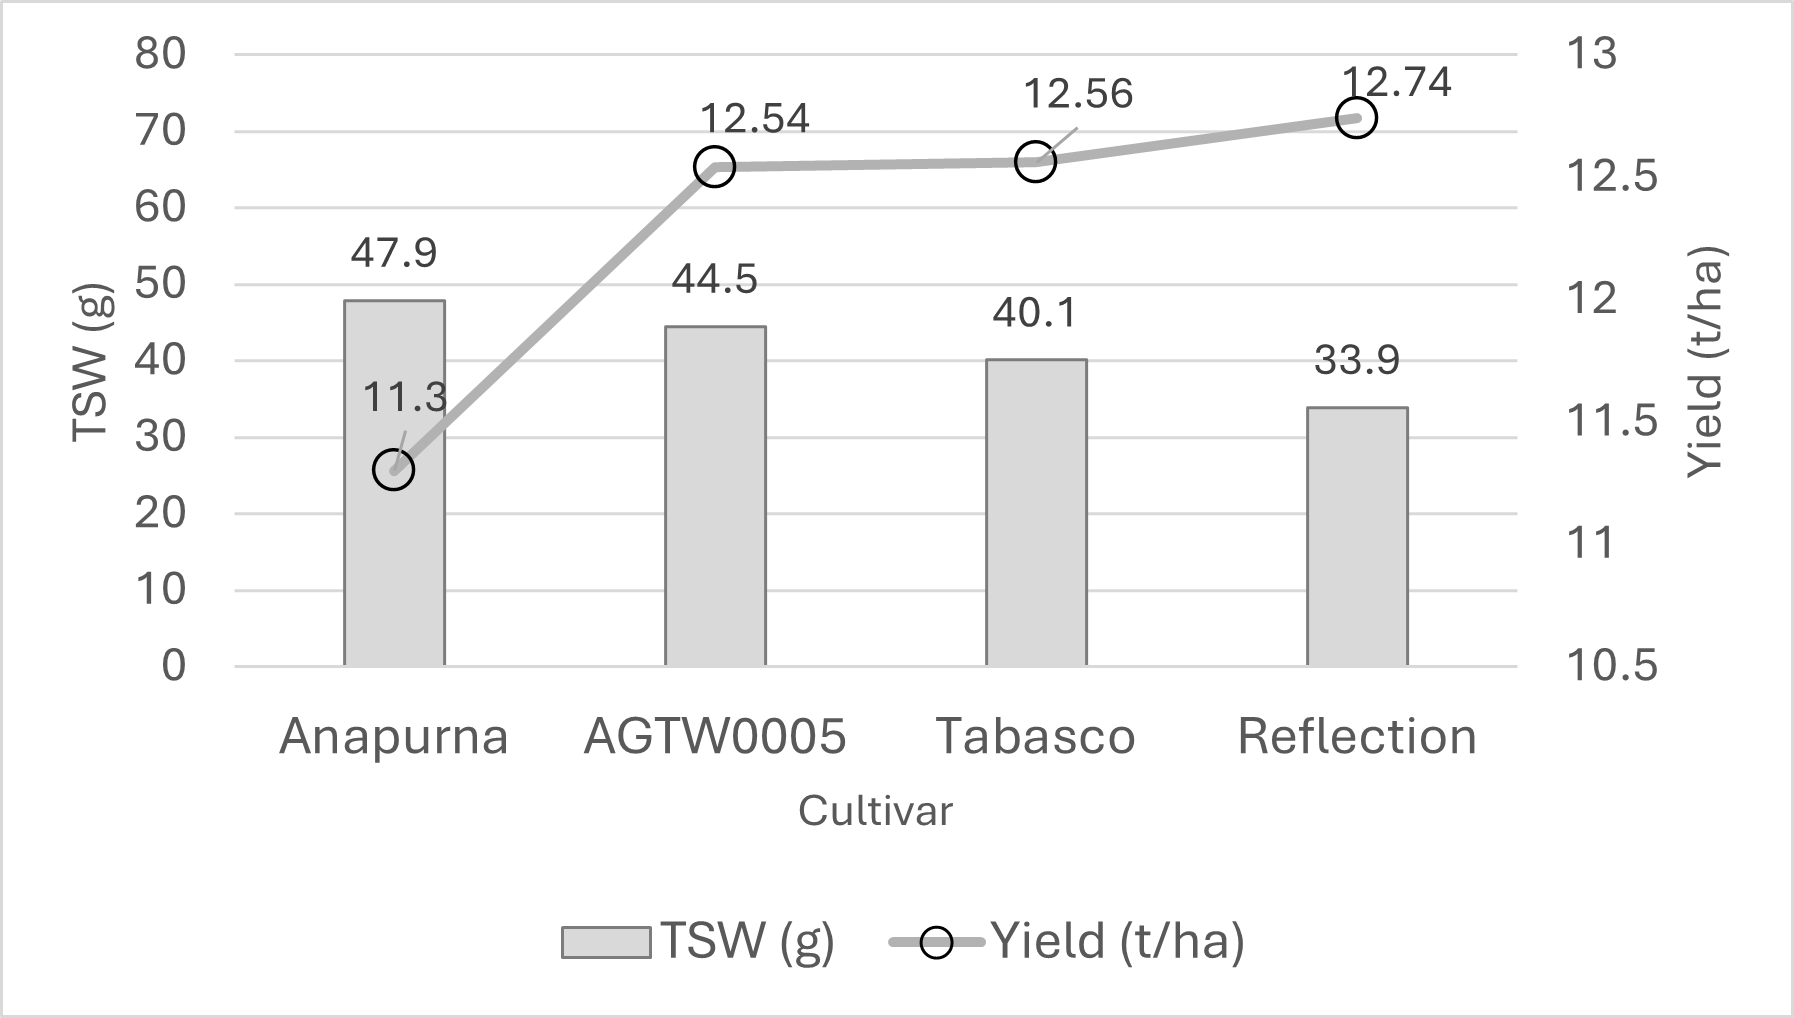
Figure 2. Relationship between highest yielding wheat cultivars in the HYC Elite Screen and thousand seed weight (tsw) – Millicent SA 2021.
Line figures represent yield, bars represent thousand seed weight (tsw)
Realising yield potential
It is one thing to create yield potential by maximising grain number per unit area, however higher grain numbers established during the critical period still must be realised during grain fill. For example, a very late developing wheat variety could benefit from optimal growing conditions associated with the critical period but then be subject to moisture and heat stress post flowering. This would result in a high harvest dry matter but a lower harvest index where less of the dry matter is realised as grain. Therefore, it remains a balance between setting potential and realising potential where the optimum flowering date and the phenology of the variety remain central to success in any season. However, recognising the importance of the critical period has been central to our understanding of higher yielding seasons.
Nutrition and rotation for hyper yielding wheat – farming system fertility to establish yield potential
The most notable results observed in the HYC project to date relate to nitrogen fertiliser. However, simply applying high rates of N fertiliser is not always the best option to achieve hyper yields. Nitrogen fertiliser rates should consider:
- N mineralising potential of the soil
- Carry-over N from previous years
- starting mineral N
- other factors, such as crop lodging potential, that may impact radiation efficiency.
It should be emphasised, however, that replacing N removal (N off-take in grain or hay) is required to maintain a sustainable farming system. Results from our southern NSW site at Wallendbeen provide an example of the conundrum with hyper yielding wheat crops. Established in a mixed farming system based on a leguminous pasture (six year phase) in rotation with a six year cropping phase, winter wheat yielded 8–9t/ha, however the application of N at rates greater than 120kg N/ha (2022) and 160kg N/ha (2023) in this scenario only served to reduce profit, while higher rates ≥160kg N/ha also reduced yield in 2022 (Figures 3 and 4). In 2022, despite an application of plant growth regulator (PGR) Moddus® Evo at 0.2L/ha + Errex® 750 at 1.3L/ha at GS31, higher applied N fertiliser rates (above 160kg N/ha) increased head numbers but also increased lodging during grain fill (data not shown), which led to reduced yield.
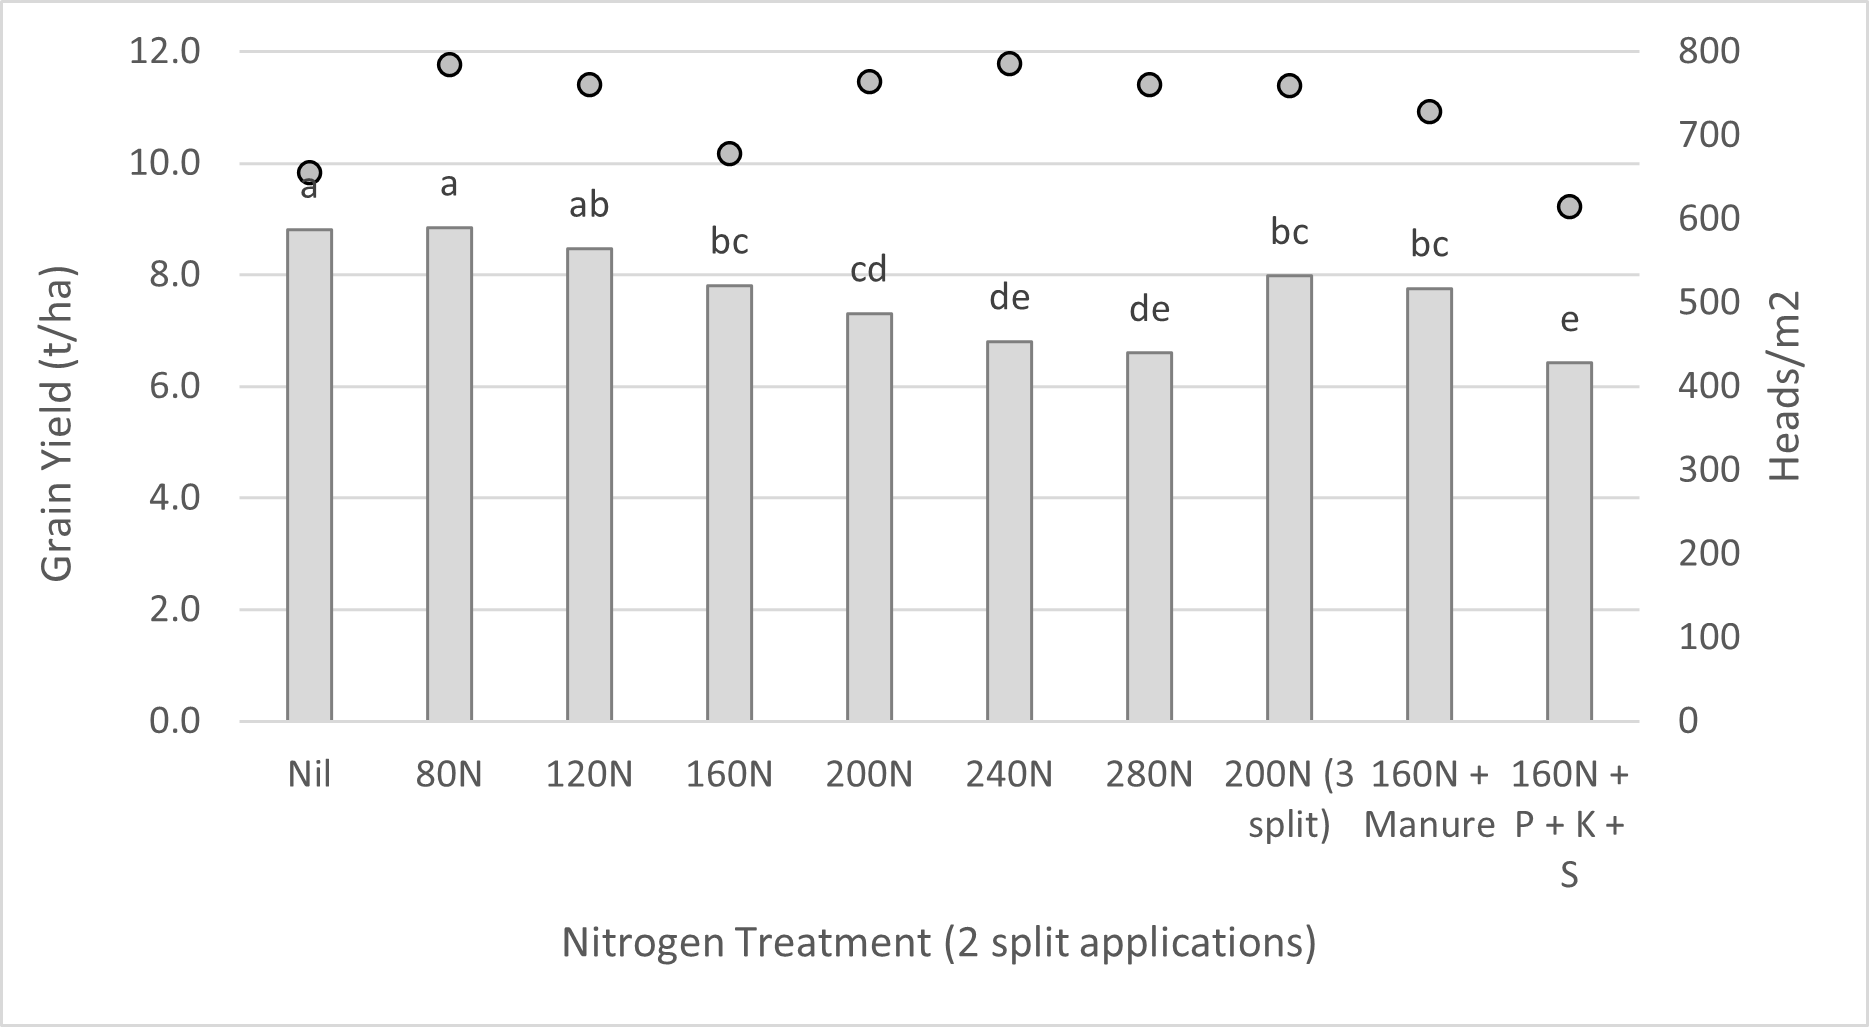
Figure 3. Influence of applied nitrogen, manure and other nutrients on yield and head number – HYC Wallendbeen, NSW 2022. Columns denote grain yield and dots show heads/m2.
Notes: N applied as urea (46% N) was applied at tillering (21 June) and GS31 (27 August).
Soil available N in winter (4 July): 0–10cm 39kg N/ha; 10–30cm 56kg N/ha; 30–60cm 46kg N/ha.
Chicken manure pellets applied at 5t/ha with an analysis of N 3.5%, P 1.8%, K 1.8% and S 0.5%. Columns with different letters are statistically different P = 0.05, Lsd: 0.79t/ha.
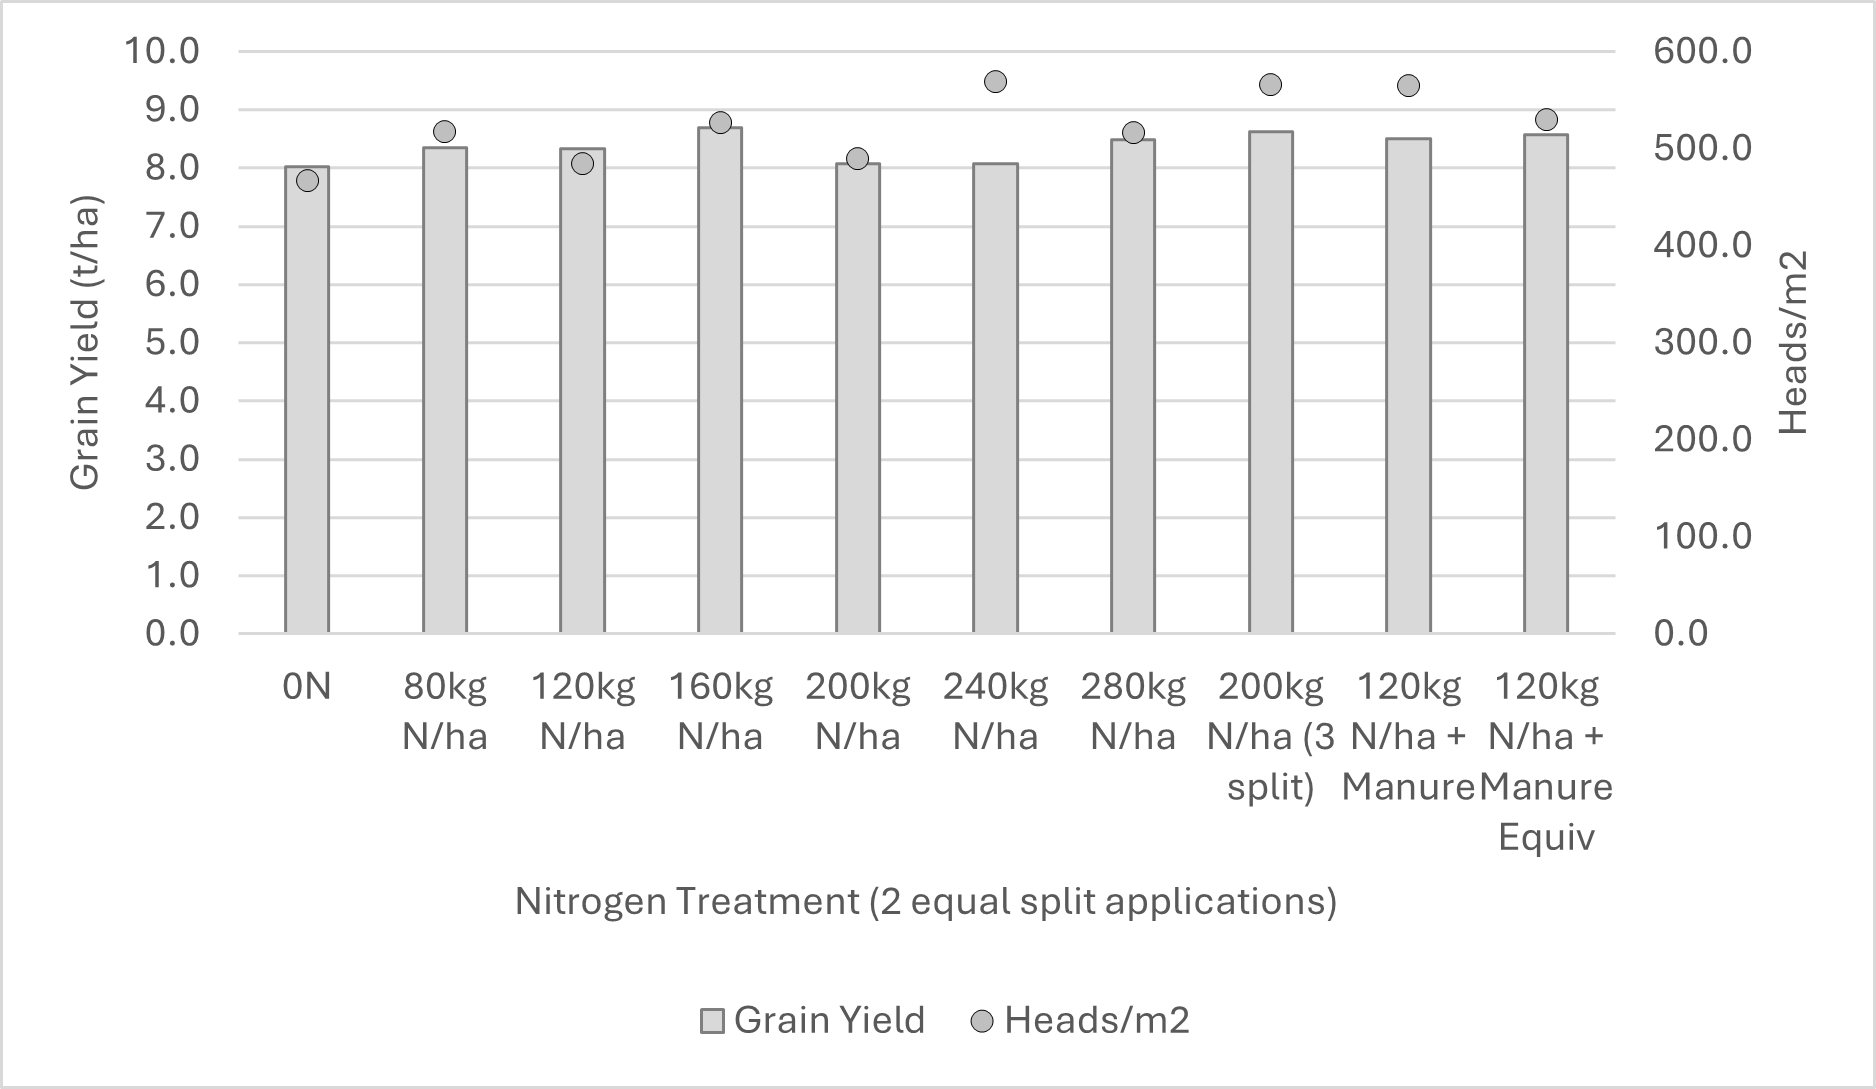
Figure 4. Influence of applied nitrogen, manure and other nutrients on yield and head number – HYC Wallendbeen, NSW 2023. Columns denote grain yield (P = 0.142) and dots show heads/m2 (P =0.105).
Notes: N applied as urea (46% N) was applied at GS30 (22 July) and GS32 (9 August).
Soil available N in winter (10 Jul): 0–10cm 43kg N/ha; 10–30cm 70kg N/ha; 30–60cm 113kg N/ha.
Cattle feedlot manure applied at 5t/ha with an analysis of N 1.14%, P 0.68%, K 1.5% and S 0.4%.
Despite drier conditions in 2023, the results show that fertile soils with high soil organic matter (SOM) have the potential to mineralise sufficient N to achieve potential yield. This is shown by the nil fertiliser rate in Figures 3 and 4. In fact, since 2016 in HYC research, optimum applied fertiliser N rates have rarely exceeded 200kg N/ha for the highest yielding crops, even though the crop canopies (biomass) that these yields are dependent on, are observed to remove far more N than has been applied. This indicates N supply in the hyper yielding sites is most likely provided by the mineralisation of N from (SOM) pre-sowing and in-crop. The 8.0t/ha (2023) and 8.8t/ha (2022) yields from the nil N treatment are indicative of fertile farming systems, where N recovery efficiencies from SOM are typically much higher (70%, Baldock 2019) than those achieved with fertiliser N, which is often reported at 44% (Vonk et al. 2022; Angus and Grace 2017). Consequently, the same yield (8.8t/ha) supplied entirely by N fertiliser would require 400kg N/ha, assuming an N efficiency of 44%.
Protecting yield potential
Many regions experienced just how important it is to protect yield potential from stripe rust in 2022 and 2023, with many growers describing the stripe rust epidemic in 2022 as the worst in 20, if not 50 years. Disease management, over the last four years, has been shown to be a key factor in securing high yielding crops in HYC project trials. It is also one of the main factors in securing high yields and closing the yield gap in favourable seasons in low to medium rainfall zones (L-MRZ). Millicent Germplasm Evaluation Network (GEN) 2023 rials, in the drier season of 2023, again illustrated the importance of combining the best disease management strategy with the best germplasm (variety) (Figure 5).
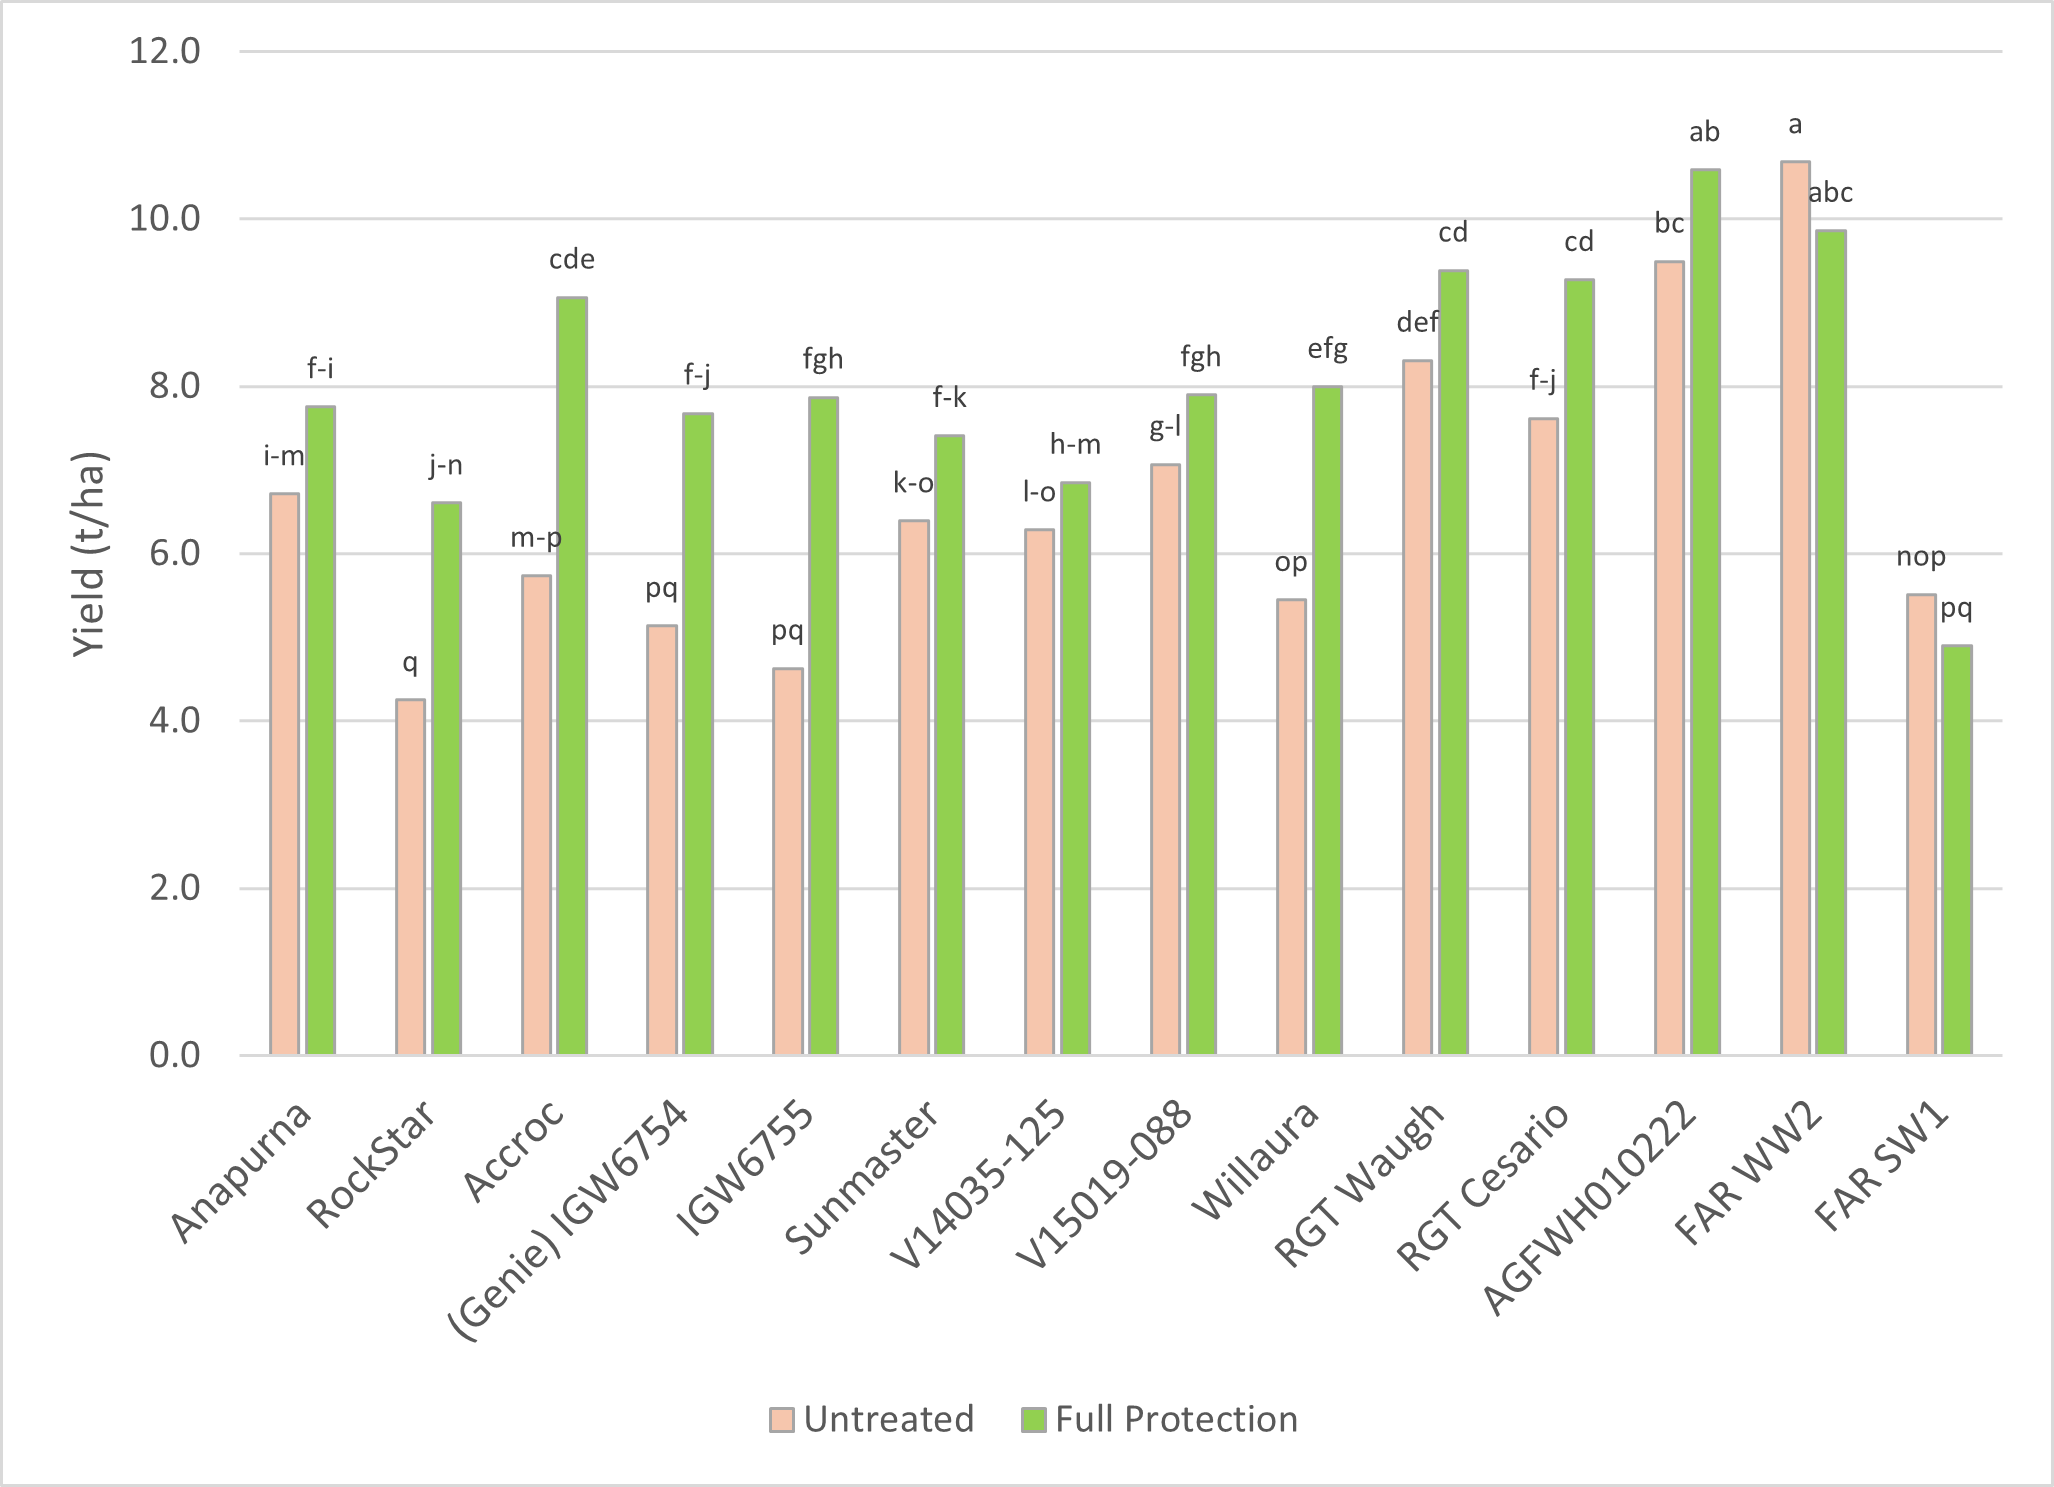
Figure 5. Influence of wheat cultivar and fungicide application (three foliar sprays GS31, GS39 and GS59) on grain yield (t/ha) when the principal diseases were stripe rust and Septoria tritici blotch – FAR Australia Germplasm Evaluation Network (GEN) 2023, Millicent, SA. LSD Cultivar x fungicide management – LSD 1.11t/ha, p value <0.001
Varieties covered by Plant Breeders Rights (PBR)
When conditions are wet during stem elongation when the principal upper canopy leaves emerge (flag, flag-1, flag-2), fungicide application is essential to protect yield potential in these environments. Infection was so severe in 2022, that fungicide timing and the strength of the active ingredients being used made significant differences in productivity. Long ‘calendar gaps’ of over four weeks between fungicides resulted in the epidemic becoming out of control in many crops, as unprotected leaves became badly infected in the period between sprays, and applications became more dependent on limited curative activity rather than protectant activity. The wider issue that the success of fungicide management raises is that pathogen resistance to fungicides is primarily driven by the number of applications of the same mode of action. This is why it is imperative to incorporate the most resistant, high yielding and adapted (phenology) germplasm available to reduce our dependence on fungicide agrichemicals.
Acknowledgements
The research undertaken as part of these projects is made possible by the significant contributions of growers through both trial cooperation and the support of the GRDC, the authors would like to thank them for their continued support. FAR Australia gratefully acknowledges the support of all research and extension partners in the Hyper Yielding Crops project. These are CSIRO, the Department of Primary Industries and Regional Development (DPIRD) in WA, Brill Ag, Southern Farming Systems (SFS), Techcrop, the Centre for eResearch and Digital Innovation (CeRDI) at Federation University Australia, MacKillop Farm Management Group (MFMG), Riverine Plains Inc and Stirling to Coast Farmers. FAR also acknowledges the funding support of breeders with the Germplasm Evaluation Network (GEN).
References
Baldock J (2019) Nitrogen and soil organic matter decline - what is needed to fix it? ()
Porker K, Poole N, Warren D, Lilley J, Harris F, Kirkegaard J (2024) Influence of photothermal quotient in the critical period on yield potential of cereals – a comparison of wheat and barley. *Field Crops Research* (under review in special issue).
FAR Australia Resources and Publications
Contact details
Nick Poole
Field Applied Research (FAR) Australia
Shed 2/63 Holder Rd, Bannockburn, Victoria 3331
03 5265 1290
0499 888 066
nick.poole@faraustralia.com.au
Max Bloomfield
Field Applied Research (FAR) Australia
Shed 2/63 Holder Rd, Bannockburn, Victoria 3331
03 5265 1290
0477 786 441
Max.Bloomfield@faraustralia.com.au
Daniel Bosveld
Field Applied Research (FAR) Australia
Shed 2/63 Holder Rd, Bannockburn, Victoria 3331
03 5265 1290
0477 025 055
Daniel.Bosveld@faraustralia.com.au
GRDC Project Code: FAR2004-002SAX, FAR1506-001RTX,