Understanding the nitrogen contribution of chickpeas – paddock survey of 25 crops across Queensland in 2023
Understanding the nitrogen contribution of chickpeas – paddock survey of 25 crops across Queensland in 2023
Author: David Lester (DPI QLD), Jordan Davis (DPI QLD), Doug Sands (DPI QLD), Nikki Seymour (DPI QLD) | Date: 05 Mar 2025
Take home message
- Chickpeas in Queensland in 2023, from a survey of 25 crops, derived a median of 34% of their nitrogen (N) from the atmosphere via symbiotic rhizobial N fixation. The amount of N derived from the atmosphere (Ndfa%) ranged from 11 to 70% and was negatively correlated to the amount of mineral N in the soil at sowing (i.e. lower soil mineral N supply at sowing had higher Ndfa in the chickpeas).
- That 34% Ndfa equated to a median of 50 kg N/ha fixed. Amounts of N fixed ranged from 17 to 119 kg N/ha.
- The amount of N exported (in grain) was estimated from hand harvest cuts, which are generally overestimate yield compared to mechanical harvesting. Median yield was 2.3 t/ha and that took out 63 kg N/ha. The yield range in the survey was from 0.67 t/ha (exporting 20 kg N/ha) up to 5.2 t/ha (159 kg N/ha).
- Fixing 50 kg N/ha and exporting 63 kg N/ha suggests some systems are in a neutral N position based on fixation and removal.
In a survey of 25 chickpea crops in Queensland in 2023:
- Nitrogen (N) from the atmosphere (Ndfa) ranged from 11 to 70% (median 34%) and was inversely correlated with soil mineral N supply
- Total N fixed ranged from 17 to 119 kg N/ha (median 50 kg N/ha)
- N exported from the paddock in grain ranged from 20 kg N/ha (yield 0.67 t/ha) to 159 kg N/ha (yield 5.2 t/ha) with a median 63 kg N/ha (yield 2.3 t/ha)
- N balance (fixation minus removal) varied greatly, however 17 of the 25 paddocks had a N balance of ±25 kg N/ha, or close to neutral.
Introduction
Chickpea is a significant component of crop production across Queensland and northern New South Wales. The rotational benefits of weed control and disease suppression provide growers and advisers with opportunities to improve their cereal production phases.
As a legume, chickpea - if it forms viable relationships with rhizobia bacteria - can fix nitrogen (N) from the atmosphere that can be used for its own growth. This may supplement plant available N supply in the soil. The percentage N derived from atmosphere (Ndfa%) can be measured using a technique known as natural abundance. Briefly, in the natural abundance method, the ratios of two nitrogen isotopes (14N and 15N) are compared between the fixing pulse plant, and a non-fixing reference plant.
At peak biomass of the pulse crop N in that biomass is measured (kg N/ha). Using natural abundance, an estimate of how much of that N came out of the atmosphere (Ndfa%) can be made.
Ndfa% can then be used with the whole plant N measurement (kg N/ha) to calculate how much N was fixed. This number has a factor applied to it as an estimate of the whole plant, because measuring root mass and root nitrogen content is really tricky.
More information on the detail of measuring N fixation is available in Unkovich et al., (2008).
2023 survey activities
At least 5 paddocks of chickpeas were surveyed in each of five subregions within central and southern Queensland (nominally the Central Highlands, Dawson Callide, Border Rivers-Balonne, Darling Downs, and the Western Downs-Maranoa).
Soil samples at sowing time of the chickpeas were collected to characterise starting soil nitrogen and general fertility. The soil at three locations within approximately one hectare of each paddock was sampled to 1.2 m in five increments (0.0-0.1, 0.1-0.3, 0.3-0.6, 0.6-0.9 and 0.9-1.2m) where possible. The latitude-longitude locations of the paddocks were collected and used to cross reference against the APSoil database for a bulk density value to apply.
Reference plant microplots (about 2 m2) of mustard in CQ, or canola in SQ, were hand sown after removing any germinated chickpea plants.
Plant samples from both the chickpea crop and the reference plants were collected between peak biomass and maturity dry matter (kg/ha) was measured. The plant material was then analysed for both total nitrogen, and isotopic nitrogen. Above ground N mass (kg N/ha) was calculated from biomass (kg/ha) x N%. Ndfa% was calculated as described in Unkovich et al. 2008.
Grain yields on the samples were estimated from thrashing the maturity samples. Seed was analysed for total N, and kg N/ha calculated from yield x N%.
Results
Mineral N available at sowing
Soil mineral nitrogen to three depth increments (0.3, 0.6 and 0.9m) was calculated by adding the component layers together (Figure 1). There were a small number of sites that indicated relatively high soil N supplies at sowing, with two sites having >100 kg mineral N/ha to 0.6m, and four sites >100 kg N/ha to 0.9m. The median values for 0.3, 0.6 and 0.9m respectively were 27, 43 and 53 kg N/ha. Given the skewed distribution of measured values (Figure 1), median rather than average values are reported.
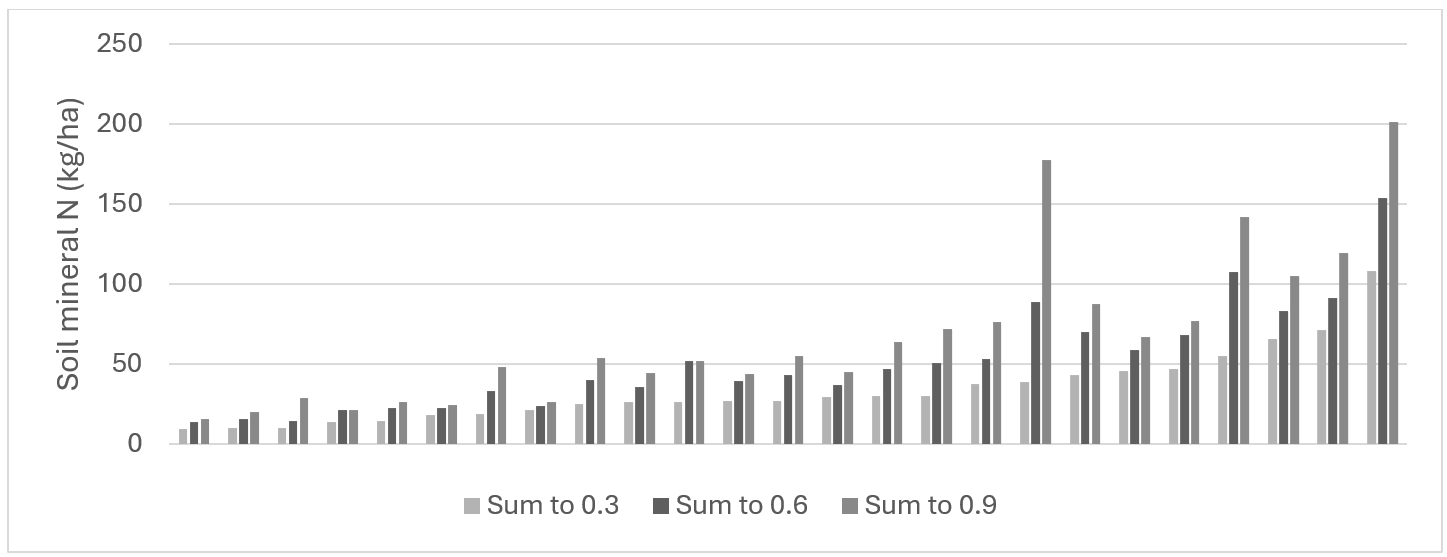
Figure 1. Soil mineral nitrogen supply estimates at sowing of 2023 chickpea to three depth increments
(0.0–0.3, 0.0–0.6 or 0.0–0.9m) for paddocks sampled in the 2023 survey.
Dry matter
Nitrogen fixation is a demand driven process. The more biomass your chickpea (pulse) crop grows, the more nitrogen it needs. This then can be taken from the soil mineral N reserves or fixed from the atmosphere. The natural abundance method allows the determination of where the plants acquired their N from.
For the paddocks sampled in 2023, maturity biomass ranged from a minimum 1735 kg/ha to a maximum 8679 kg/ha, with a median result of 4258 kg/ha (Figure 2). Across the Queensland cropping areas, there was a range of seasonal rainfall that correlates with plant biomass (data not shown).
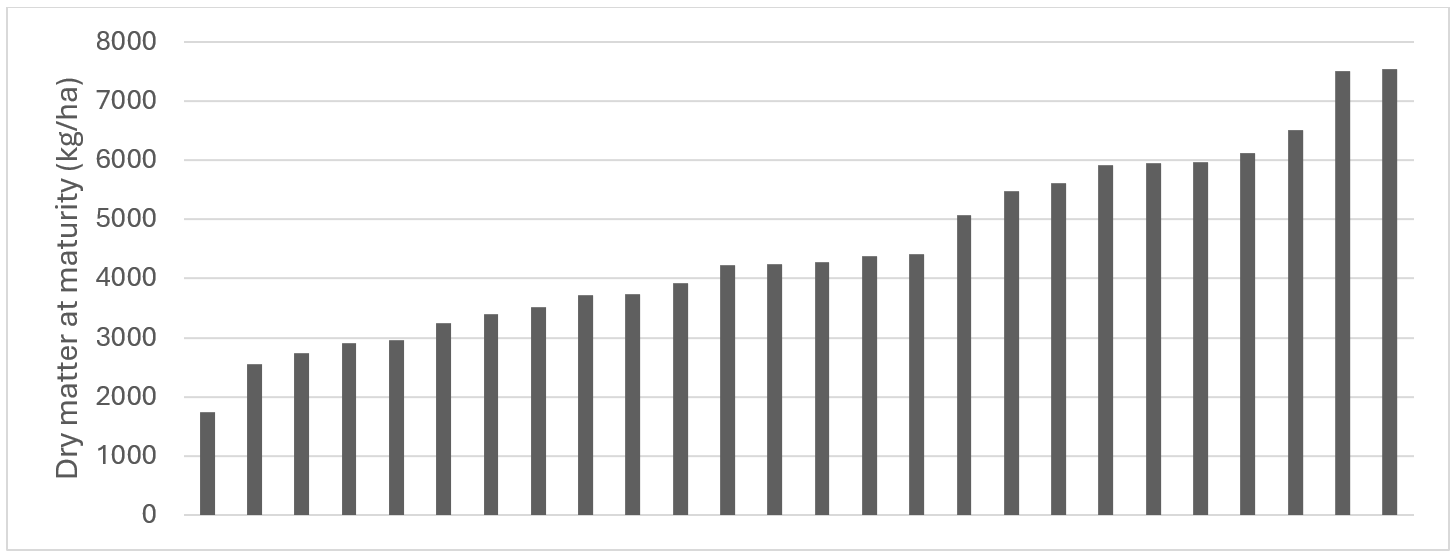
Figure 2. Above ground dry matter (kg/ha) in 2023 Qld chickpea survey samples.
Above ground nitrogen content
The first step in accounting for the nitrogen fixed by the crop is to determine how much nitrogen is in the above ground biomass. As reported, individual biomass samples were sent for total N testing. Nitrogen concentration in the whole above ground plant sample ranged from a low 1.1% to a maximum 2.3%N (data not shown) with a median 1.7%N.
Increasing above ground dry matter was correlated with the amount of nitrogen in the above ground matter (Figure 3). The more above ground dry matter that was grown, the more nitrogen was contained within it. Above ground nitrogen ranged from 26 to 161 kg N/ha. Whole plant nitrogen for chickpea is approximated as double the above ground nitrogen.
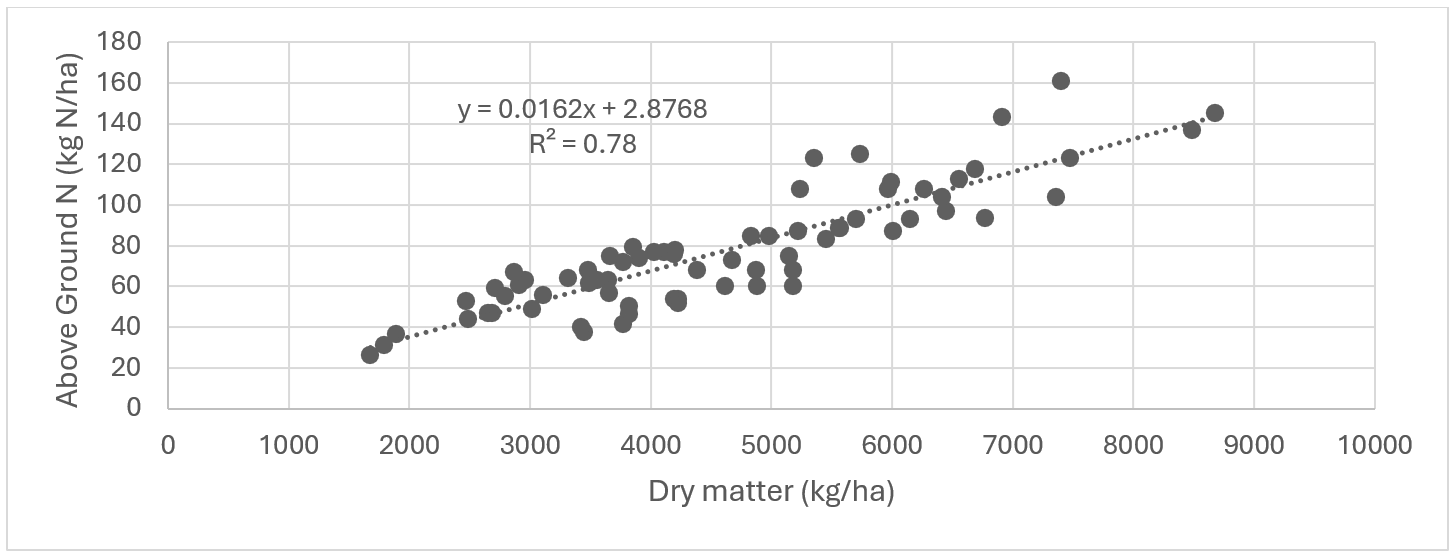
Figure 3. Above ground N (kg N/ha) in 2023 Qld chickpea survey samples.
Nitrogen derived from atmosphere
Samples of both the chickpea and reference plant were analysed for 15N composition (data not shown). The differences between the proportions of 15N and 14N between them allowed estimation of the amount of N that came from the atmosphere.
In the 2023 paddock survey, the most common amount of N fixed (Ndfa%) was 34% however this was across a range of values from 11 to 69% (Figure 4). Explaining why a particular Ndfa% result occurred on a site, relates to the starting soil N supply, and plant growth (the demand side of the equation).
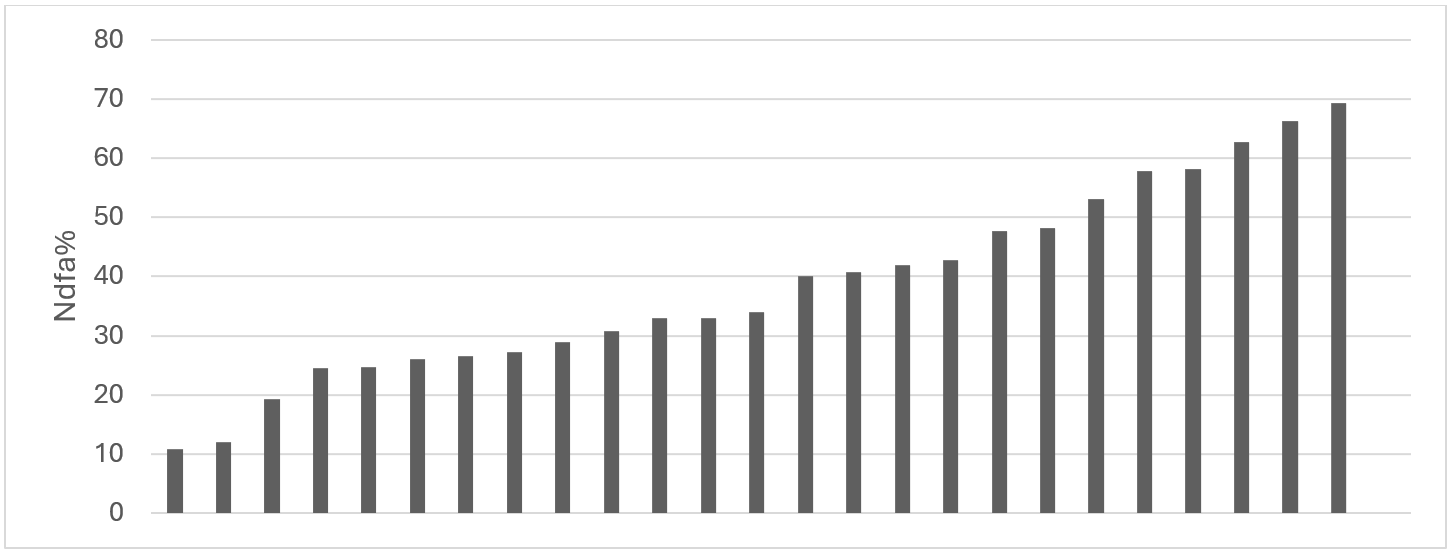
Figure 4. Nitrogen derived from atmosphere (Ndfa (%)) for 2023 Qld chickpea survey samples.
We can look at the impact of soil N supply by relating it to Ndfa% (Figure 5). You can observe the negative relationship between soil N supply at sowing and Ndfa%. This makes sense because as soil N supply increases, the potential need to fix N from the atmosphere declines. You will note that there is a range of Ndfa% results for each soil N supply. For <20 kg N/ha, Ndfa% can be over 60% (a high N fixing environment) or as low as 20%. Between 20 and 40 kg N/ha soil supply, Ndfa% ranges from 10 to 55%. The relationship between soil N to 0.6m and 0.9m and Ndfa% are similar (data not shown).
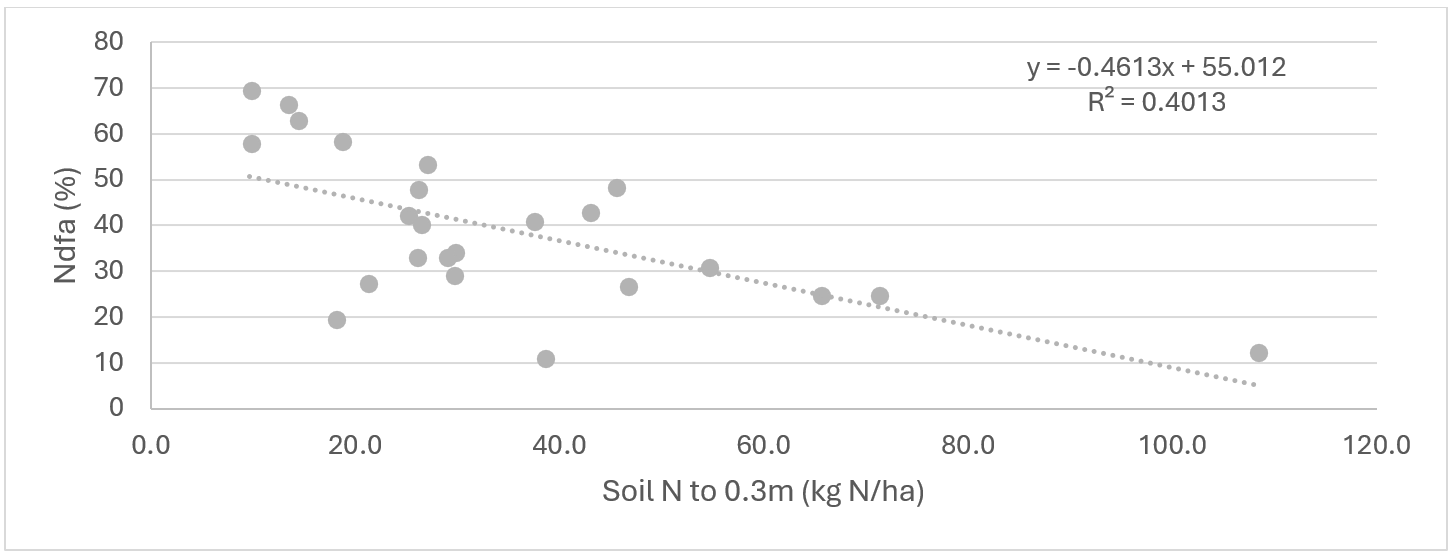
Figure 5. Soil mineral N (kg N/ha) to 0.3m vs Ndfa% for 2023 Qld chickpea survey crops.
Mass of nitrogen fixed
The Ndfa% result just tells us what proportion of nitrogen was fixed from the atmosphere by the chickpeas. To estimate what that mass of nitrogen per hectare is, we multiply the above ground nitrogen content (see Figure 3) by the Ndfa%.
Across Queensland chickpea paddocks surveyed in 2023, a median of 50 kg N/ha was fixed, ranging from 17 up to 119 kg N/ha (Figure 6).
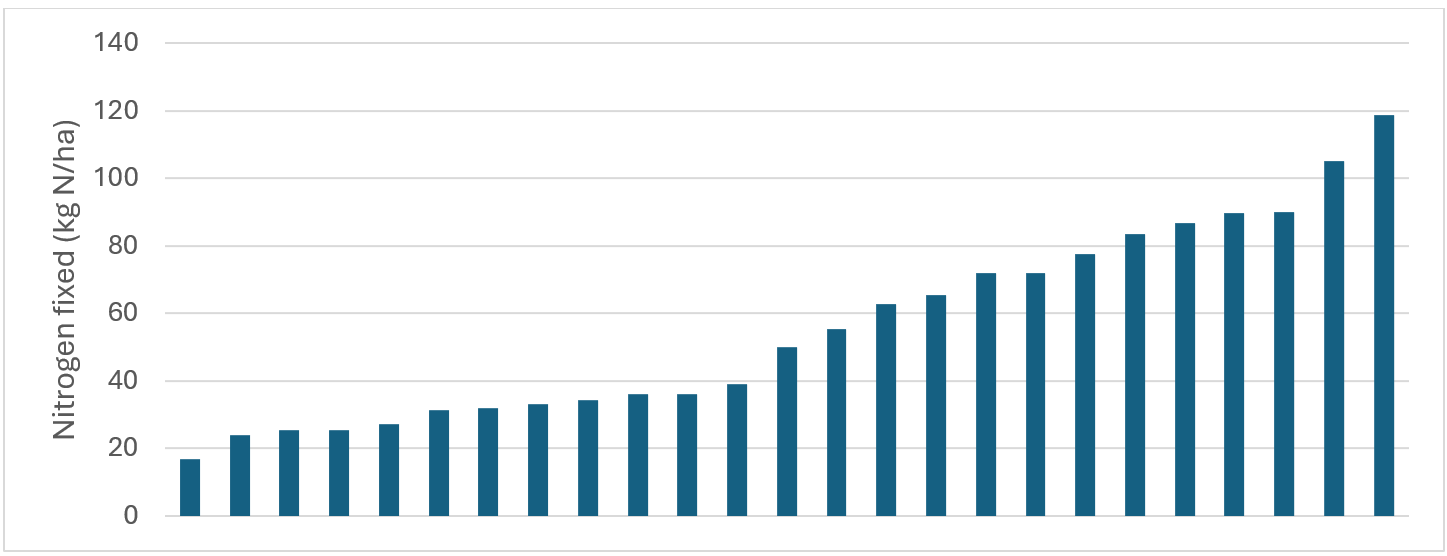
Figure 6. Nitrogen fixed (kg N/ha) by 2023 Qld chickpea survey crops.
Grain yield
Grain yield is how nitrogen is exported from the field – the output pathway. For this study, the grain yields are measured from the hand harvested biomass samples and therefore will be greater than the whole the paddock value as there are no harvesting losses.
Grain yields (from hand harvest cuts) ranged from 667 to 5210 kg/ha, with a median 2280 kg/ha (Figure 7).
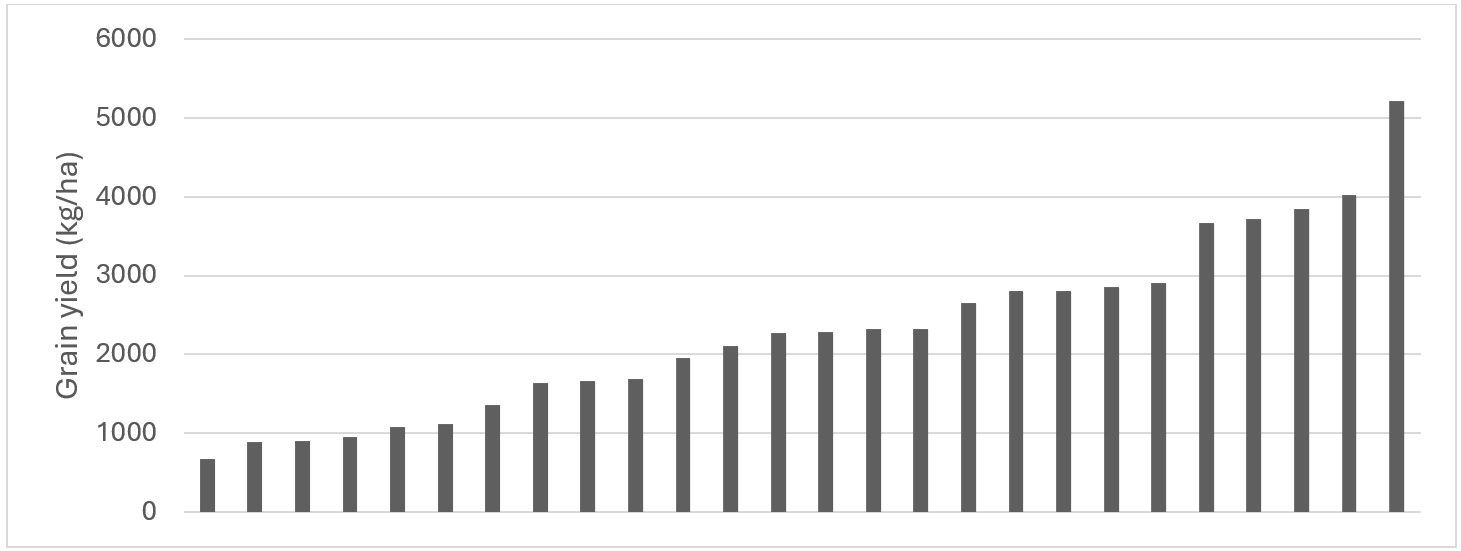
Figure 7. Hand harvest grain yield (kg/ha) of 2023 Qld chickpea survey crops.
Grain harvest index
One of the cross checks for yield and biomass data is the relationship of harvest index: grain yield divided by the total above ground biomass at maturity. For the survey data in this project, the values are correlated with the dry matter biomass yields (Figure 8). The value of 0.51of the slope is higher than commonly reported of 0.35, i.e. there is more grain harvested per unit of above ground biomass. Higher grain yields will increase grain nitrogen exported, so potentially have implications for paddock nitrogen balances.
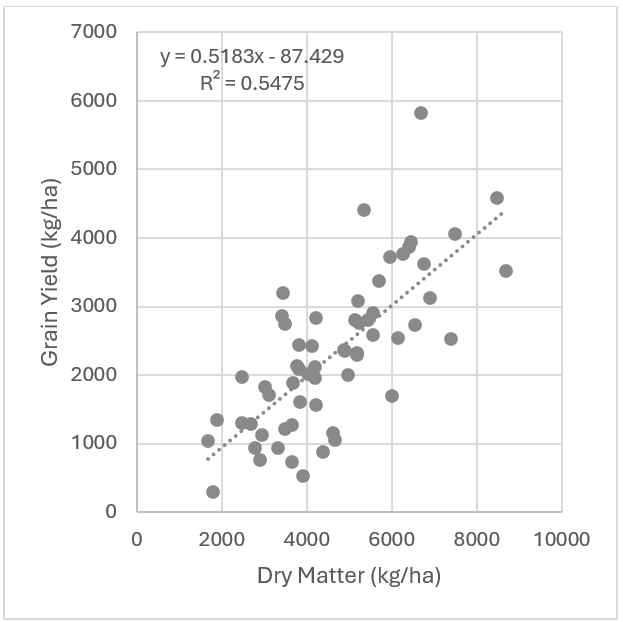
Figure 8. The relationship between grain yield and above ground dry matter (harvest index) of 2023 Qld chickpea survey crops.
Grain nitrogen export
As expected, the amount of nitrogen removed from the field is highly correlated with grain yield (Figure 9). In 2023, the median N exported in chickpea grain was 63 kg N/ha (in 2.28 t/ha grain) and ranged from a low of 20 kg N/ha (in 0.67 t/ha grain) to a maximum of 159 kg N/ha (in 5.2 t/ha). These grain N exports are highly leveraged against the yield, which as discussed are likely to be higher than would be measured in paddocks with machine harvesting. Given the over-estimation of yield, these removal values are inflated.
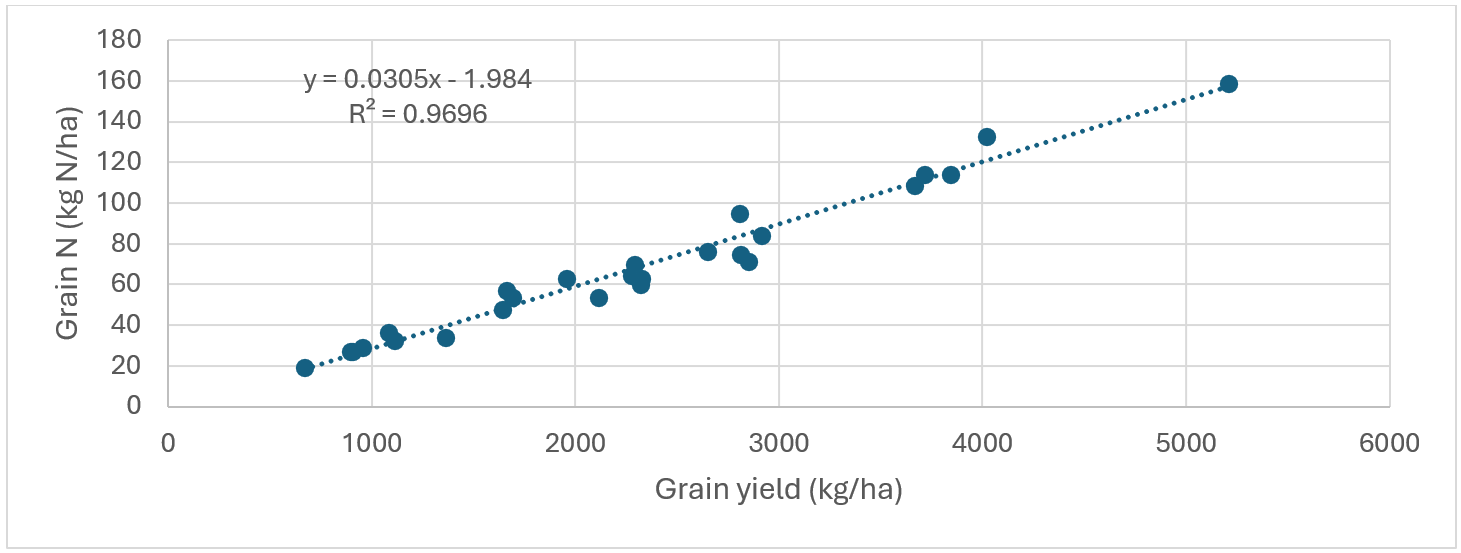
Figure 9. Grain yield (kg/ha) vs grain N (kg N/ha) for 2023 Qld chickpea survey crops.
Paddock nitrogen balance
Nitrogen balance is the difference between nitrogen fixed by the whole plant (above and below ground) and the nitrogen exported in grain (Figure 9). There was a wide range of nitrogen balance outcomes (Figure 10) from a deficit of -63 kg N/ha to a gain of 83 kg N/ha. Seventeen of the survey paddocks fall within a range of -25 to +25 kg N/ha.
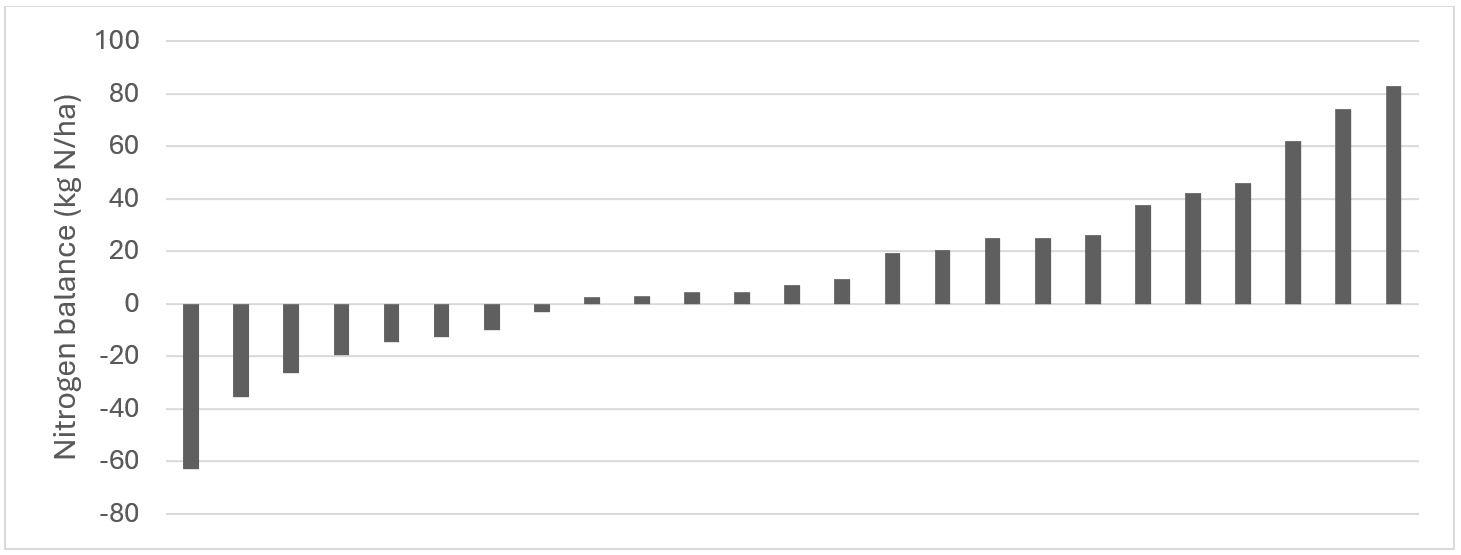
Figure 10. Nitrogen balance (whole plant N fixed minus grain N exported, kg N/ha) of 2023 Qld chickpea survey cops.
Reference
Unkovich M, Herridge D, Peoples M, Cadisch G, Boddey B, Giller K, Alves B and Chalk (2008). Measuring plant-associated nitrogen fixation in agricultural systems. Canberra, Australian Centre for International Agricultural Research.
Acknowledgements
The research undertaken as part of this project is made possible by the significant contributions of growers through both trial cooperation and the support of the GRDC, and the State of Queensland acting through the Department of Primary Industries; the authors would like to thank them for their continued support.
We thank the community of grower cooperators for their generous support in allowing access and conducting of the research on their farms.
The delivery of these experiments would not be possible without the dedication of the team of technical and operational staff in DPI at Emerald, Kingaroy, Goondiwindi and Toowoomba who make this happen. The authors appreciate the efforts of our staff to deliver these experiments.
Contact details
David Lester
Queensland Department of Primary Industries
david.lester@daf.qld.gov.au
Date published
March 2025
GRDC Project Code: DAQ2303-006RTX,
